Features
Guideline to enable monitoring of Siebel Enterprise, Web Server, Gateway and other Object Manager (a.k.a Siebel Component). This assumes you have already deployed Germain UX - Engine for your Siebel CRM instance.
Our Recommendations: Synthetic / RPA Bots should be the first thing you ever implement for Siebel (or any other application), in order to be alerted when major availability issues occur. Then everything should come next: Siebel Web, Application, Gateway, Database can all be monitored with GermainUX. our 20-year experience with Siebel is preconfigured in GermainUX, and any of that is easily customizable.
Configure
Essential health and Application Performance Monitoring for Oracle Siebel CRM occurs via Germain UX Engine.
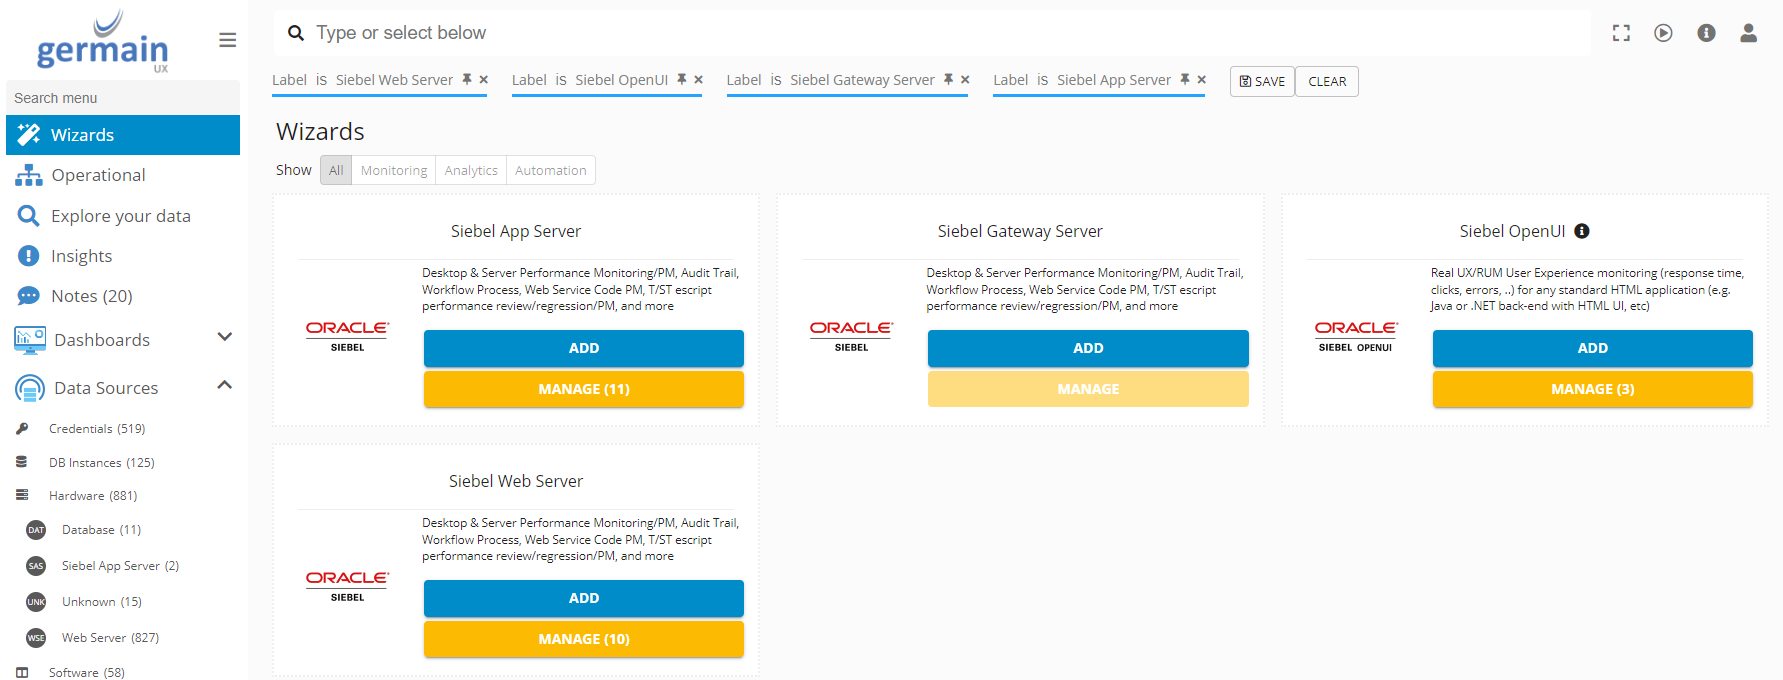
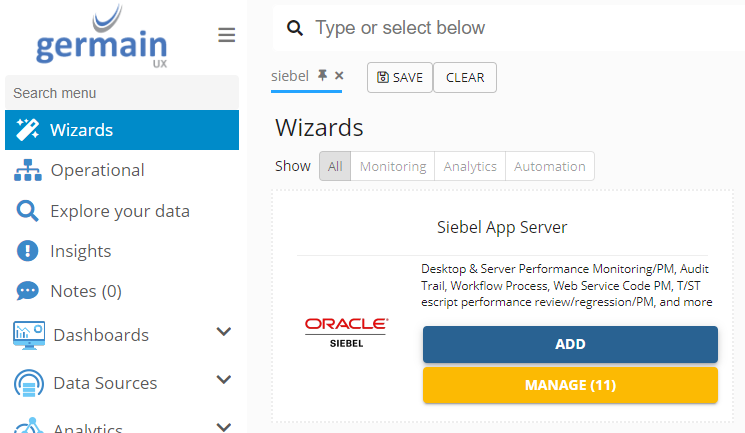
Log on to Germain Workspace > left menu > Wizards > Siebel
Import Siebel Component Types
For new deployment, please import Siebel seed data from all json files under Server Distribution/configuration/siebel by making REST calls using “REST Client” in the Germain Configuration Console. Select “merge” option while executing the REST calls. Check that the following components exist under germain.apm.monitoringConfig.components:
-
Siebel Object Manager Parser
-
Siebel Enterprise Manager Parser
-
Siebel Crash Parser
-
Siebel 7.x FDR Parser
-
Siebel 8.x FDR Parser
-
Siebel Crash Directory Monitor
-
Siebel Log Directory Monitor
-
Siebel Component Monitor (WMI)
-
Siebel Component Monitor (SSH)
-
Siebel HTTP Monitor
-
Siebel Enterprise Configuration Monitor
-
Siebel Collator
Add the Siebel Server
-
Germain Workspace > Left Menu > Wizard > Siebel App Server
Add credentials
Germain Workspace > Left Menu > Systems > Auth Settings > Authentications
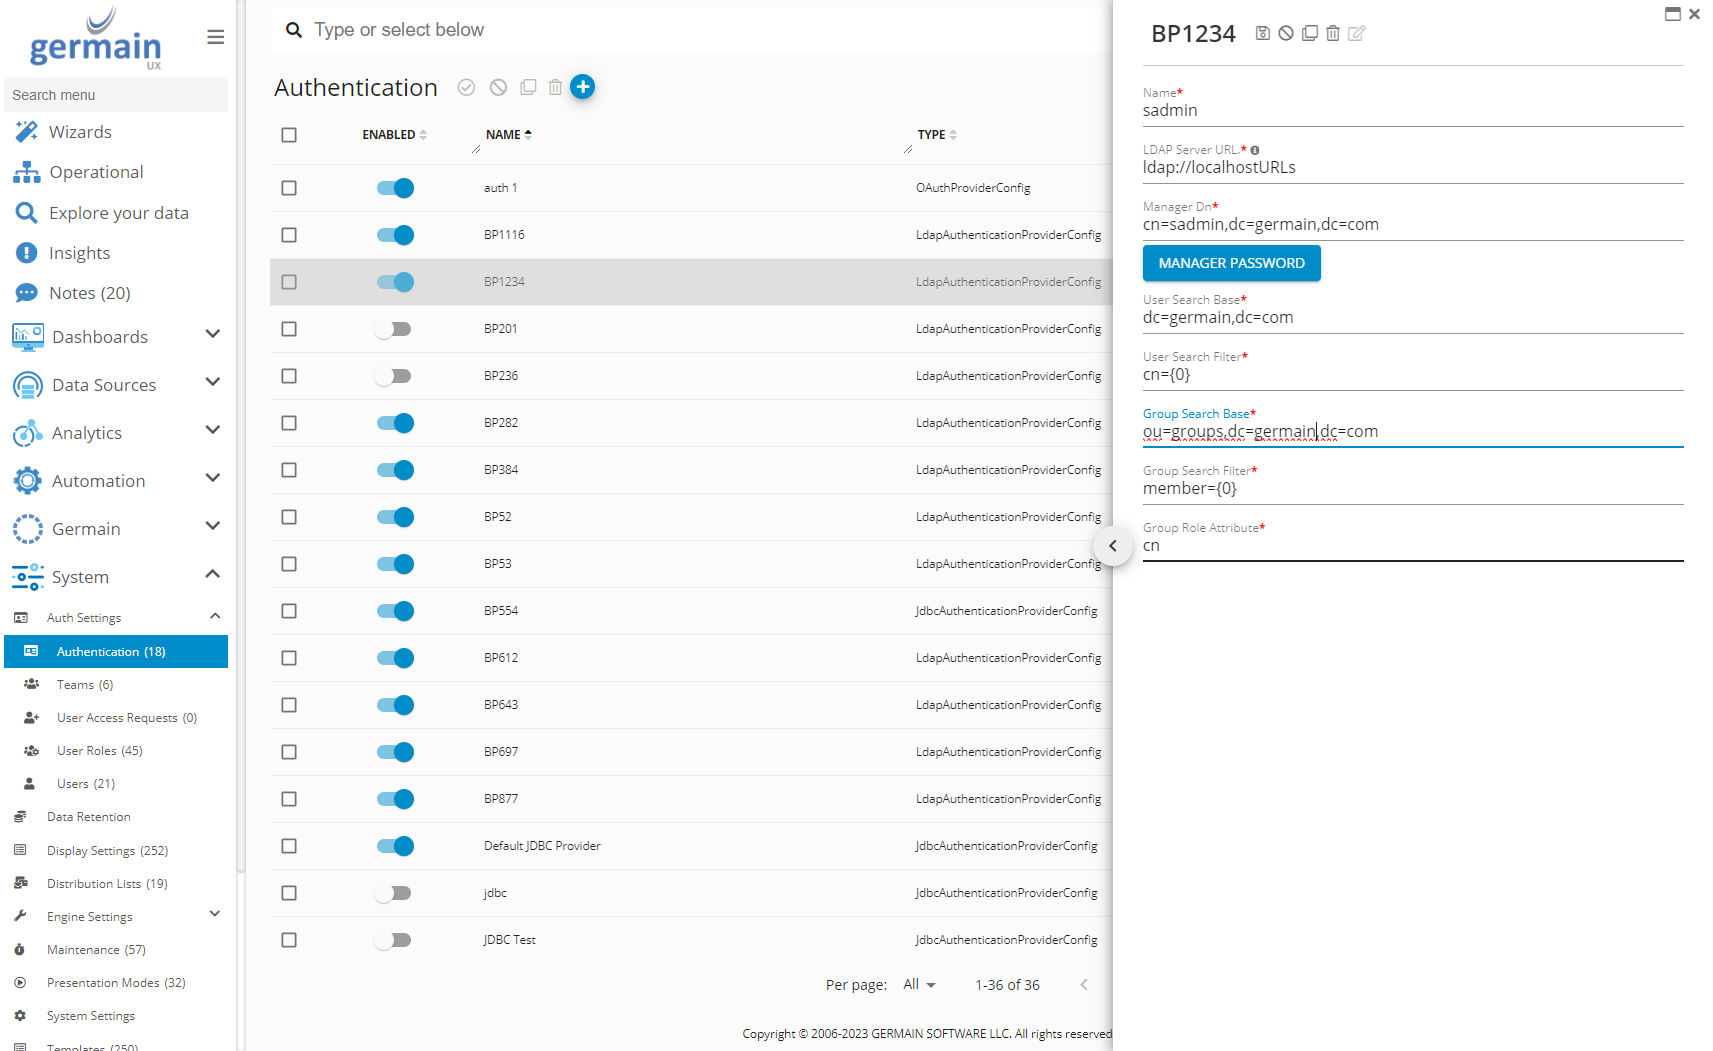
Enter the credentials for you Siebel server, usually it is SADMIN. If needed, enter the Domain, Secure Key
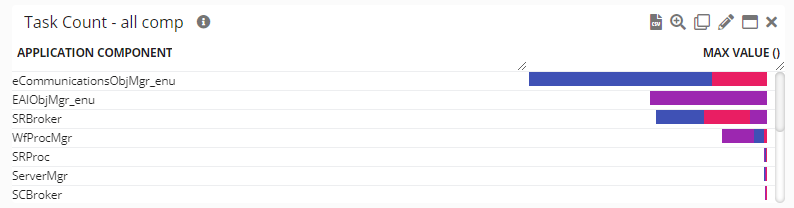
Siebel Task level Monitoring
It is critical to enable Task level monitoring properly and inline to the below best practices. Often customers ignore those and always end up restart the whole enterprise when an issue comes up since they have no visibility as to what is causing an issue. Monitoring Tasks to this level will help avoid enterprise downtime and other errors.
-
Adjust the below Thresholds based on what is running on your Siebel environment. These values may need to be adjusted according to the Siebel version, etc.
-
Get management approval for these SLA:
|
Siebel Component |
Acceptable CP_DISP_RUN_STATE |
CP_NUM_RUN_TASKS Threshold(s) |
CP_ACTV_MTS_PROCS
|
|
WorkActn |
Status = Running, Shutdown |
n/a |
CP_MAX_MTS_PROCS |
|
WorkMon |
Status = Running, Shutdown |
n/a |
CP_MAX_MTS_PROCS |
|
Wf* |
Status = Running, Shutdown or Online |
CP_NUM_RUN_TASKS<95% of CP_MAX_TASKS |
CP_MAX_MTS_PROCS |
|
*ObjMgr* |
Status = Running, Shutdown or Online |
CP_NUM_RUN_TASKS<95% of CP_MAX_TASKS |
CP_MAX_MTS_PROCS |
|
SRBroker |
Status = Running, Shutdown or Online |
CP_NUM_RUN_TASKS<95% of CP_MAX_TASKS |
CP_MAX_MTS_PROCS |
|
SRProc |
Status = Running, Shutdown |
CP_NUM_RUN_TASKS=DfltTasks (should be 2) |
CP_MAX_MTS_PROCS |
|
SCBroker |
Status = Running, Shutdown |
CP_NUM_RUN_TASKS=DfltTasks (should be 2) |
N/A |
|
Other Siebel Component |
Status = Running, Shutdown or Online |
CP_NUM_RUN_TASKS<95% of CP_MAX_TASKS |
CP_MAX_MTS_PROCS |
-
Germain Workspace > Left Menu > Analytics > Rules > siebel-app-monitor-drl >
Component Task Metrics
Example:
rule "Component Task Metrics"
when
$r : ListComponentsOutputRecord( cpDispRunState in ( "Online", "Running" ), cpMaxTasks > 0 )
$tasks : List( ) from collect ( ListTasksOutputRecord( ccAlias == $r.ccAlias ) )
then
StringBuilder sb = new StringBuilder();
for (ListTasksOutputRecord t : $tasks) {
sb.append(t.svName);
sb.append("\t");
sb.append(t.ccAlias);
sb.append("\t");
sb.append(t.cgAlias);
sb.append("\t");
sb.append(t.tkTaskId);
sb.append("\t");
sb.append(t.tkPid);
sb.append("\t");
sb.append(t.tkDispRunstate);
sb.append("\t");
sb.append(t.ccRunmode);
sb.append("\t");
sb.append(t.tkStartTime);
sb.append("\t");
sb.append(t.tkEndTime);
sb.append("\t");
sb.append(t.tkStatus);
sb.append("\t");
sb.append(t.tkParentTaskId);
sb.append("\t");
sb.append(t.ccIncarnationNum);
sb.append("\t");
sb.append(t.tkLabel);
sb.append("\t");
sb.append(t.tkTasktype);
sb.append("\t");
sb.append(t.tkPingTime);
sb.append("\n");
}
// Number of running tasks per component
GenericMetric m = new GenericMetric();
m.timestamp = OffsetDateTime.now();
m.type = "Siebel:Task";
m.name = $r.ccRunmode;
m.value = (double)$r.cpNumRunTasks;
m.details = sb.toString();
m.application.component = $r.ccAlias;
datamart.insert(m, context);
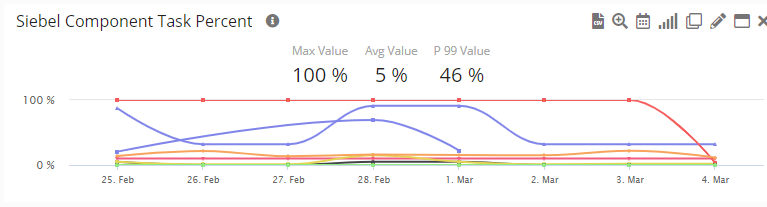
// Pct of max tasks running per component
m = new GenericMetric();
m.timestamp = OffsetDateTime.now();
m.type = "Siebel:TaskPct";
m.name = $r.ccRunmode;
m.value = Math.round(((double)$r.cpNumRunTasks / (double)$r.cpMaxTasks) * 100.0 * 1000.0) / 1000.0;
m.details = sb.toString();
m.application.component = $r.ccAlias;
datamart.insert(m, context);
// Number of running tasks per process for this component
int numProcs = $r.cpActvMtsProcs == 0 ? 1 : $r.cpActvMtsProcs;
m = new GenericMetric();
m.timestamp = OffsetDateTime.now();
m.type = "Siebel:Running Tasks Process";
m.name = $r.ccRunmode;
double numTasksPerProc = (double)$r.cpNumRunTasks / (double)numProcs;
m.value = numTasksPerProc;
m.details = sb.toString();
m.application.component = $r.ccAlias;
datamart.insert(m, context);
// Max number of running tasks per process for this component
int maxProcs = $r.cpMaxMtsProcs == 0 ? 1 : $r.cpMaxMtsProcs;
m = new GenericMetric();
m.timestamp = OffsetDateTime.now();
m.type = "Siebel:Max Tasks Process";
m.name = $r.ccRunmode;
double maxTasksPerProc = (double)$r.cpMaxTasks / (double)numProcs;
m.value = maxTasksPerProc;
m.details = sb.toString();
m.application.component = $r.ccAlias;
datamart.insert(m, context);
// Pct of max tasks per process for this component
m = new GenericMetric();
m.timestamp = OffsetDateTime.now();
m.type = "Siebel:TaskPct Process";
m.name = $r.ccRunmode;
m.value = Math.round((numTasksPerProc / maxTasksPerProc) * 100.0 * 1000.0) / 1000.0;
m.details = sb.toString();
m.application.component = $r.ccAlias;
datamart.insert(m, context);
end
rule "Component Mts Metrics"
when
$r : ListComponentsOutputRecord( cpDispRunState in ( "Online", "Running" ), cpMaxMtsProcs > 0 )
then
// Number of running processes
GenericMetric m = new GenericMetric();
m.timestamp = OffsetDateTime.now();
m.type = "Siebel:MtsProcs";
m.name = $r.ccAlias;
m.value = (double)$r.cpActvMtsProcs;
m.application.component = $r.ccAlias;
datamart.insert(m, context);
// Percent running of max processes
m = new GenericMetric();
m.timestamp = OffsetDateTime.now();
m.type = "Siebel:MtsProcsPct";
m.name = $r.ccAlias;
m.value = ((double)$r.cpActvMtsProcs/(double)$r.cpMaxMtsProcs) * 100.0;
m.application.component = $r.ccAlias;
datamart.insert(m, context);
end
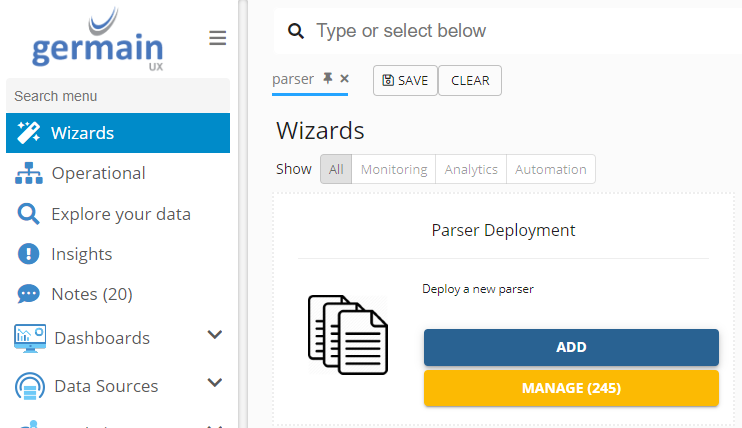
Siebel Component / Object Manager Parser (Configuration)
-
Germain Workspace > Left Menu > Wizards > Parser
-
Select the Germain Monitoring Node ( UX ) and Engine (DefaultEngine)
-
Fill the details as
-
Parser Component Type: Siebel Object Manager Parser (Windows/Unix as applicable)
-
Monitored Application: Siebel (or change if application name changed)
-
Monitored Application Component: None (or change if needed)
-
Number of instances: 1
-
-
Additional Configuration - Set the localized resource files for Siebel log parsers
-
Set resourceFile to /com/germainsoftware/apm/localization/parser-siebel-objmgr-enu.properties
-
Siebel Server Manager Parser (Configuration)
-
Germain Workspace > Left Menu > Wizards > Parser
-
Select the Germain Monitoring Node ( UX ) and Engine (DefaultEngine) , Click Next
-
Fill the details as
-
Parser Component Type: Siebel Enterprise Manager Parser
-
Monitored Application: Siebel (or change if application name changed)
-
Monitored Application Component: None (or change if needed)
-
Number of instances: 1
-
-
Click Next, Verify the details and click Submit
-
Additional Configuration - Set the localized resource files for Siebel log parsers
-
Set resourceFile to /com/germainsoftware/apm/localization/parser-siebel-em-enu.properties
-
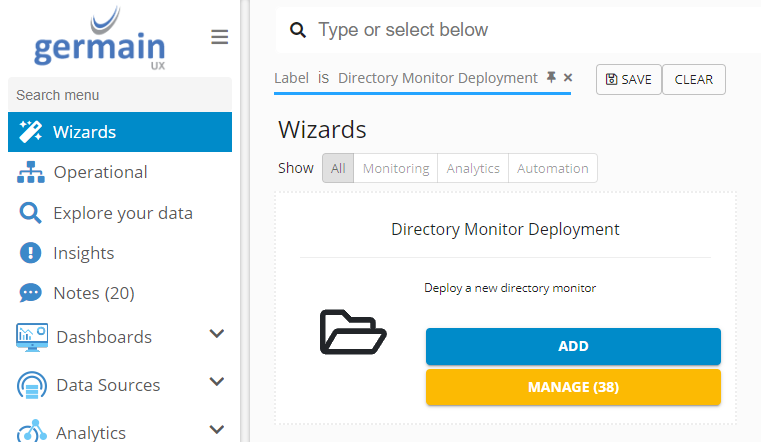
Directory Manager for Siebel log Files
-
Germain Workspace > Left Menu > Wizard > Directory Monitor
-
Select the Germain Monitoring Node ( UX ) and Engine (DefaultEngine) , Click Next
-
Fill the details as
-
Directory Component Type: Siebel Log Directory Monitor
-
Name – Name to the monitor, Default is Siebel Log Directory Monitor
-
Monitored Server: Select the Server which is created in above steps
-
Path to Monitor: Point to the log files' location on the Siebel Server; reachable from the Germain Server
-
Watch Subdirectories: no
-
Process Existing Files: yes
-
Process Empty Files: no
-
Force Polling: yes
-
Polling Interval (seconds): 300000 (**these are milliseconds **)
-
Click Next, Verify the details and click Submit
Directory Monitor for Siebel Core Files
-
Germain Workspace > Left Menu > Wizard > Directory Monitor
-
Select the Germain Monitoring Node ( UX ) and Engine (DefaultEngine) , Click Next
-
Fill the details as-
-
Directory Component Type: Siebel Crash Directory Monitor
-
Name – Name to the monitor, Default is Siebel Crash Directory Monitor
-
Monitored Server: Select the Server which is created in above stepsr
-
Path to Monitor: Point to the "crash" files' location
-
Watch Subdirectories: no
-
Process Existing Files: yes
-
Process Empty Files: no
-
Force Polling: yes
-
Polling Interval (seconds): 300000 (**these are milliseconds **)
-
Directory Monitor for Siebel Gateway
-
Germain Workspace > Left Menu > Wizard > Directory Monitor
-
Select the Germain Monitoring Node ( UX ) and Engine (DefaultEngine) , Click Next
-
Fill the details as-
-
Directory Component Type: Siebel Enterprise Configuration Monitor
-
Name – Name to the monitor, Default is Siebel Enterprise Configuration Monitor
-
Monitored Server: Select the Server which is created in above steps
-
Path to Monitor: Point to the "siebns.dat" file's location
-
Watch Subdirectories: no
-
Process Existing Files: yes
-
Process Empty Files: no
-
Force Polling: yes
-
Polling Interval (seconds): 300000 (**these are milliseconds **)
-
Remote Monitor for Siebel Server Performance
-
Germain Workspace > Left Menu > Wizard > Directory Monitor
-
Select the Germain Monitoring Node ( UX ) and Engine (DefaultEngine) , Click Next
-
Fill the details as
-
Name: Components Status Monit
-
Monitored Server: Select the Server which is created in above steps
-
Monitored Application: Siebel (or change if application name changed)
-
Credentials: Select the credentials created in above steps
-
Interval: 300
-
Local Connection for WMI?: no
-
Component Type: Siebel Component Monitor (Windows|Unix)
-
-
Click Next, Verify the details and click Submit
-
Additional Configuration - The following configuration references have to be added to the component deployments in the config console
-
SiebelCredentials [e.g. key: germain.apm.monitoringConfig.credentials, itemName: Siebel Admin]
-
SiebelGateway [e.g. value: gcgsiebel77]
-
SiebelServer [e.g. key: germain.apm.monitoringConfig.servers, itemName: gcgsiebel77]
-
SiebelEnterprise [e.g. value: sba_81]
-
SiebelPath [e.g. value: C:\sba811v2]
-
ExcludedComponents [Optional; value: can be empty, or a comma-seperated list of components names to exclude]
-
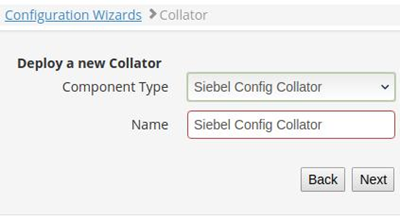
Siebel Config Collator
-
Germain Workspace > Left Menu > System > Root Config > MonitoringConfig > Siebel Config Collator
-
Select the Germain Monitoring Node ( UX ) and Engine (DefaultEngine) , Click Next
-
Fill the details as
-
Component Type: Siebel Config Collator
-
Name: Name default is Siebel Config Collator, can be changed.
-
-
Click Next, Verify the details and click Submit
Siebel HTTP and SISNAPI
-
Germain Workspace > Left Menu > System > Root Config > MonitoringConfig > Siebel HTTP Monitor
-
Select the Germain Monitoring Node ( UX ) and Engine (DefaultEngine) , Click Next
-
Fill the details as-
-
HTTP Component Type: Siebel HTTP Monitor
-
Name: Siebel HTTP Monitor
-
Server: Select the Server which is created in above steps
-
Application: Application to monitor
-
Scheme: HTTP
-
Port: 80 (or change if needed)
-
repeatSeconds: 300
-
-
Click Next, Verify the details and click Submit
-
Additional Configuration - The following configuration references have to be added to the component deployments in the config console
-
For the HTTP Monitor from 4.10
-
-
From Germain Configuration Console, go to your monitoring node, DefaultEngine, components and Siebel HTTP Monitor
-
SiebelCredentials [e.g. key: germain.apm.monitoringConfig.credentials, itemName: Siebel Admin]
-
SiebelComponent [e.g, value: component to test]
-
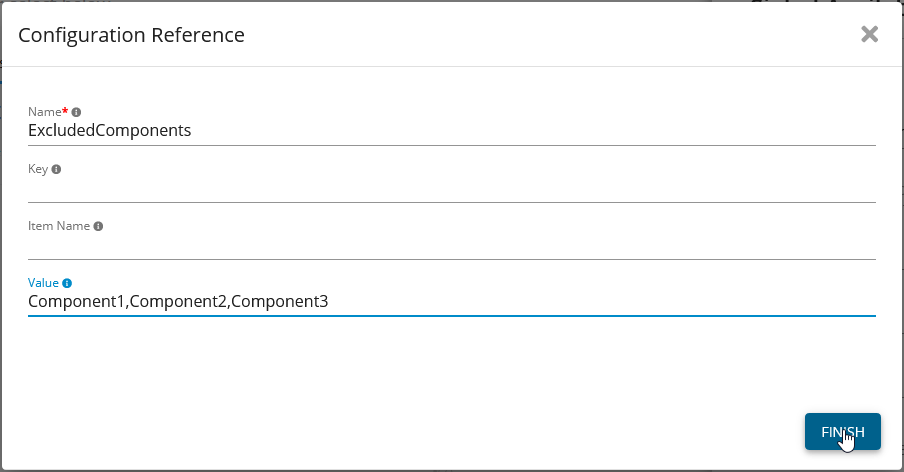
Include/Exclude Siebel Components
To exclude Siebel components from being monitored by Germain UX, we will need to create a reference called “ExcludedComponents” on the monitor. Follow the same logic to include one.
-
Go to you monitor and click the
to the right of “References”
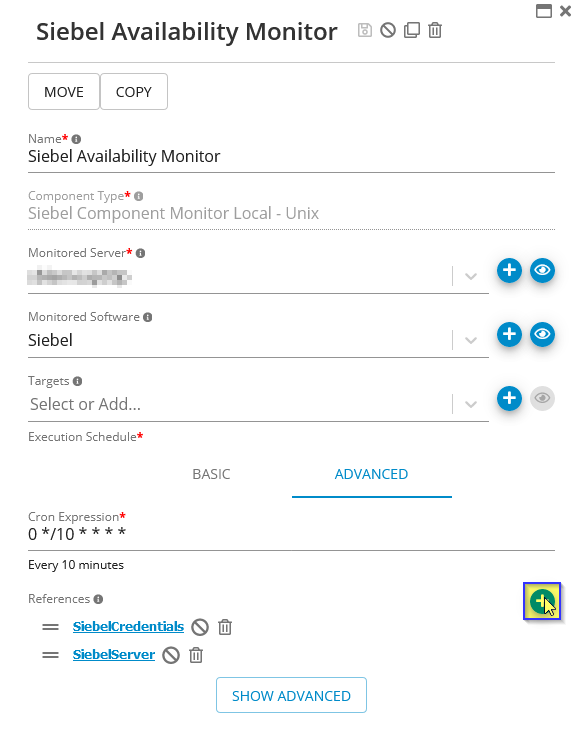
-
Enter the name as “ExcludedComponents” and enter the names of the components is a comma separated list as you see below.
KPIs
Please go here to see KPIs for Siebel Component/Object Manager.
Dashboards
A number of dashboards are preconfigured for Siebel CRM, here are just a few main ones, but there might be more.
-
Go to Germain Workspace > Left Menu > Dashboards > All
-
Search for any “Siebel…” dashboards, such as:
Siebel Performance
Siebel Availability
Component: Engine
Feature Availability: 2014.1 or later