
⚙️ Configure Salesforce Instance Status Monitoring
GermainUX monitors the status of the Salesforce instance used by your organization and can alert teams when Salesforce reports a service disruption or degradation.
🎯 Instance Status Monitoring helps teams:
-
Detect Salesforce service incidents
-
Identify affected Salesforce services
-
Track incident severity and duration
-
Distinguish platform-wide incidents from organization-specific problems
-
Correlate Salesforce service degradation with user errors or slow performance
-
Notify application and operations teams
-
Review the incident during root-cause analysis
The monitoring is performed by the GermainUX Engine and is enabled automatically through the Salesforce Application wizard.
📊 What Instance Status Monitoring Measures
GermainUX retrieves status information associated with the configured Salesforce instance.
Depending on the information published for that instance, GermainUX can identify:
-
Normal operation
-
Minor incidents
-
Major incidents
-
Service degradation
-
Service interruption
-
Affected Salesforce services
-
Incident start and recovery
-
Incident updates
Instance Status Monitoring reflects the status reported for the Salesforce instance. It does not, by itself, prove that every user can reach or use your Salesforce organization. Combine it with Real User Monitoring and synthetic monitoring for end-to-end availability from the user’s perspective.
📋 Prerequisites
Before configuring Instance Status Monitoring, confirm that:
-
A GermainUX Engine is deployed and running.
-
Salesforce monitoring has been deployed through the Salesforce Application wizard.
-
The correct Salesforce instance name is known.
-
The Engine can reach the Salesforce status source.
-
The monitor’s execution frequency is appropriate for the required detection speed.
For initial Salesforce deployment, see Deploy GermainUX for Salesforce.
🔎 Find the Salesforce Instance Name
The monitor requires the Salesforce instance name associated with your organization.
Examples of instance-name formats may include:
NA123
EU45
AP67
Do not enter:
-
Your My Domain name
-
The complete Salesforce URL
-
Your Salesforce organization ID
-
A sandbox name, unless it is the actual instance identifier required by the monitor
Use Salesforce’s organization and instance information to identify the current instance. See Salesforce’s guidance on finding your organization’s instance.
Salesforce can move an organization to another instance. Update the GermainUX configuration if the assigned instance changes.
🔁 Enable Instance Status Monitoring
Instance Status Monitoring is enabled automatically when Salesforce monitoring is deployed through the Salesforce Application wizard.
To configure it:
-
Open GermainUX Workspace.
-
Open the left navigation menu.
-
Select Wizards.
-
Select Salesforce Application.
-
Choose the GermainUX Engine that will run the monitor.
-
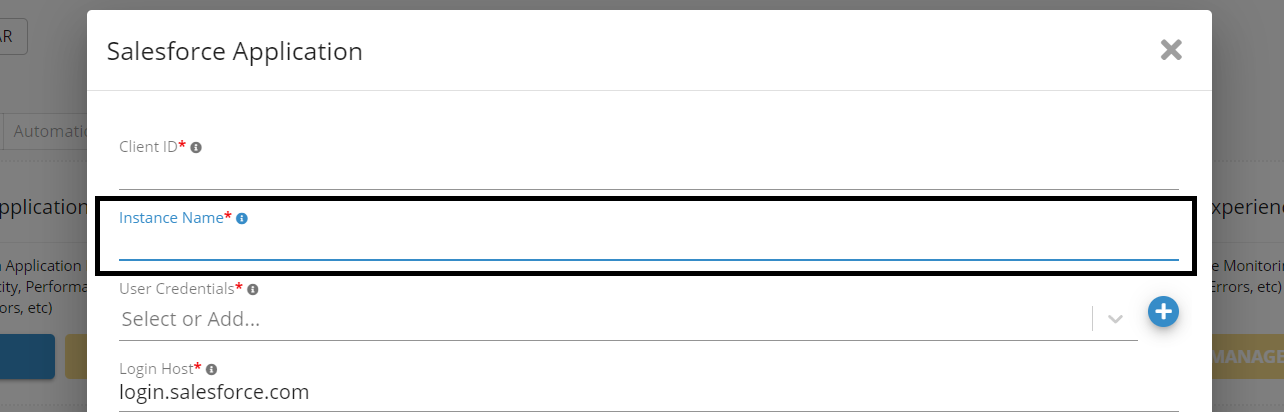
Enter the Salesforce connection information.
-
Enter the correct Salesforce Instance Name.
-
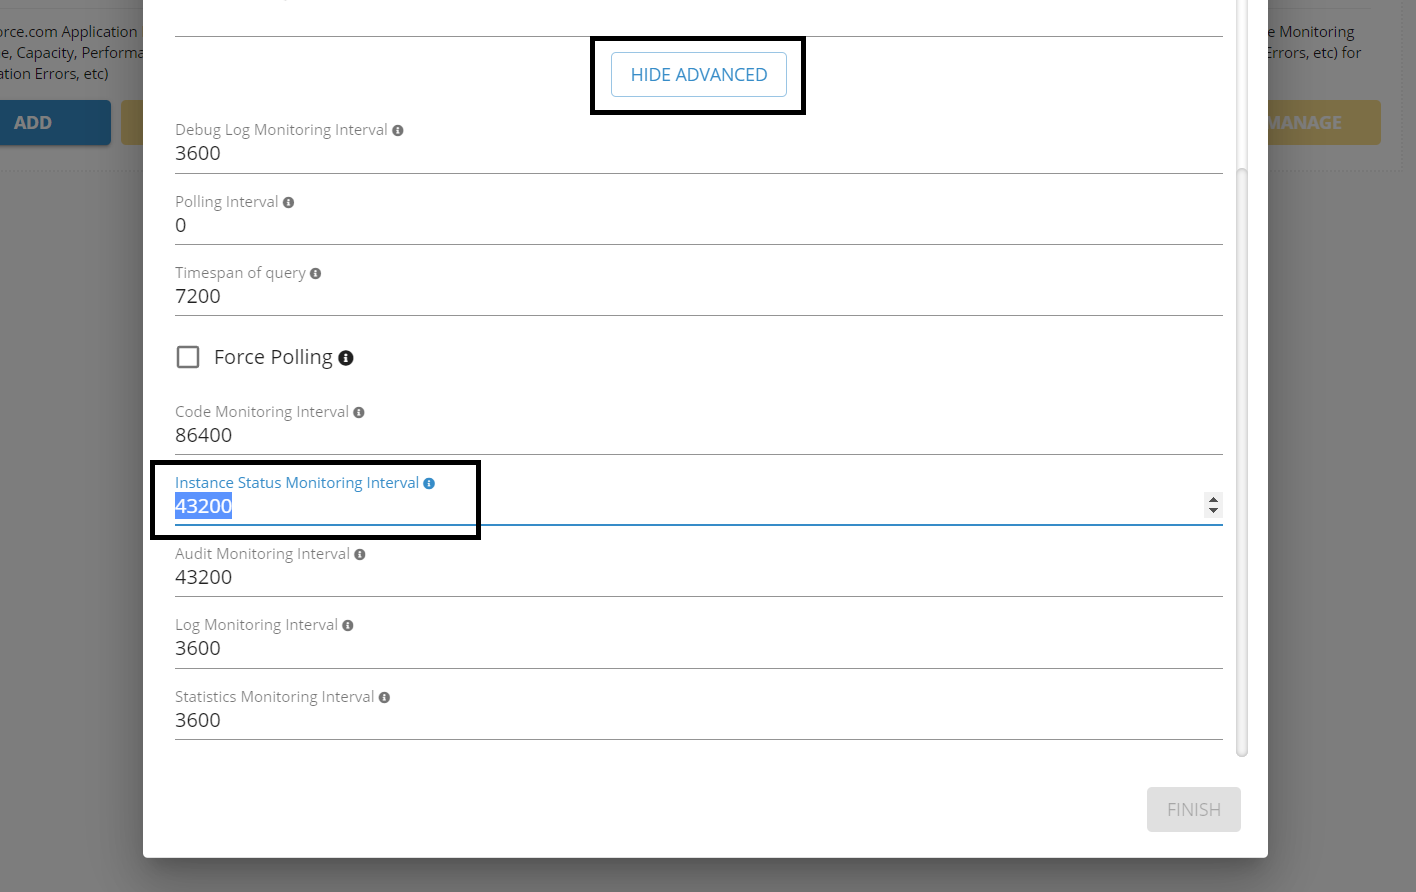
Expand Show Advanced if you want to change the collection interval.
-
Set Instance Status Monitoring Interval.
-
Complete the wizard.
The wizard creates a component with this type:
Salesforce Instance Status Monitor
⏰ Default Monitoring Frequency
By default, the monitor runs every 12 hours.
This interval may be sufficient for historical status collection, but it is generally too infrequent for rapid operational alerting. If your objective is to detect incidents promptly, configure a shorter interval that matches:
-
Required detection speed
-
Status-source update frequency
-
Network and processing overhead
-
Number of monitored Salesforce instances
-
Alerting expectations
The monitor can detect only the status available when it runs. For example, a 12-hour interval can delay notification by many hours.
🔧 Configure the Frequency During Deployment
During the Salesforce Application wizard:
-
Select Show Advanced.
-
Locate Instance Status Monitoring Interval.
-
Enter the required frequency.
-
Complete the wizard.
⚙️ Change the Frequency After Deployment
To update an existing monitor:
-
Open GermainUX Workspace.
-
Open the left navigation menu.
-
Select Germain.
-
Open the State tab.
-
Search for:
Type Name = Salesforce Instance Status Monitor -
Select the monitor associated with the intended Salesforce organization.
-
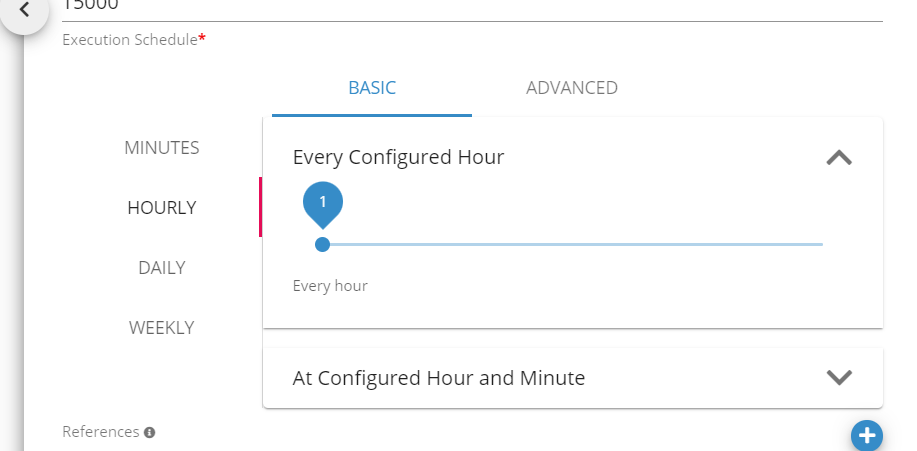
Update Execution Schedule.
-
Save the change.
The new schedule applies to subsequent executions.
✏️ Update the Salesforce Instance Name
Update the monitor if Salesforce moves the organization to another instance or if the initial instance name was incorrect.
-
Open GermainUX Workspace.
-
Open the left navigation menu.
-
Select Germain.
-
Open the State tab.
-
Search for:
Type Name = Salesforce Instance Status Monitor -
Select the applicable component.
-
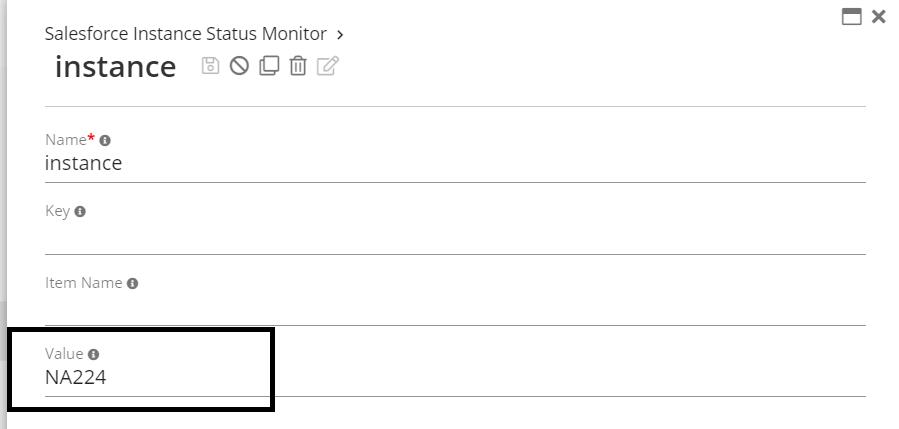
In References, select Instance.

-
Update the Value field with the new Salesforce instance name.
Instance Name Settings -
Save the change.
-
Allow the monitor to run again.
-
Verify that status data is associated with the correct instance.
⛔ Disable Instance Status Monitoring
To stop ongoing collection:
-
Open GermainUX Workspace.
-
Open the left navigation menu.
-
Select Germain.
-
Open the State tab.
-
Search for:
Type Name = Salesforce Instance Status Monitor -
Locate the applicable monitor.
-
Turn off the toggle in the Enabled column.
-
Save the change if prompted.

Disabling the component stops future status checks. Previously collected status events remain available according to the configured retention policy.
🔄 Re-enable Monitoring
To resume collection:
-
Return to Germain → State.
-
Search for
Salesforce Instance Status Monitor. -
Enable the applicable component.
-
Confirm the instance name.
-
Confirm the execution schedule.
-
Save the configuration.
-
Allow the next status check to run.
👁️ View Salesforce Instance Status
Open:
GermainUX Workspace → Dashboards → All → Salesforce
Review the portlets related to Salesforce instance status.
The dashboard can display:
-
Current instance status
-
Incident history
-
Incident severity
-
Affected services
-
Status changes over time
-
Incident duration
-
Related Salesforce UX and technical events
Select an event to open its details and related analysis.
📈 Salesforce Instance Status KPIs
See Salesforce Instance Status KPIs.
Use these KPIs to:
-
Measure service availability
-
Count incidents
-
Track minor and major events
-
Analyze incident duration
-
Compare Salesforce instances
-
Correlate platform incidents with affected users and workflows
🔔 Configure Alerts
Create alerts for the conditions requiring operational attention.
Useful alert conditions include:
-
Instance status changes from normal.
-
Salesforce reports a minor incident.
-
Salesforce reports a major incident.
-
A critical service becomes unavailable.
-
An incident remains active beyond a threshold.
-
Status data has not been collected within the expected period.
-
User errors or slow interactions increase during an instance incident.
Alerts can notify:
-
Salesforce administrators
-
Application owners
-
Operations teams
-
Service-desk teams
-
Business stakeholders
Configure recovery notification as well, so recipients know when the service returns to normal.
🔗 Correlate Status With User Impact
A Salesforce incident does not necessarily affect every organization, service, user, or workflow equally.
Correlate the instance-status event with:
-
Active Salesforce users
-
Slow page loads
-
Slow user interactions
-
Failed Aura or API requests
-
Salesforce errors
-
Apex exceptions
-
Login failures
-
Workflow drop-offs
-
Session Replay
-
Synthetic Salesforce scenarios
This allows teams to determine:
-
Whether users were actually affected
-
Which workflows failed
-
When impact began and ended
-
Whether the problem originated in Salesforce or elsewhere
A matching timestamp provides useful evidence but does not, by itself, prove that the Salesforce incident caused the observed issue.
✅ Validate Instance Status Monitoring
After deployment or a configuration change, verify that:
-
Salesforce Instance Status Monitoris enabled. -
The instance name is correct.
-
Its most recent execution completed successfully.
-
The next execution matches the intended schedule.
-
Status information appears in the Salesforce dashboard.
-
The status refers to the correct Salesforce instance.
-
Event timestamps and severity are populated.
-
Alerts are configured for the intended conditions.
-
Recovery events clear or close active alerts appropriately.
 No Instance Status Data Appears
If the monitor runs but no data appears:
-
Confirm that the GermainUX Engine is running.
-
Verify that
Salesforce Instance Status Monitoris enabled. -
Confirm the configured instance name.
-
Check the last execution and next scheduled execution.
-
Verify that the Engine can reach the Salesforce status source.
-
Review Engine logs for network, parsing, and service errors.
-
Confirm the selected dashboard time range.
-
Check organization, environment, and instance filters.
-
Run or wait for another scheduled collection after correcting the configuration.
❓ The Status Is for the Wrong Instance
If the dashboard displays status for another Salesforce instance:
-
Determine the current instance assigned to the Salesforce organization.
-
Open the monitor under Germain → State.
-
Select the Instance reference.
-
Replace its value.
-
Save the change.
-
Allow the monitor to run again.
-
Verify the new data.
Historical facts for the old instance remain available unless removed through the normal retention process.
🤔 Status Is Normal but Users Still Have Problems
A normal published instance status does not rule out:
-
Organization-specific configuration problems
-
Custom Apex failures
-
Integration outages
-
Network or proxy problems
-
Browser errors
-
User-permission issues
-
Regional connectivity problems
-
Problems not yet reflected in the Salesforce status source
Investigate:
-
Real User Monitoring
-
Session Replay
-
Salesforce Debug Logs
-
Apex exceptions
-
Outbound HTTP and API activity
-
Synthetic monitoring
-
Local network and browser telemetry
🛡️ Recommended End-to-End Availability Coverage
Use these monitoring layers together:
|
Layer |
What it confirms |
|---|---|
|
Instance Status Monitoring |
Salesforce-published condition of the assigned instance |
|
Synthetic Monitoring |
Whether a representative login and business workflow work from a test location |
|
Real User Monitoring |
Whether actual users can use Salesforce successfully |
|
Engine Monitoring |
Whether Salesforce APIs, logs, and integrations operate correctly |
|
Session Replay |
What affected users saw and did during an issue |
Together, these sources provide stronger evidence than instance status alone.
📚 Related Documentation
-
Other Analytics Features
-
Other Automation Features
ℹ️ Get Help
The Germain Team can help you set this up. Contact GermainUX Support.
Feature Availability: 2017.1 or later