Features
Germain provides network performance monitoring using two approaches:
HTTP Request on Server
The Germain Engine monitors the performance of network devices at the hardware level. It collects data on network device metrics such as latency, throughput, packet loss, and device health. By monitoring network devices, Germain can identify any performance issues or anomalies within the network infrastructure.
HTTP Request on Browser
Germain RUM is an extension or JavaScript code that monitors the performance of network interfaces from a user's browser. It captures metrics related to network performance, such as page load times, resource loading times, DNS lookup times, and connection speeds. This approach provides insights into the actual user experience and helps identify potential bottlenecks or latency issues.
By combining the data collected from both approaches, Germain offers comprehensive network performance monitoring. It allows you to analyze the performance of your network devices and identify any network-related issues affecting user experience. With Germain, you can proactively detect and address network performance problems, ensuring optimal network performance and user satisfaction.
Configuration
Via Germain Engine
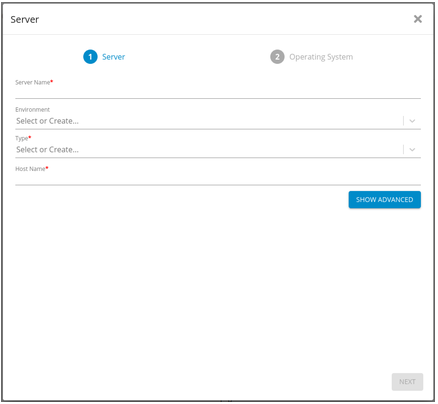
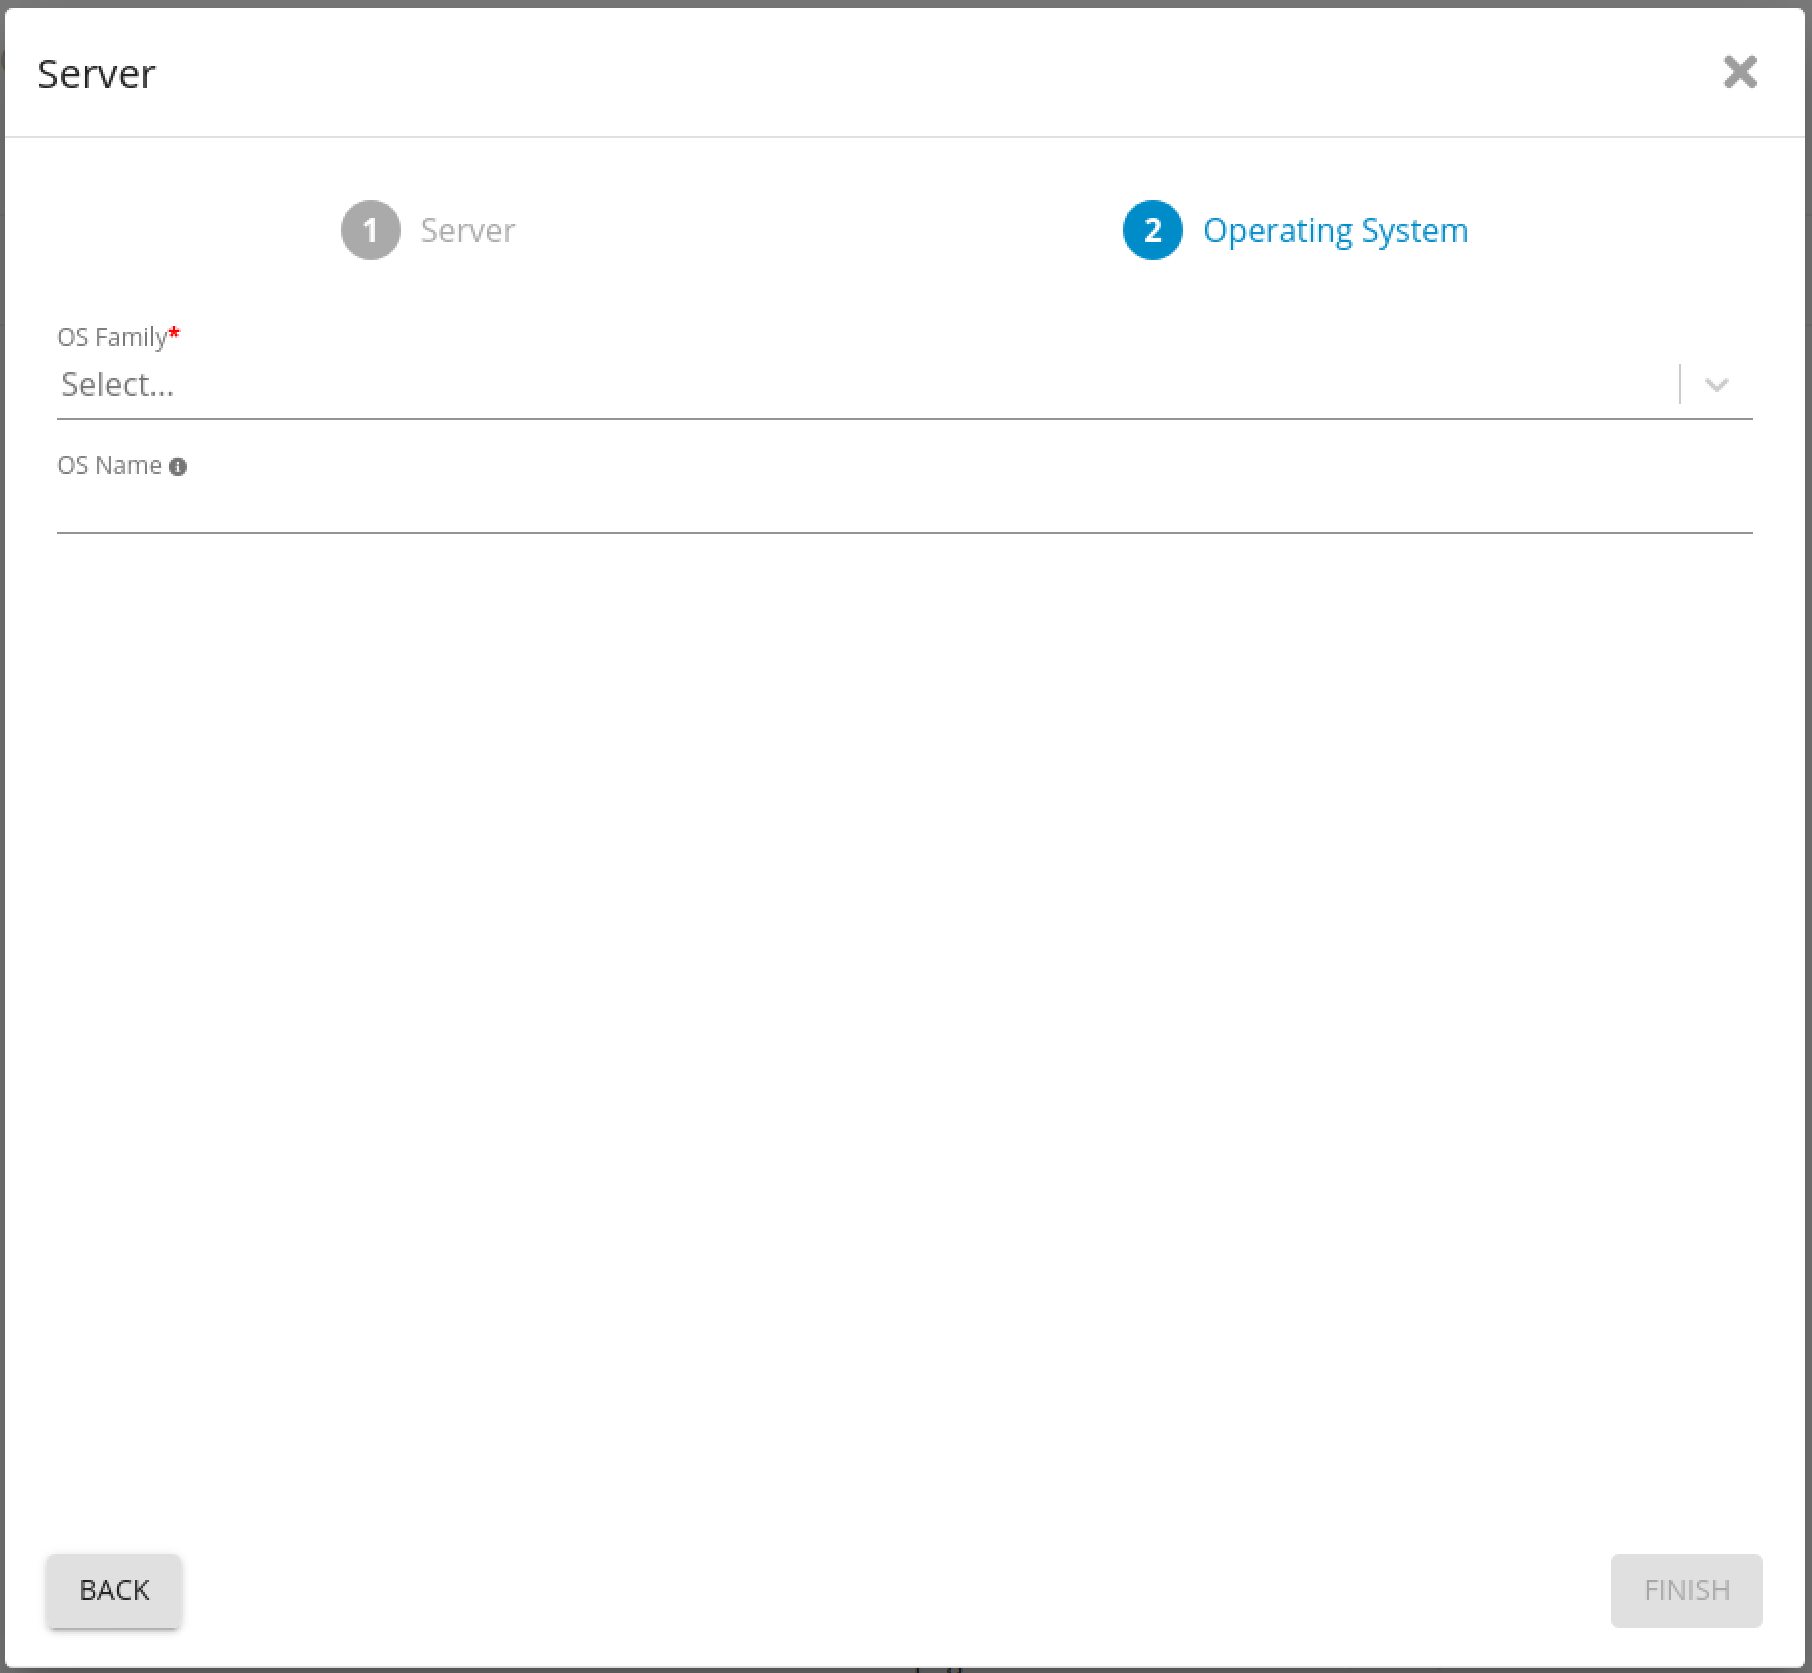
Create target server
1. Germain Workspace > Left Menu > Data Source > Add server (...)
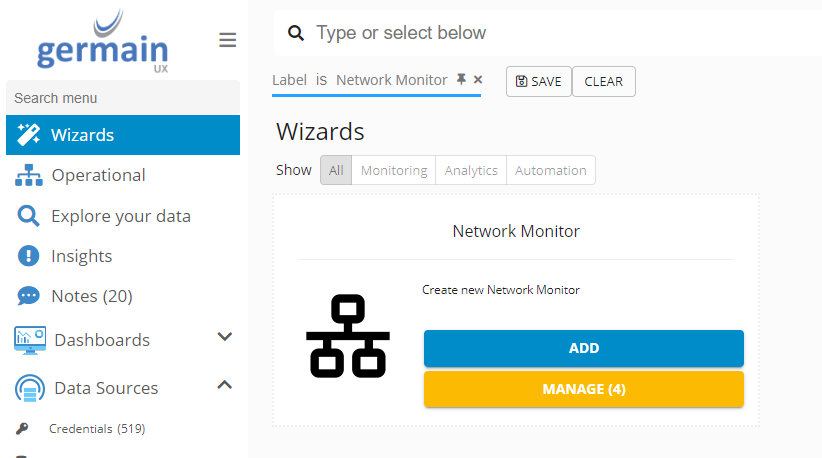
Create Network Monitor Instance
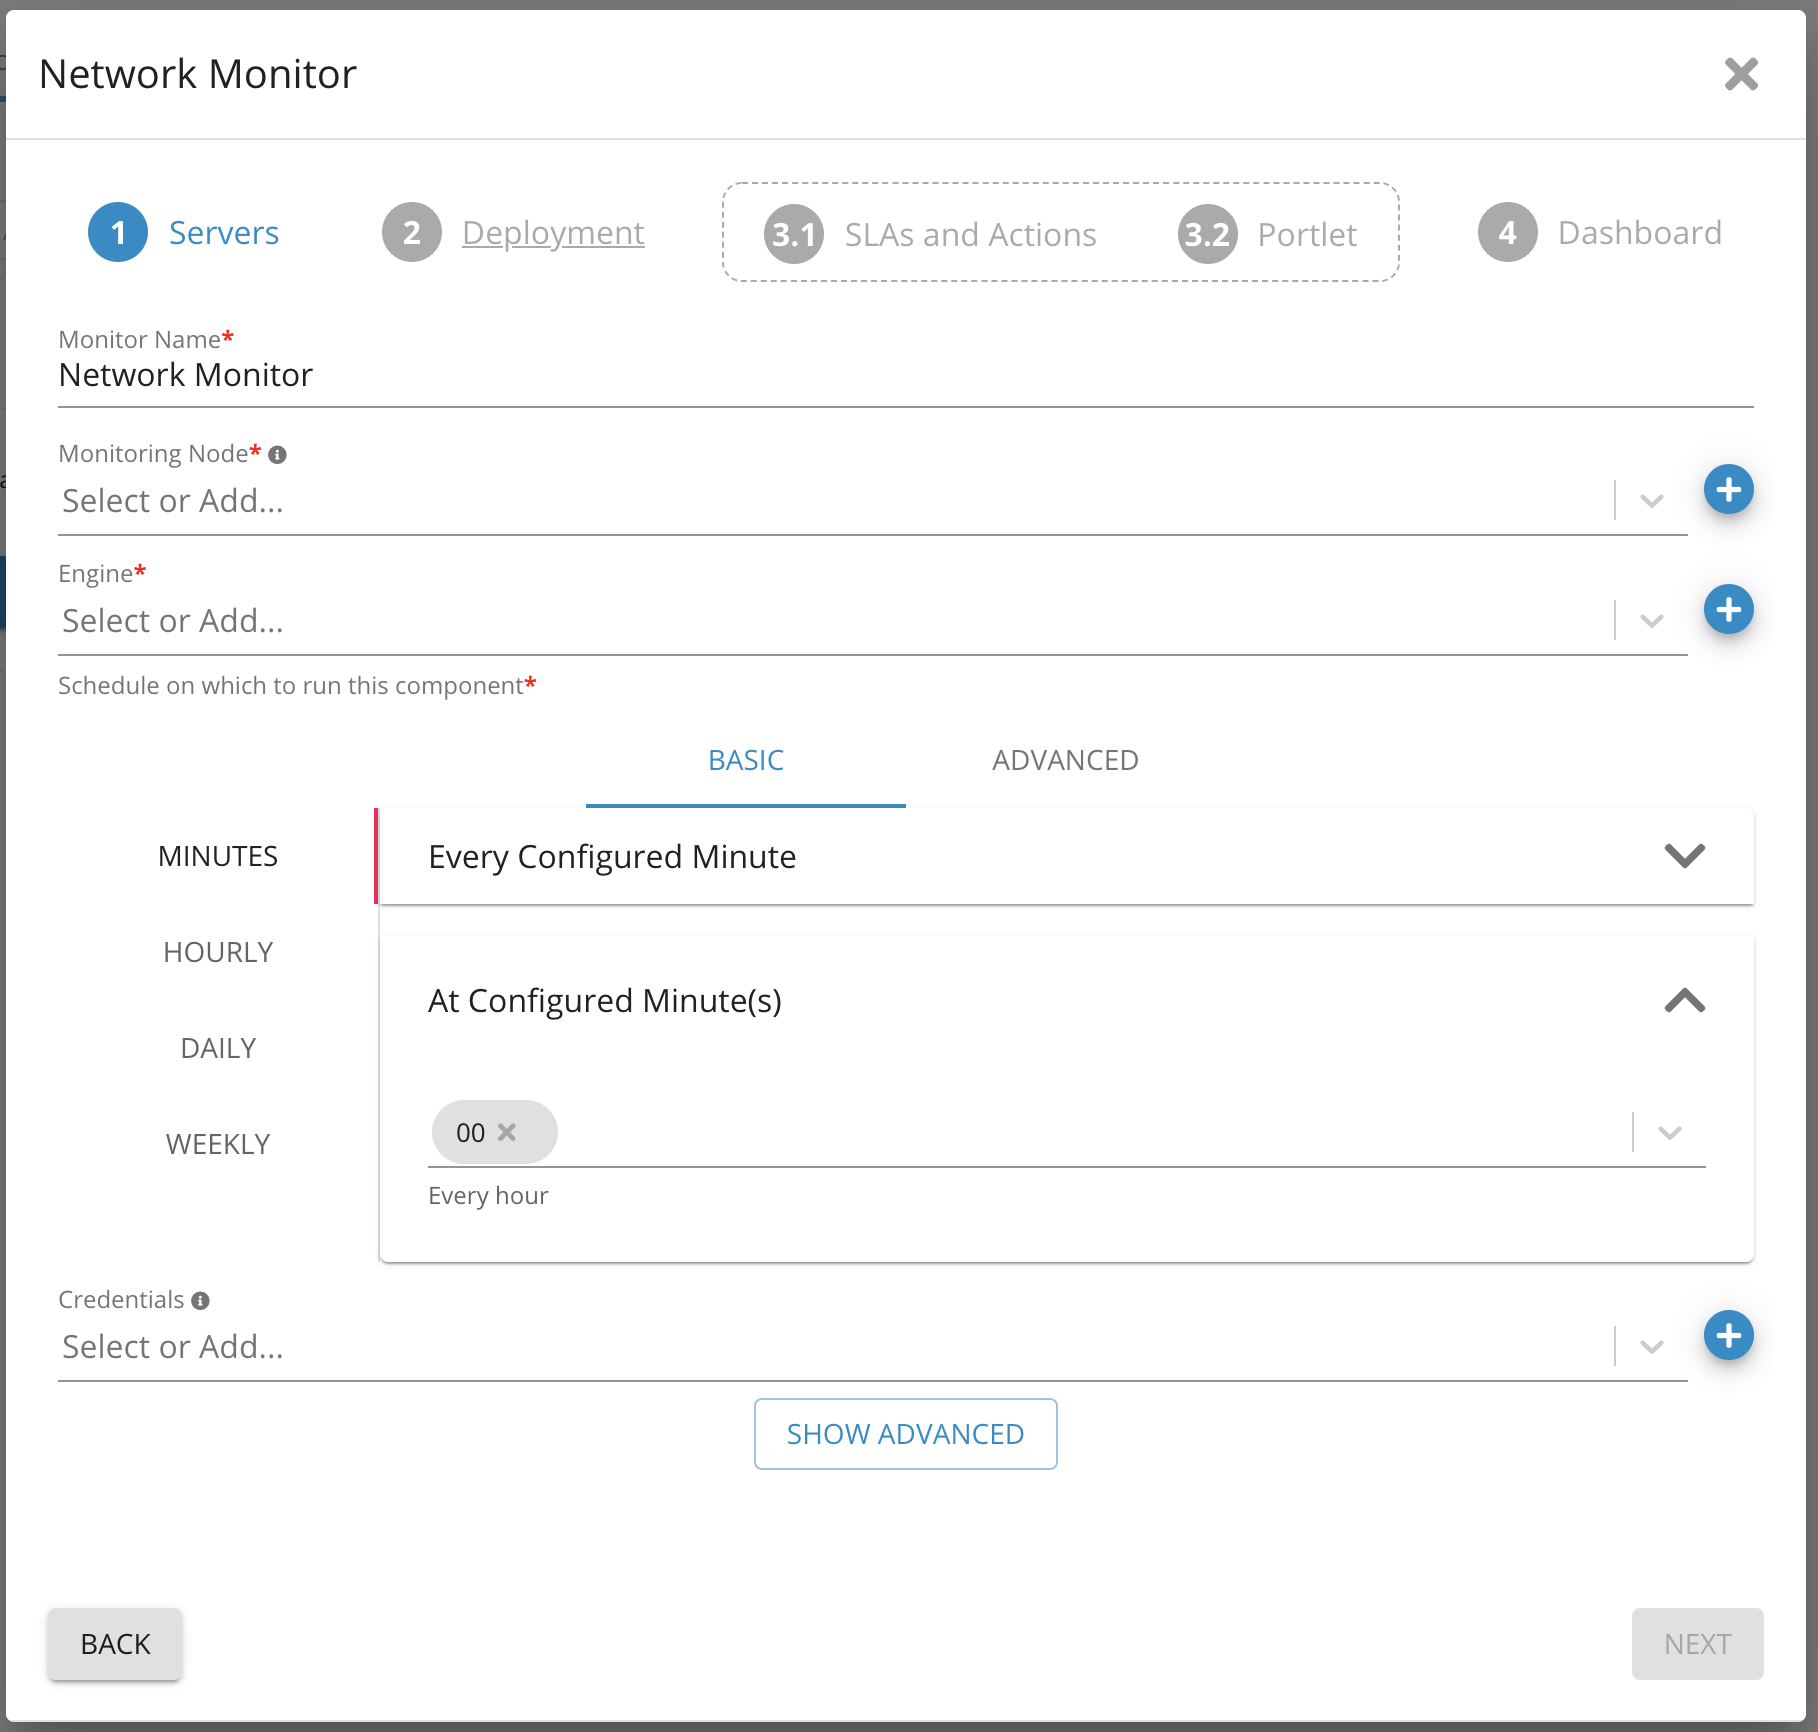
1. Germain Workspace > Left Menu > Wizards > Network Monitor
2. Select Source Server from the drop-down list (This is the server the component will run)
3. Select the target server that we created in previous steps
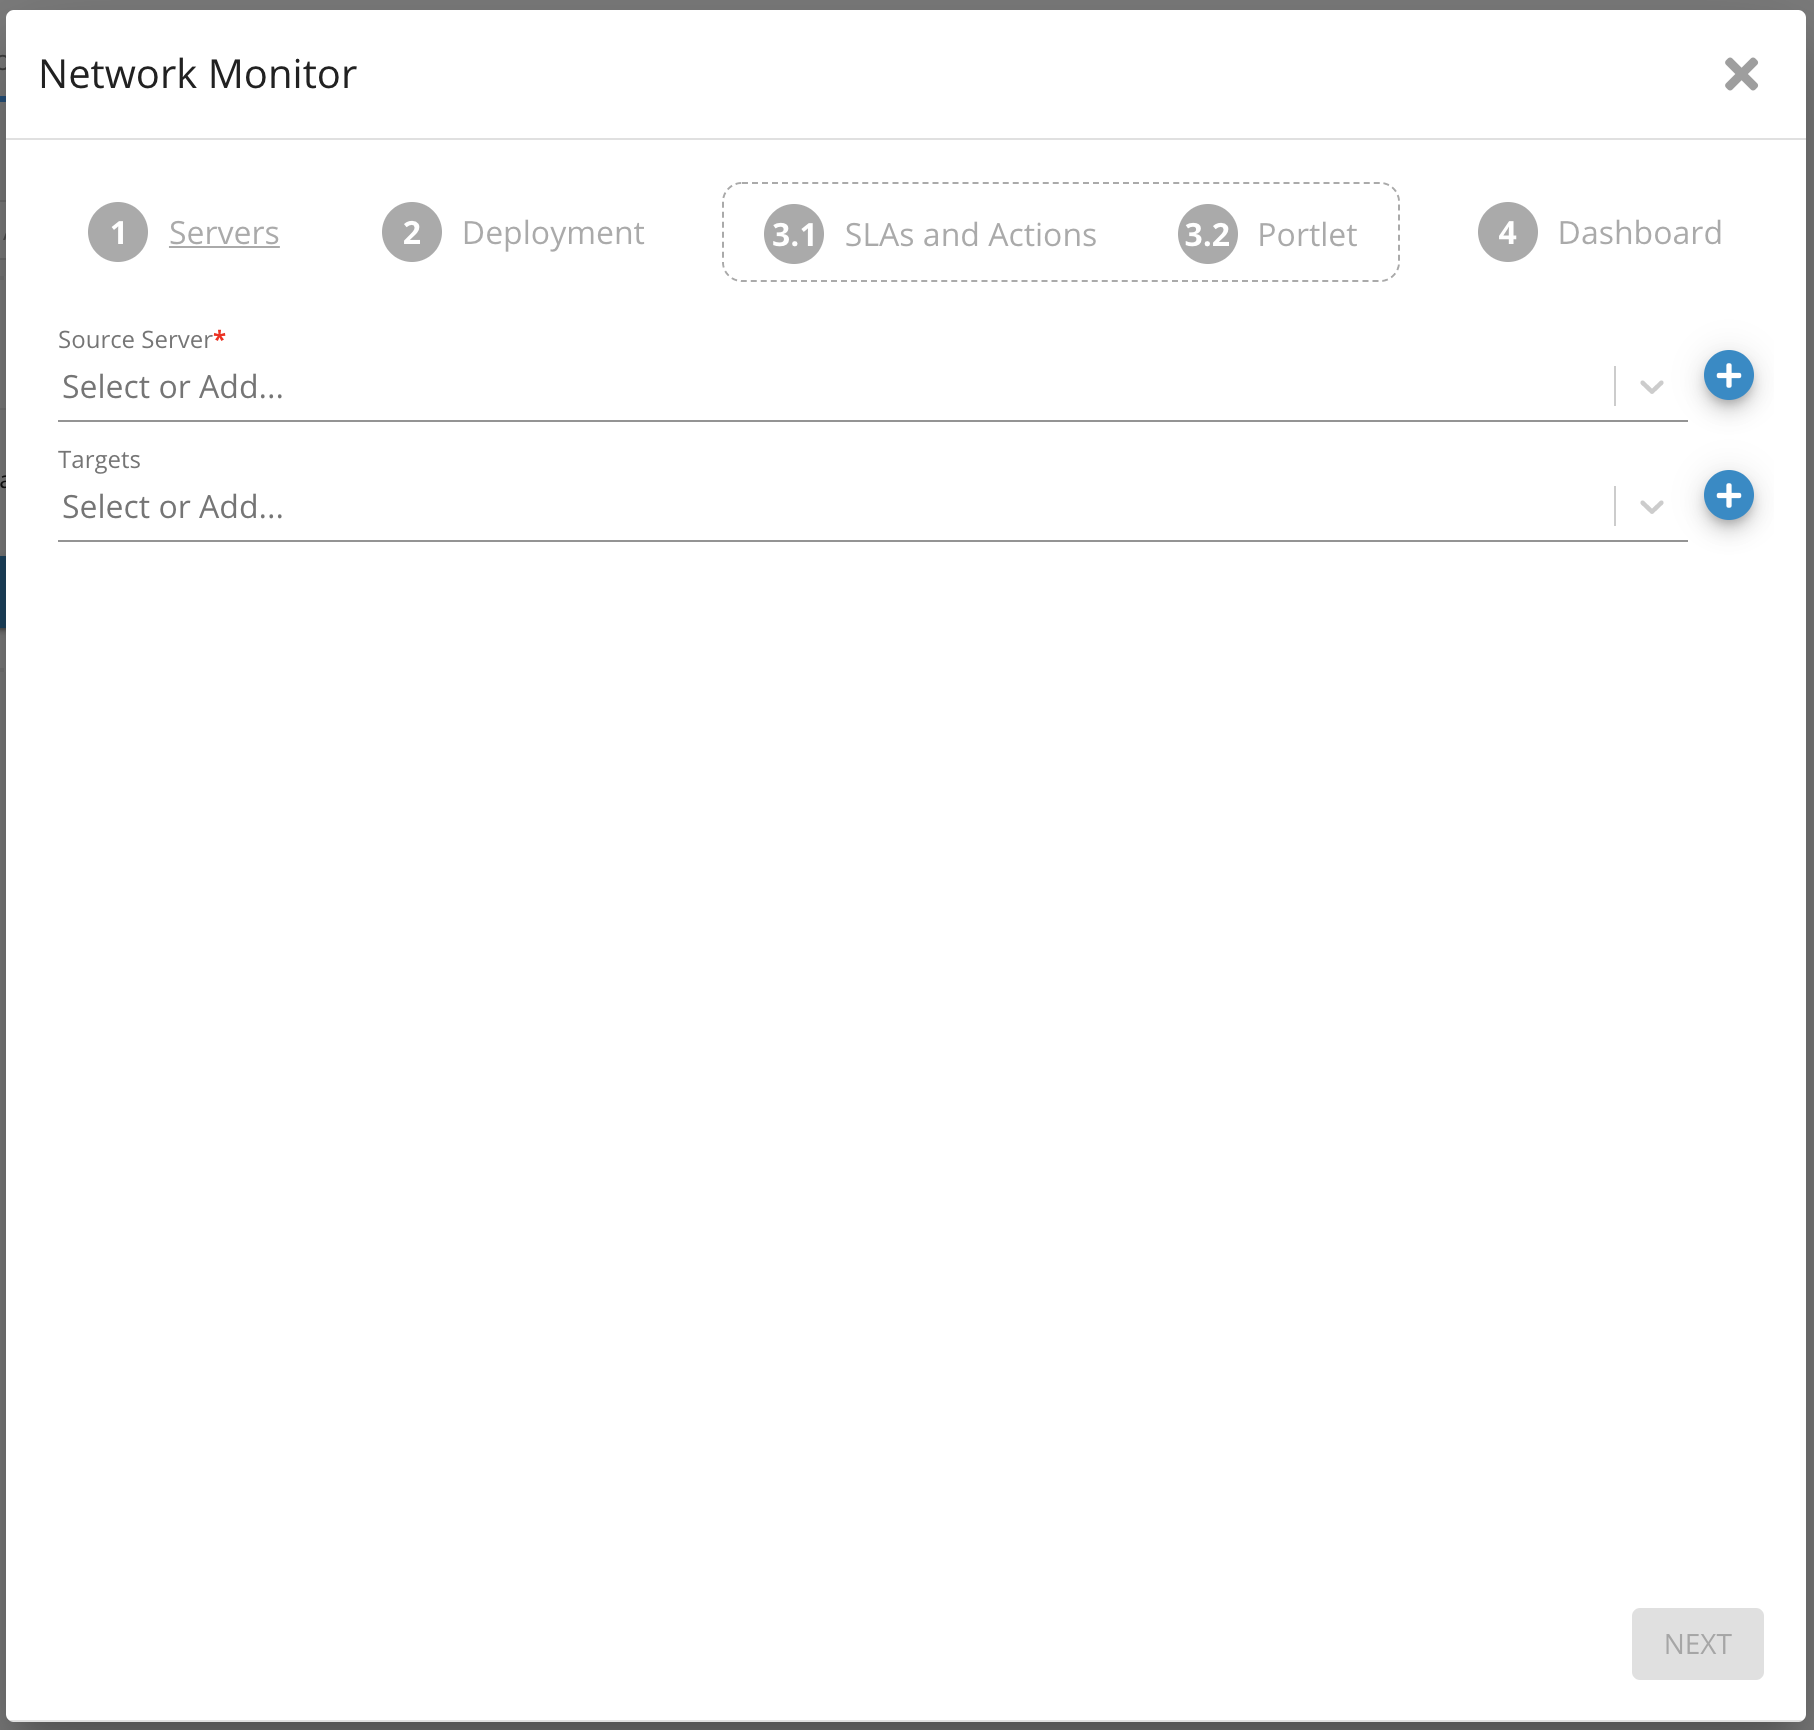
4. Provide the Monitor Name or use the default name
5. Select Monitoring node and Engine from the drop-down list
6. Set a schedule for how often this component should run
7. If this component will run through SSH, provide credentials for SSH connection
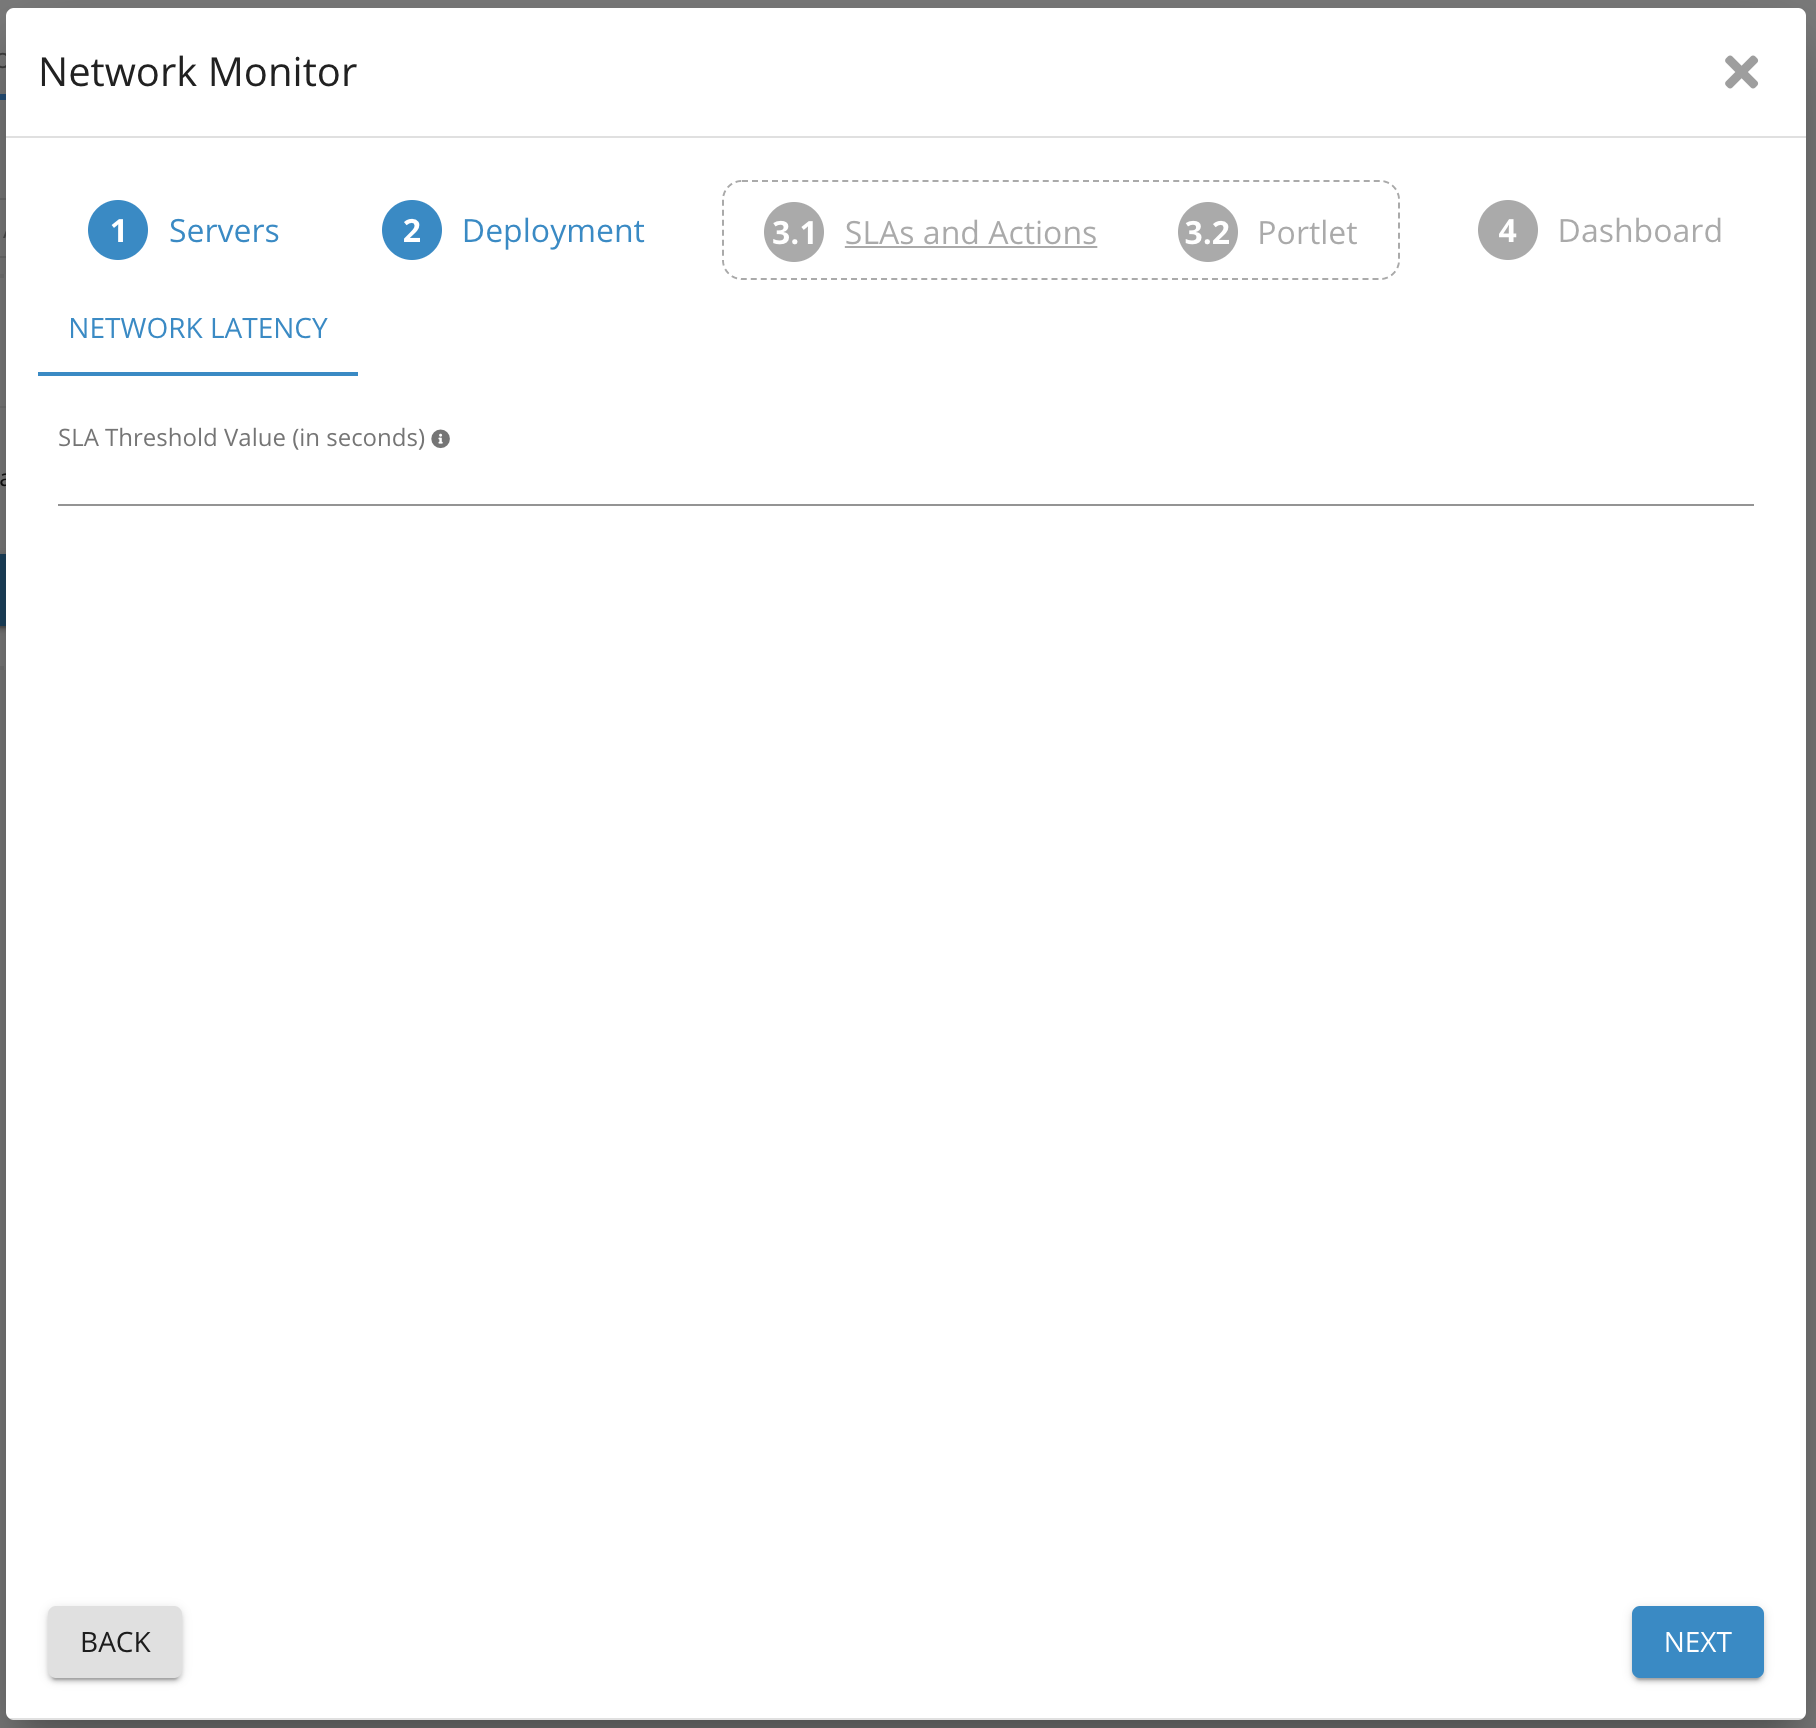
8. Click Next
9. Provide value for threshold (e.g. If 10s is provided, any result that has a response time of greater than 10s will trigger this SLA)
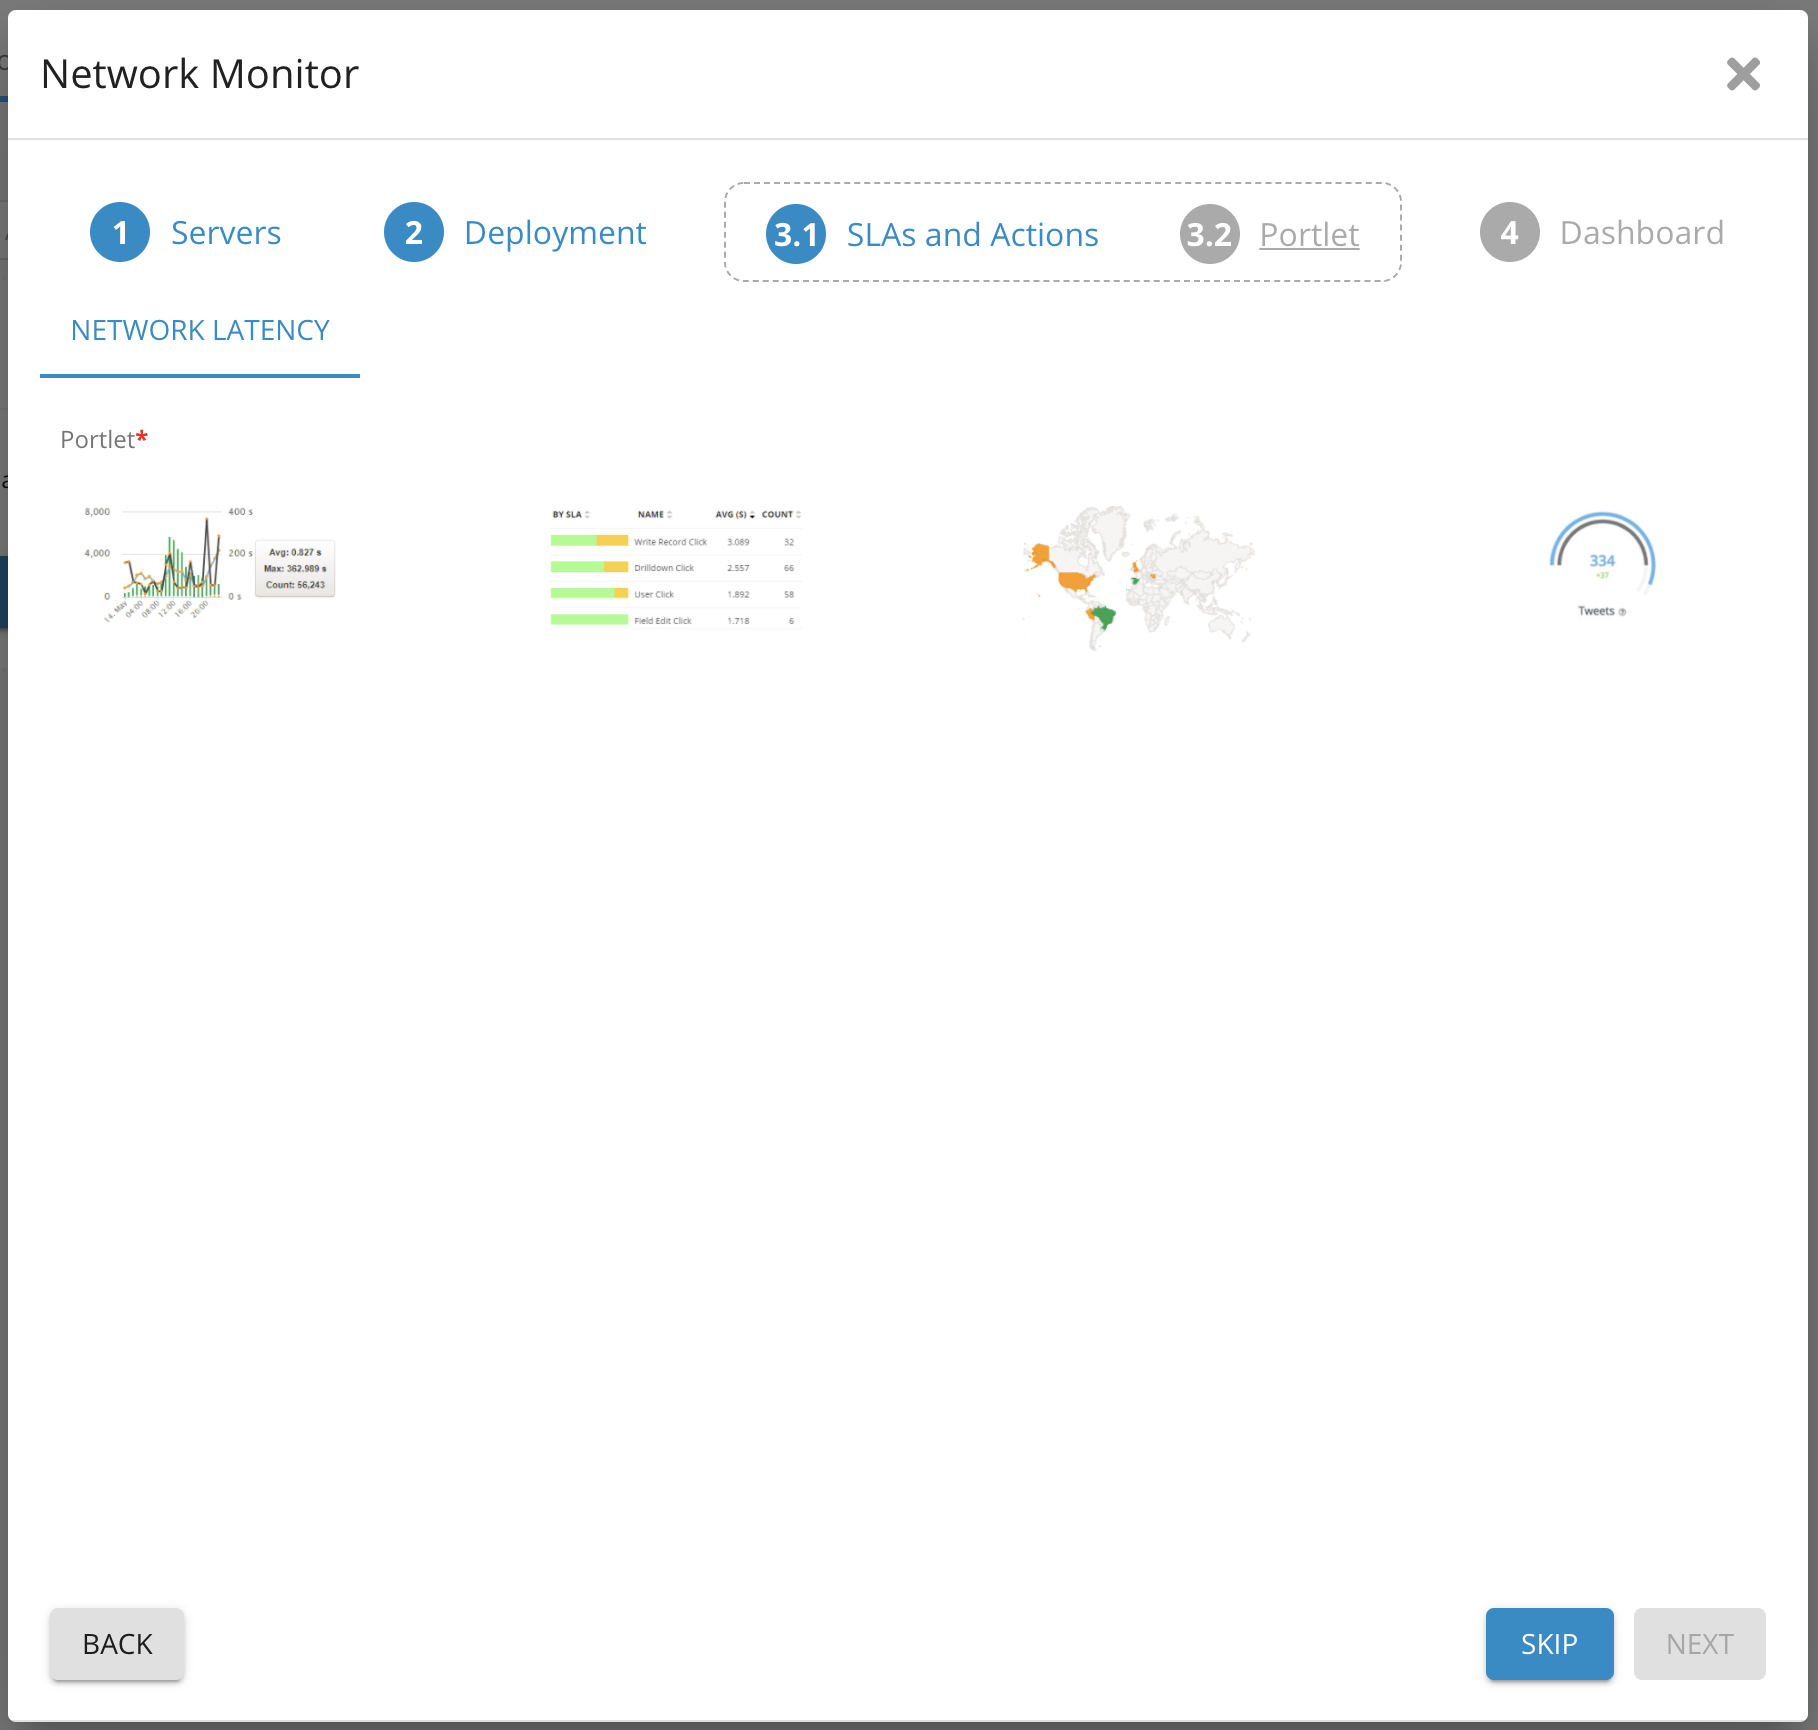
10. Choose or skip Portlet style
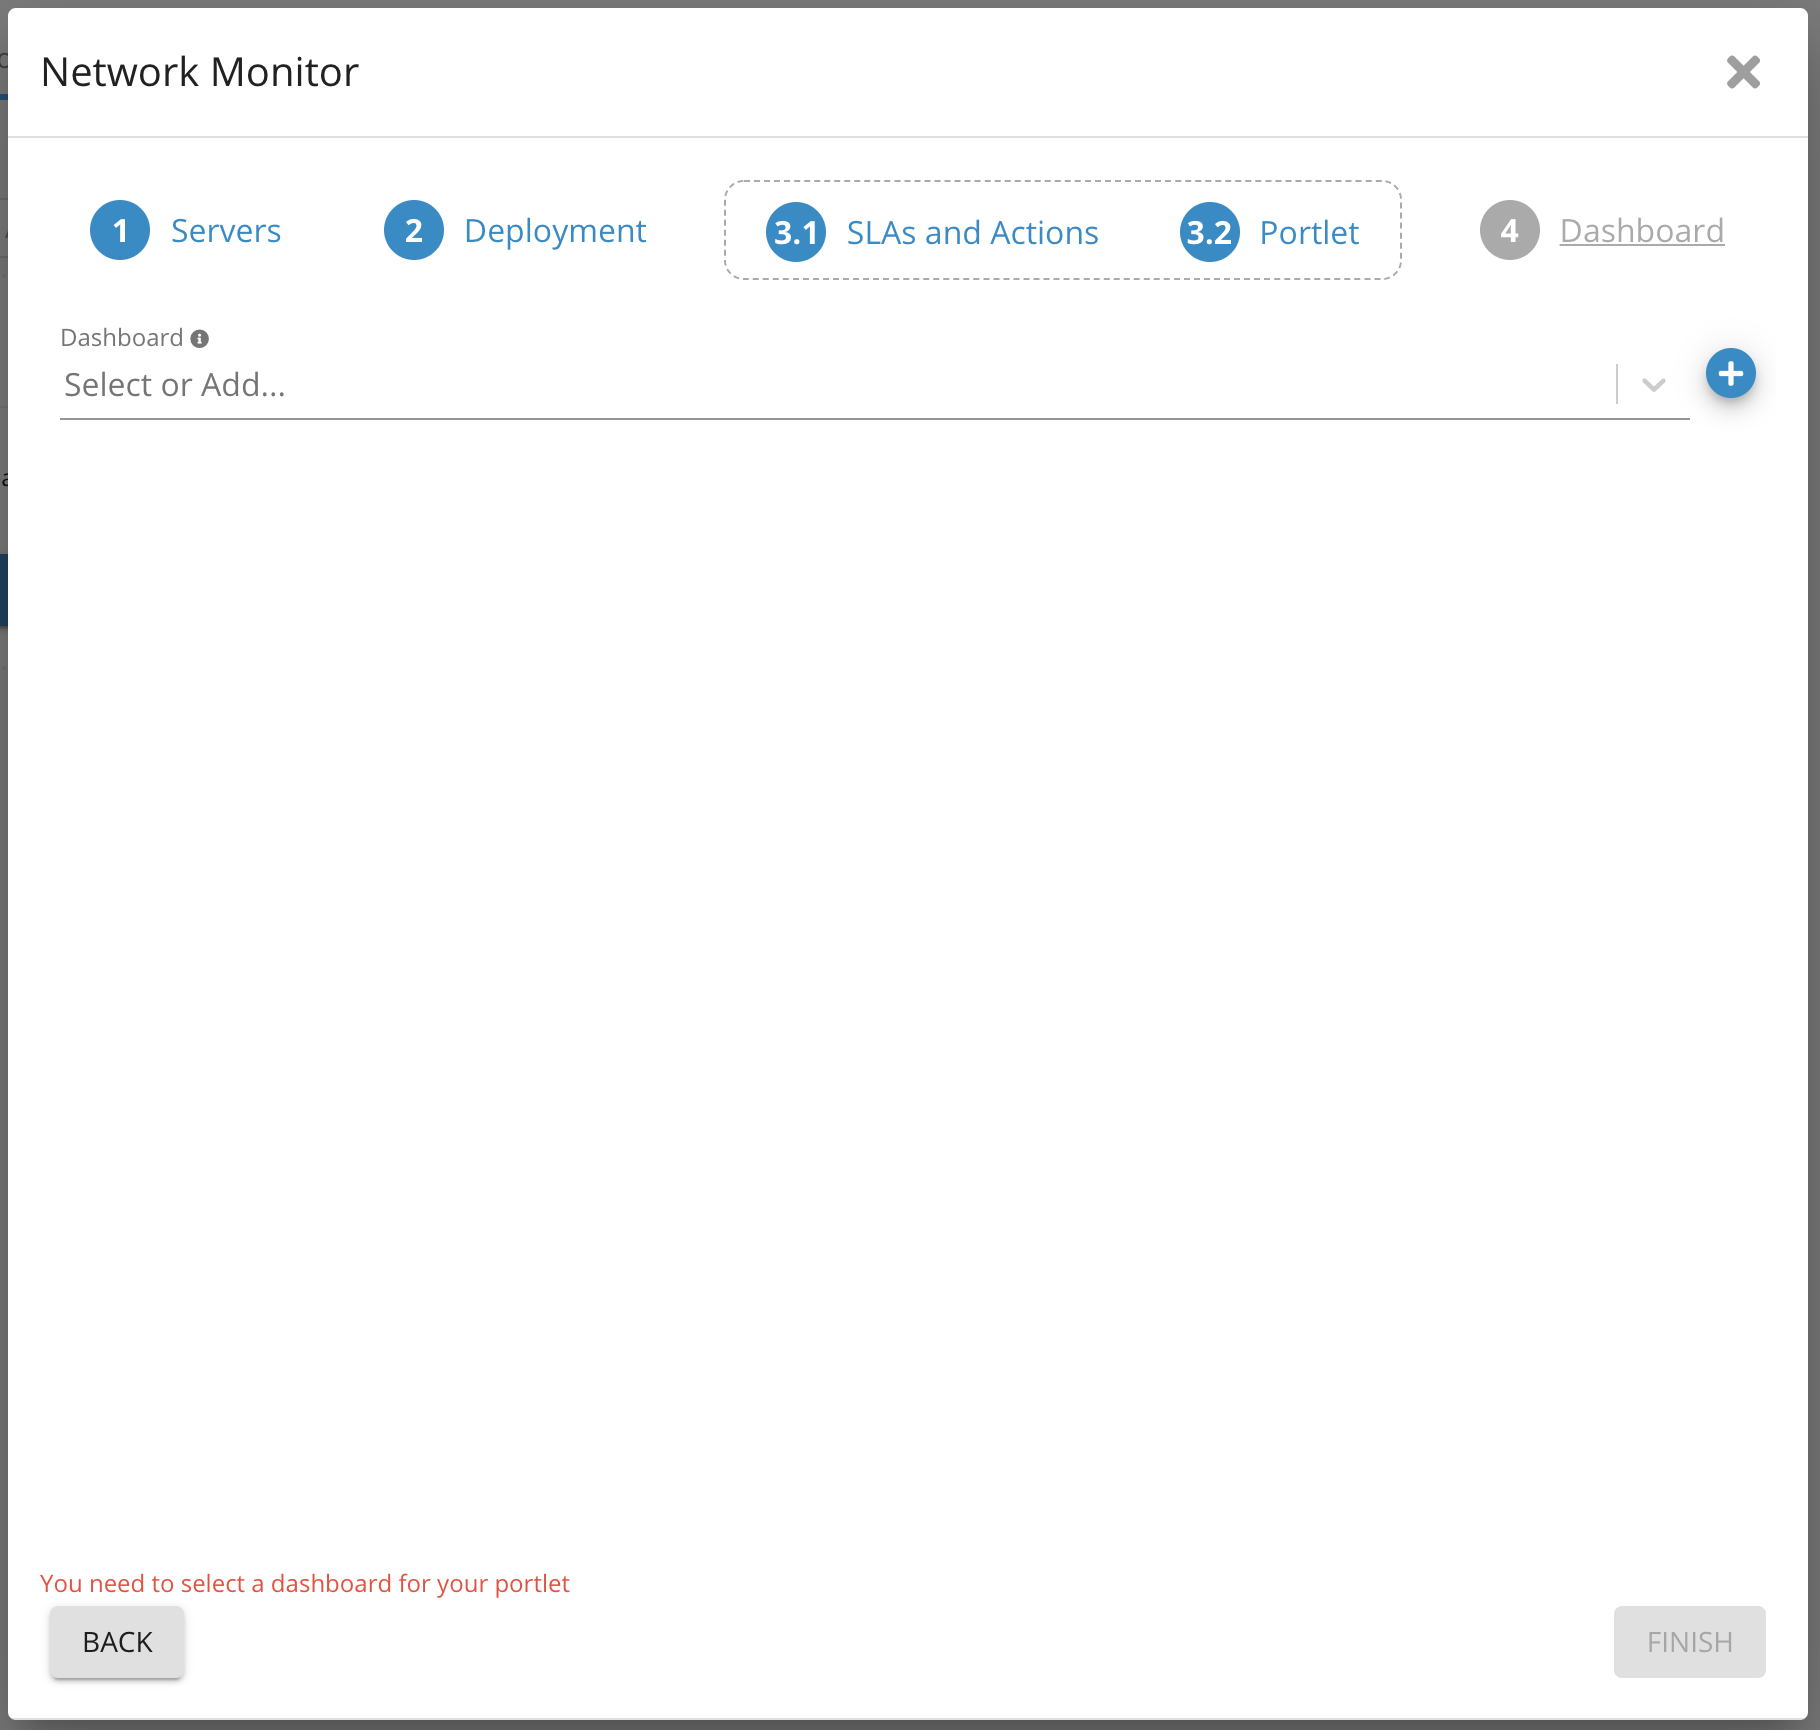
11. Choose the dashboard where the Portlet will be added.
12. Click Finish
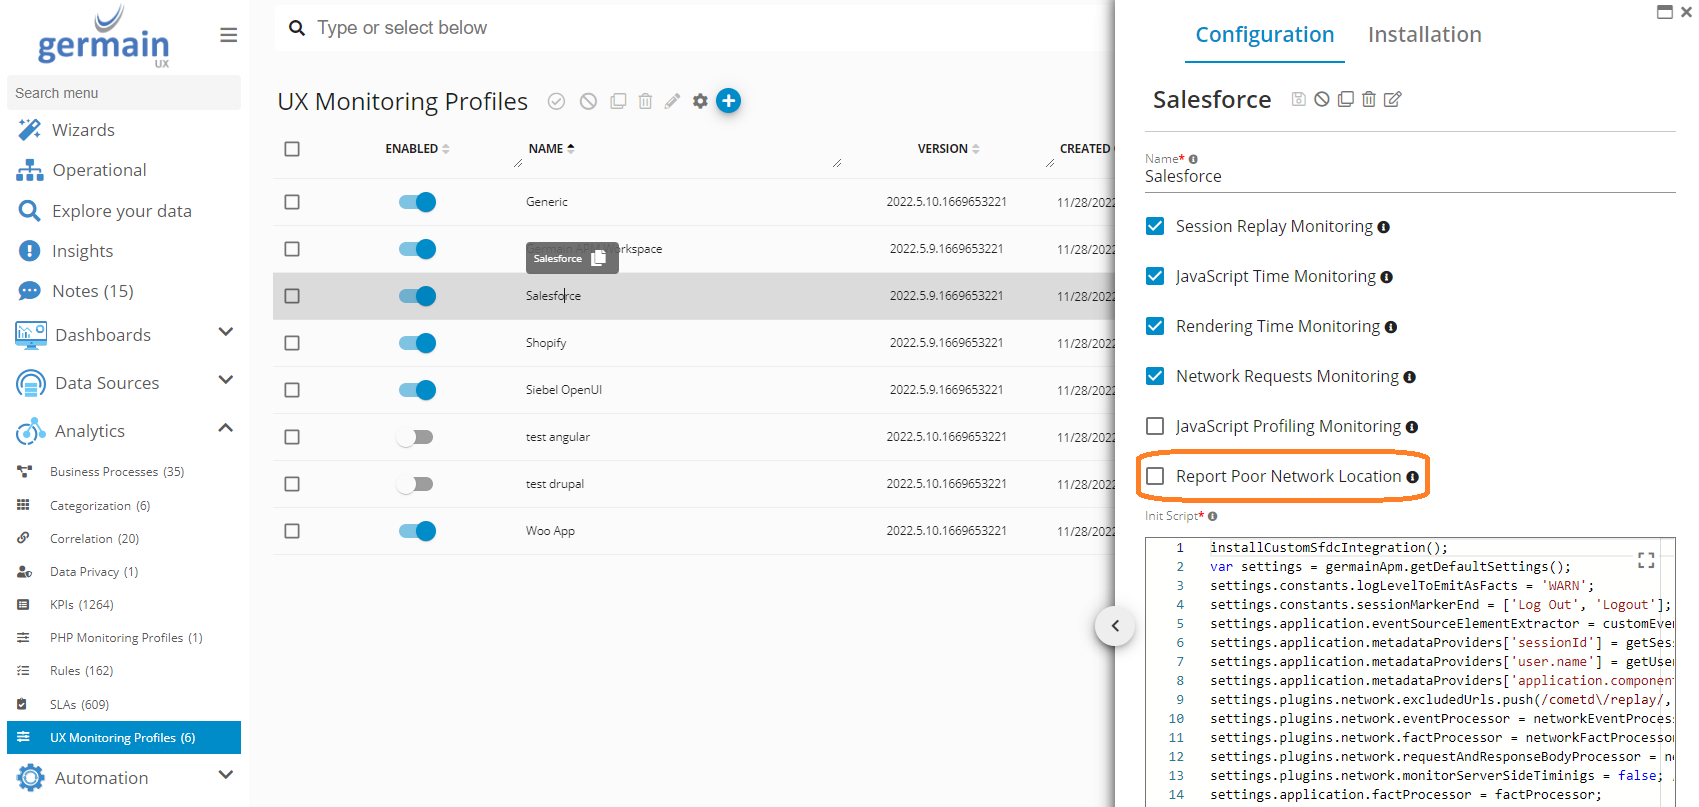
Via Germain RUM
This applies to both Germain RUM Browser Extension or Javascript.
Enable "Report Poor Network Location"
-
Log on to Germain UX
-
left menu > Analytics > UX Monitoring Profiles
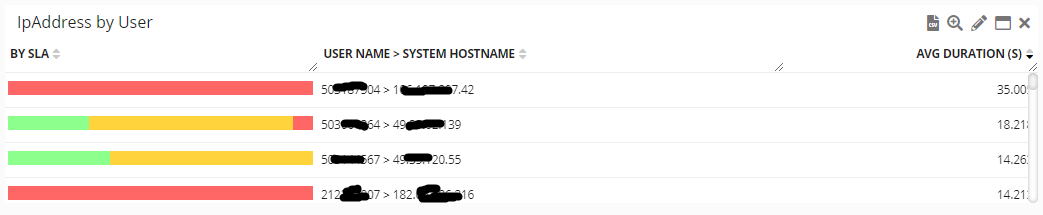
SLA
The following line can be added to the Germain RUM’s initScript to modify the list of poor grades (i.e. what is considered "poor network"):
settings.plugins.poorNetworkLocation.poorGrades = ['slow-2g', '2g', '3g'];
e.g. '3g' can be removed so only 2g and below are considered poor.
|
ECT |
Minimum RTT |
Maximum downlink |
Explanation |
|---|---|---|---|
|
|
2000ms |
50 Kbps |
The network is suited for small transfers only such as text-only pages. |
|
|
1400ms |
70 Kbps |
The network is suited for transfers of small images. |
|
|
270ms |
700 Kbps |
The network is suited for transfers of large assets such as high resolution images, audio, and SD video. |
|
|
0ms |
∞ |
The network is suited for HD video, real-time video, etc. |
Source: https://developer.mozilla.org/en-US/docs/Glossary/Effective_connection_type
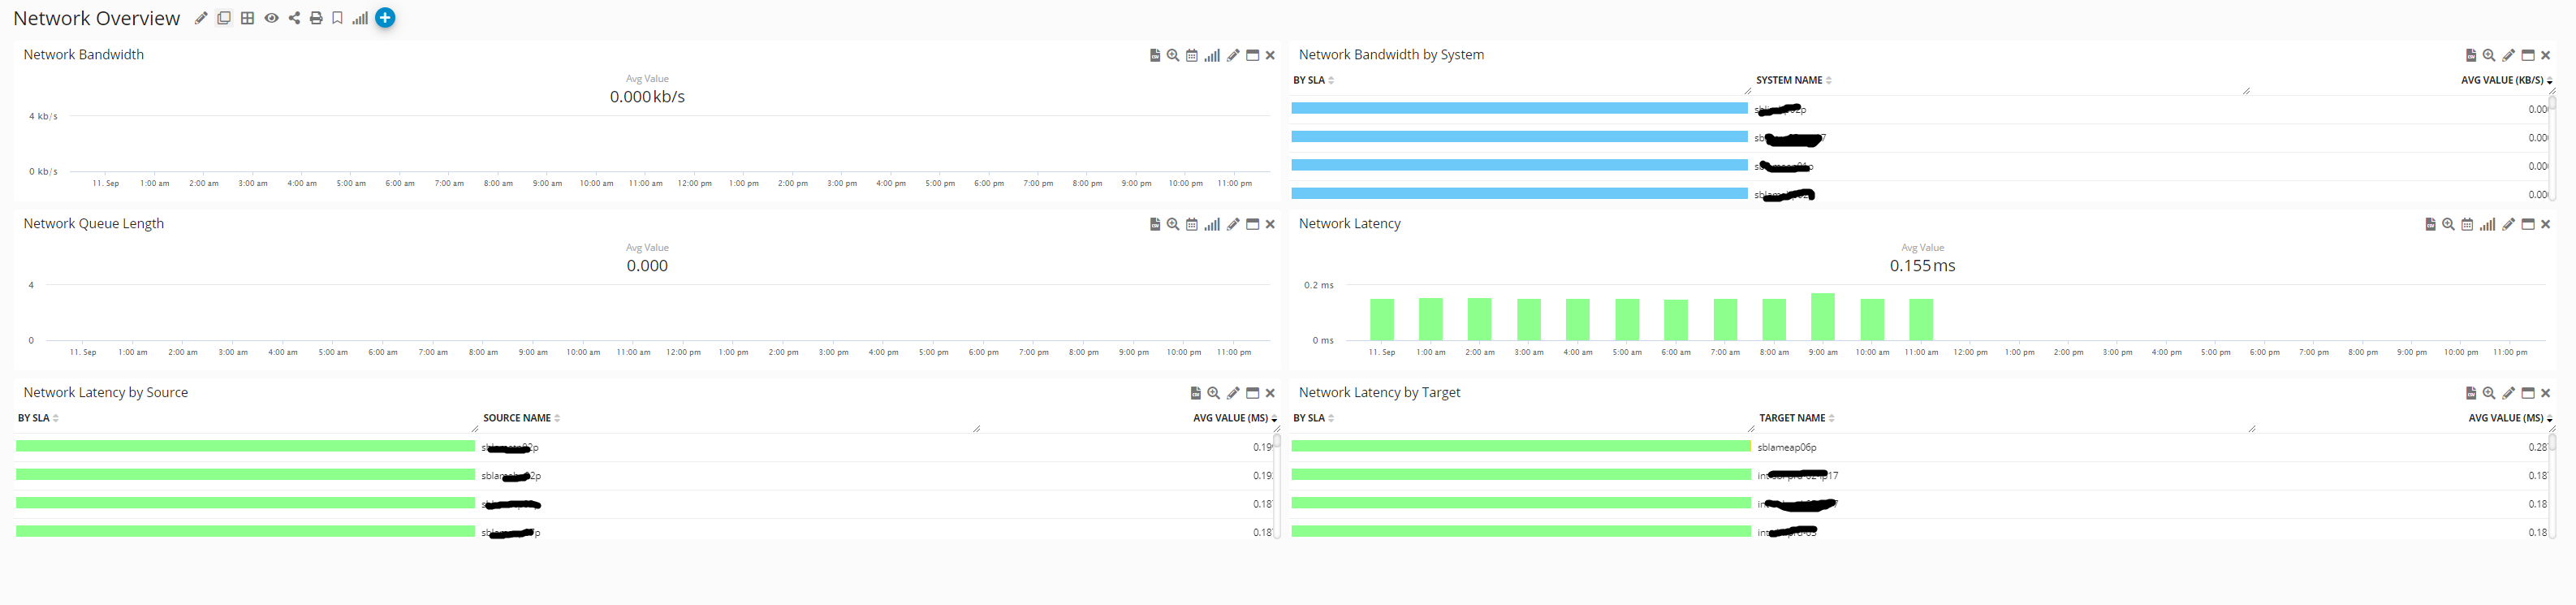
Data Model
KPI: UxMetric
-
Type: [Browser:Poor Network]
-
Value: [DownlinkMbps] - The values of 'slow-2g', '2g', '3g', and '4g' are determined using observed round-trip times and downlink values.
-
Name: [NetworkGrade]
-
Location: [LocationDimension]
Example
Component: Engine
Fea