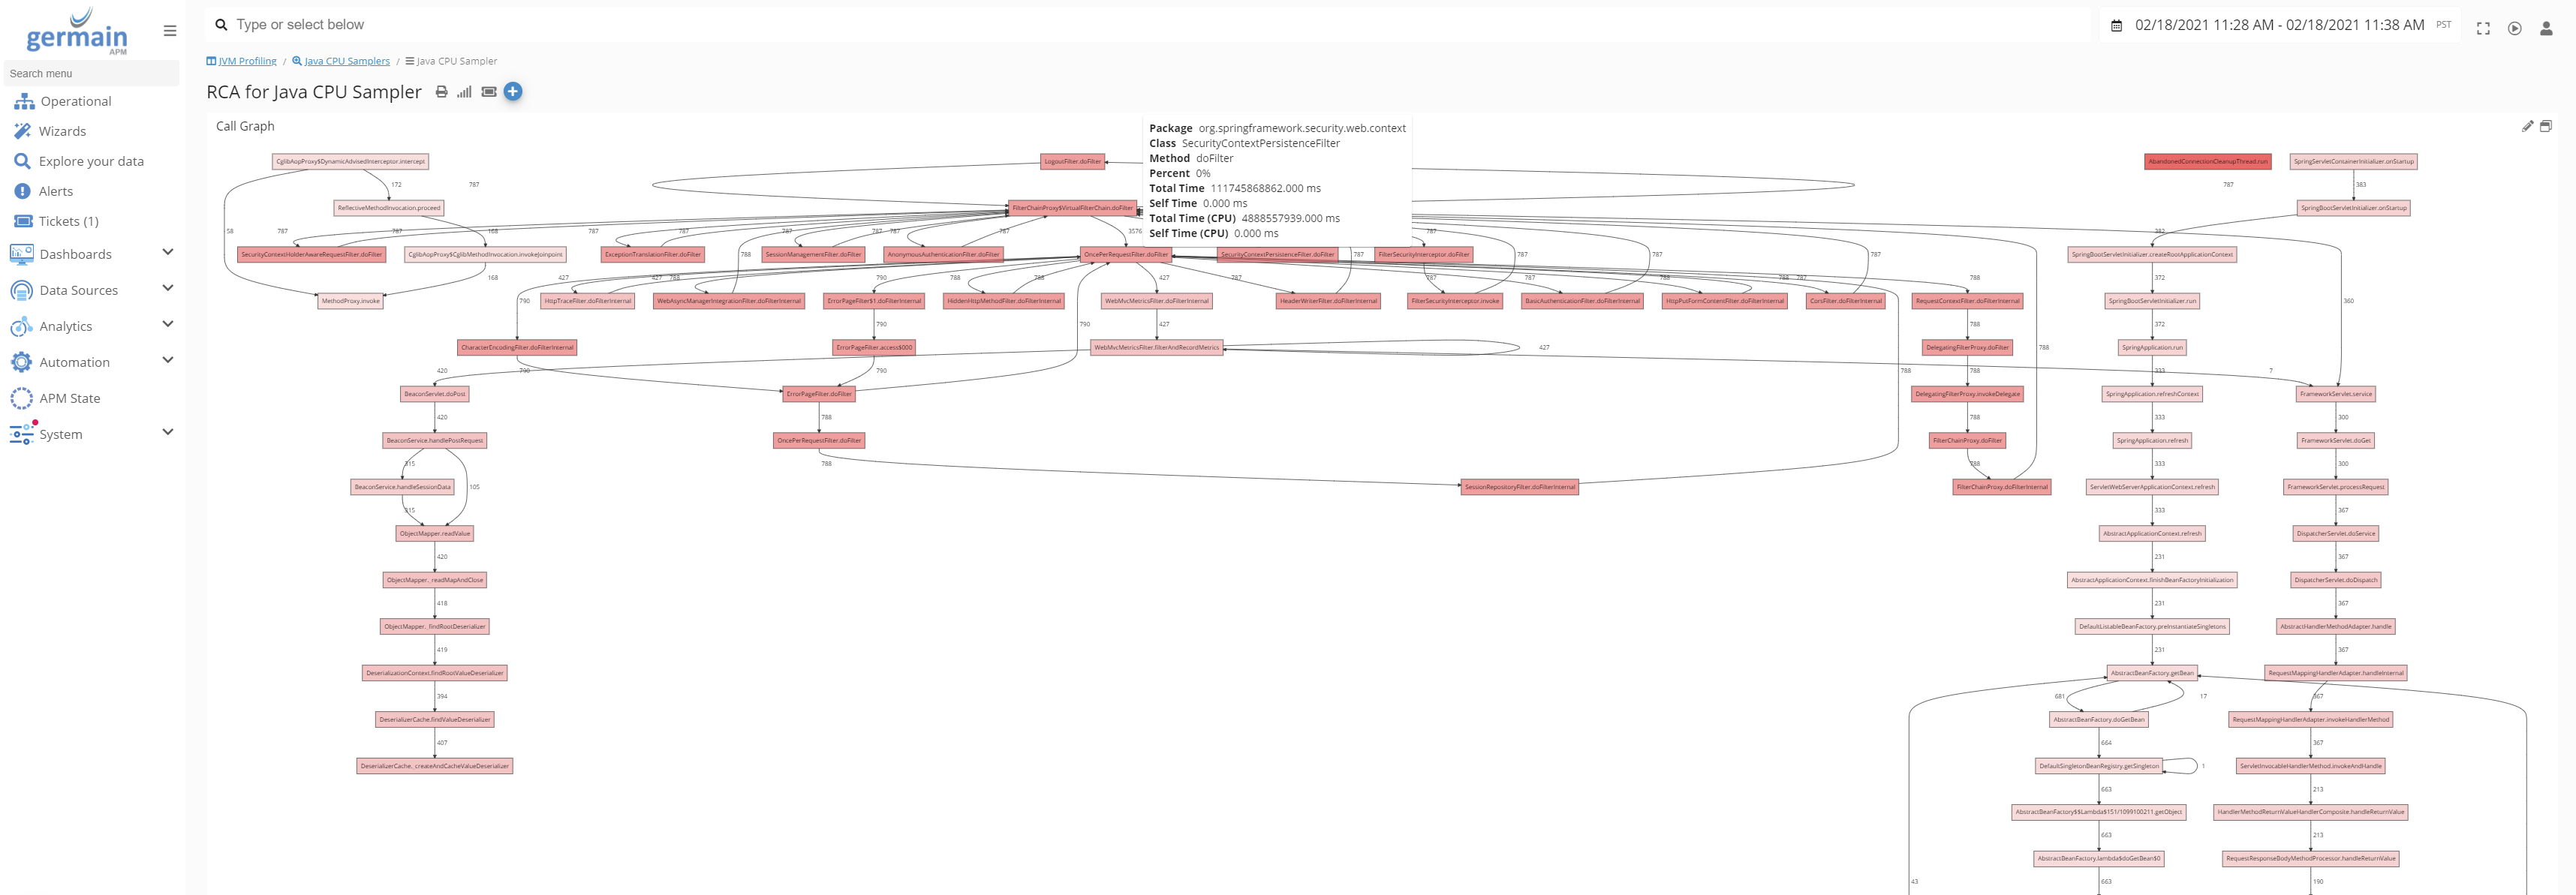
Analytics - Better visualization options for Code Analysis
Customers: American Airlines, eBay, Largest US-Based Healthcare
Description
New visualization to give a different way to look at the code execution path.
Example
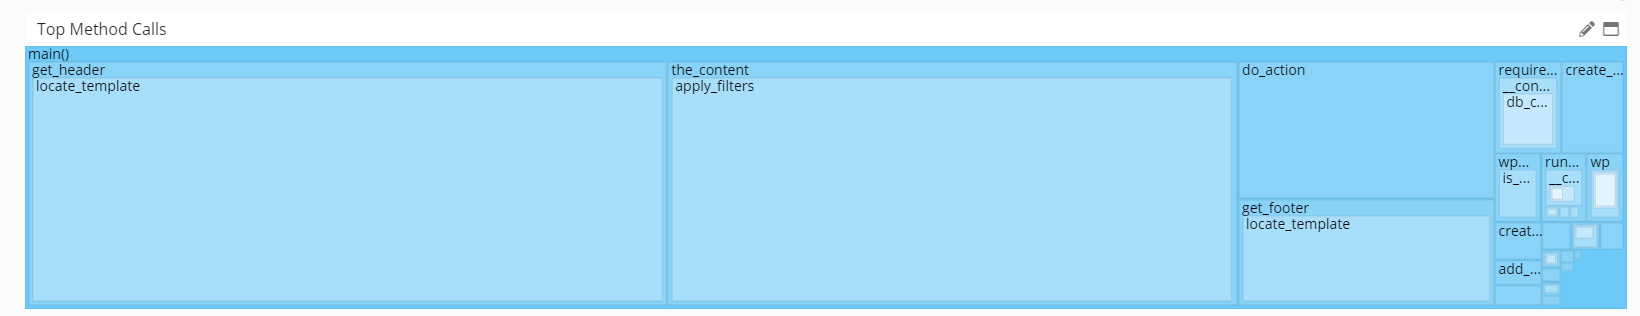
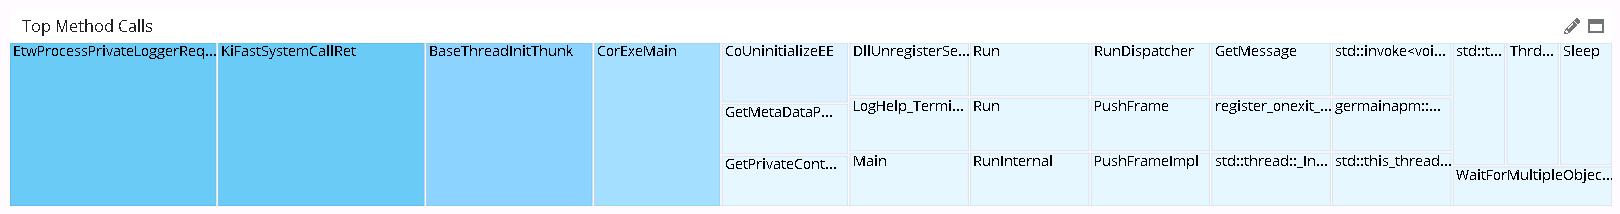
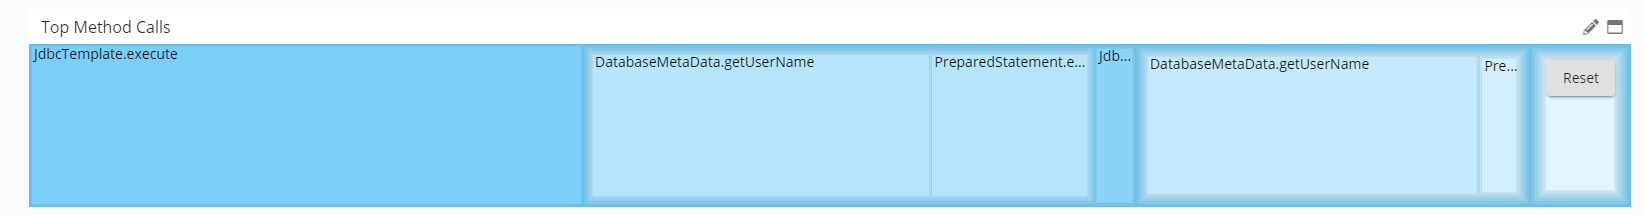
Monitoring & Analytics - PHP code profiling in real-time
Customers: American Airlines, eBay
Description
Realtime profiling/analysis of PHP code. Agent required to be deployed, similarly to other code-base e.g. Java, c#, golang, etc.
Example
https://germainux.atlassian.net/wiki/spaces/germainAPM/pages/1686339621
Monitoring & Analytics - Smart Insights (enh)
Description
Completed preconfiguration of all our SLA for Smarter insights. Support for various business periods (e.g. month-end, quarter-end, year-end, etc).
This comes in addition to what we did last month: Monitoring & Analytics - Smart Insights (historical data analysis & prediction)
Salesforce Monitoring & Analytics
Customers: American Airlines, ANZ Bank, General Electric, Volvo
Description
In addition to the Real User Monitoring and Replay, here are a number of new metrics Germain collects while monitoring a http://SalesForce.com apps.
-
Javascript Code Analysis (realtime) gets recorded via our 2nd Browser Extension (Chrome and other browsers) that is separate from the above extension
-
Connected users, Page Performance
-
Synthetic availability / synthetic click (when multifactor authentication disabled)
-
Business Process monitoring/insights
-
User Errors and Custom Errors (app or developer errors e.g. “Sorry or interrupt”, warnings, errors, asserts thrown into browser console by apex, views, developers, …)
-
Volume of Process Approvals
-
Volume of Actions Custom Apex
-
Volume of Actions Custom Flow
-
Volume of Actions Custom ExternalService
-
Volume of Records (amount of opportunities, accounts, leads, contacts, …)
-
Volume of Process Rules
-
Volume of Switch To Lightning
-
Volume of Switch To Classic
-
Volume of Lightning Users
-
Performance By Page (server side data; grouped as in the screenshot attached)
-
Performance By Browser (server side data; grouped as in the screenshot attached)
-
Apex Callout Event Type
-
Apex Execution Event Type
-
Apex Trigger Event Type
-
API Event Type
-
Aura Request Event Type
-
External OData Callout Event Type
-
Lightning Page View Event Type
-
Lightning Performance Event Type
-
Login Event Type
-
Logout Event Type
-
Metadata API Operation Event Type
-
Queued Execution Event Type
-
Report Event Type
-
Report Export Event Type
-
REST API Event Type
-
URI Event Type
-
Visualforce Request Event Type
SFDC integrations:
-
SFDC User Interface
-
SFDC Rest API
-
SFDC Data Log Events/ Service
-
Network between SFDC User’s Browser and SFDC Web Server
(Other Benefits that are available: Monitoring & Analytics - Salesforce.com (01/31/21) )
Example
All examples are available: Salesforce (Classic, Lightning) | Examples