
🔎 JavaScript Long Task and Browser Freeze Monitoring
GermainUX detects long-running JavaScript tasks that block the browser’s main thread and can make a web application slow or temporarily unresponsive.
By default, GermainUX records a JavaScript Long Task when uninterrupted activity occupies the browser’s main thread for at least three seconds. This monitoring is enabled by default for each applicable User Monitoring Profile.
⚙️ Monitoring components
|
Component |
Role |
|---|---|
|
Continuously detects long-running browser tasks when the monitoring script can be deployed in the application. |
|
|
Provides browser monitoring when RUM JS cannot be deployed directly or access to the complete browser-page context requires an extension. |
|
|
Captures JavaScript function execution, timing, browser activity, DOM activity, and other code-level evidence needed to investigate a long task or freeze. |
❓ What is a JavaScript Long Task?
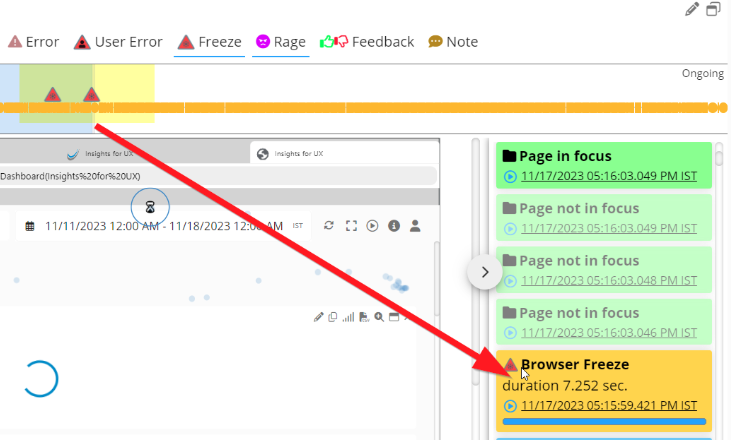
The browser’s main thread handles JavaScript execution, user input, rendering, and other page activity. When a task occupies that thread for too long, the browser cannot respond promptly to the user.
A long task can cause:
|
User impact |
Description |
|---|---|
|
Browser freeze |
The page appears temporarily unresponsive. |
|
Delayed interactions |
Clicks, typing, scrolling, or other inputs are processed late. |
|
Poor animation and scrolling |
Visual updates become slow or interrupted. |
|
Delayed rendering |
Page content or application changes take longer to appear. |
|
Reduced responsiveness |
The application reacts slowly even when the server is performing normally. |
A long task indicates blocked browser execution. It does not necessarily mean that the browser or application crashed.
S
Capabilities
GermainUX helps teams:
-
Detect long-running tasks during real user sessions.
-
Identify when and where the browser became unresponsive.
-
Determine the affected users, pages, sessions, and business workflows.
-
Correlate long tasks with clicks, navigation, errors, network activity, memory usage, and other browser events.
-
Review what the user experienced through Session Replay.
-
Measure the frequency, duration, trend, and user impact of browser freezes.
-
Identify pages, workflows, browsers, or releases with the greatest concentration of long tasks.
-
Use the JS Profiler to investigate the JavaScript functions and browser activity responsible for the delay.
-
Validate whether an application correction reduced or eliminated the problem.
Continuous monitoring
GermainUX RUM JS or the GermainUX RUM Extension continuously detects long tasks during real user activity.
Use:
-
RUM JS when the monitoring script can be added directly to the application.
-
RUM Extension when direct script deployment is unavailable or the application’s security model prevents access to the required browser context.
Each detected long task is associated with the available application, page, browser, user, and session context.
Code-level investigation with JS Profiler
When continuous monitoring identifies a long task or browser freeze, the GermainUX JS Profiler can provide deeper diagnostic evidence, including:
-
JavaScript function execution.
-
Function duration.
-
Exclusive and cumulative execution time.
-
Long-running browser tasks.
-
Browser events and user interactions.
-
JavaScript errors and stack traces.
-
DOM and rendering activity.
-
Network requests and resource loading.
-
Application, page, and session context.
This evidence helps identify whether the delay was caused by an expensive function, repeated processing, excessive DOM activity, resource loading, or another front-end operation.
The JS Profiler complements continuous monitoring. RUM JS or the RUM Extension can remain enabled across the user population, while deeper profiling should normally be limited to the affected application, users, pages, or investigation period.
Business benefits
JavaScript Long Task and Browser Freeze Monitoring helps organizations:
-
Detect browser responsiveness problems affecting real users.
-
Distinguish front-end execution delays from server or network latency.
-
Identify the users and business workflows experiencing the greatest impact.
-
Reduce the time required to reproduce intermittent browser freezes.
-
Move from a reported symptom to the JavaScript activity associated with it.
-
Prioritize corrections based on frequency and actual user impact.
-
Detect performance regressions introduced by new releases.
-
Validate improvements using real-user evidence.
Analytics
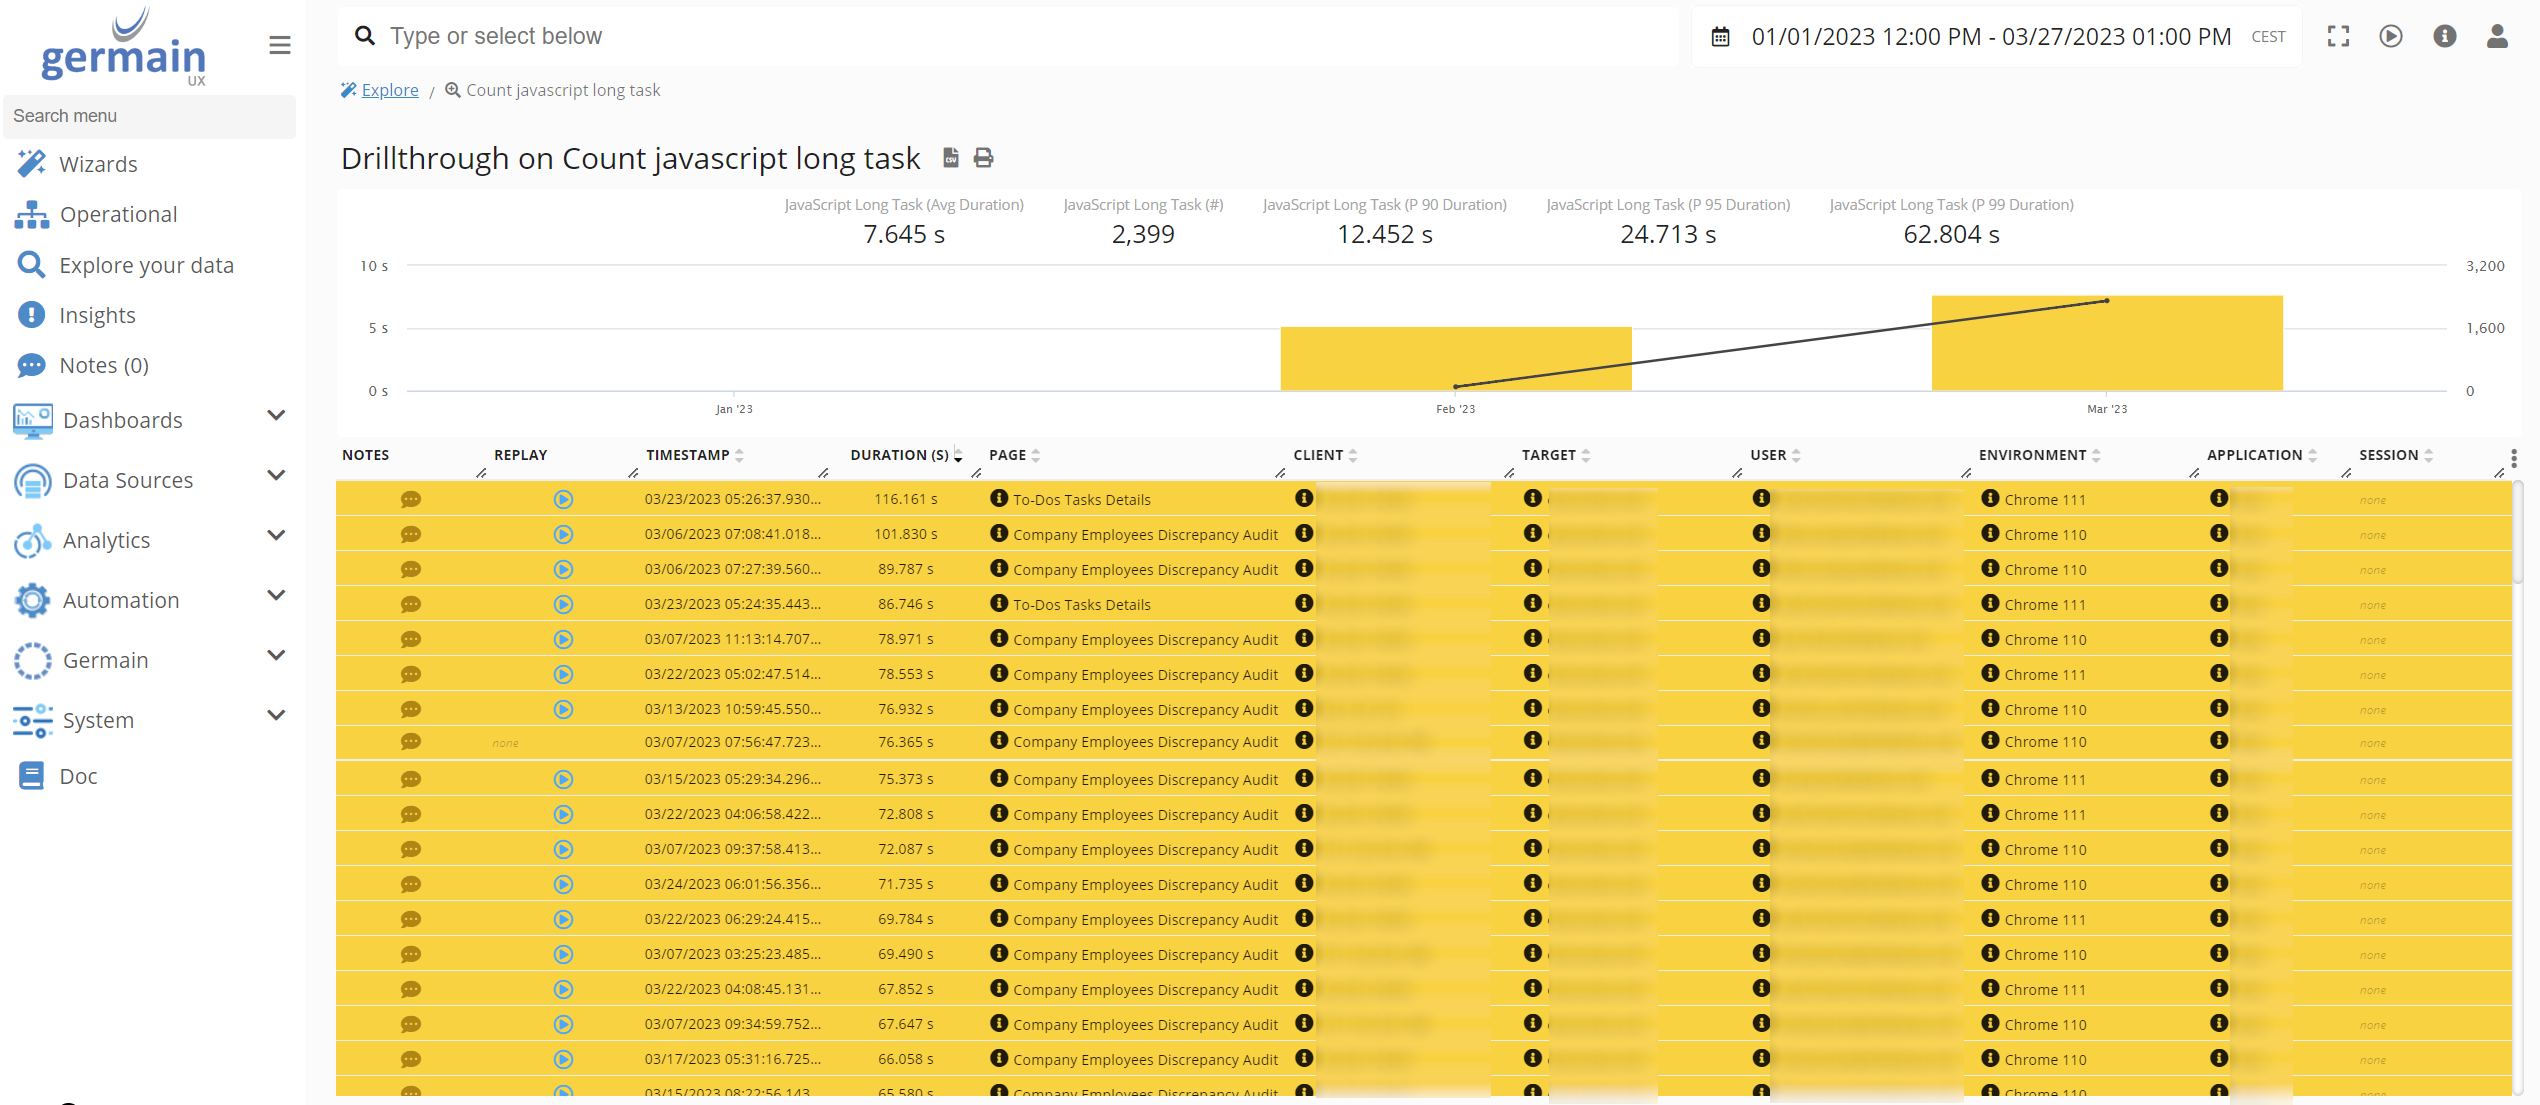
GermainUX can analyze long tasks through KPIs, measures, pivots, trends, drill-through views, and session context.
|
Analysis area |
Examples |
|---|---|
|
Duration |
Length of each long task or freeze |
|
Frequency |
Occurrence count, recurrence, concentration, and trend |
|
Impact |
Affected users, sessions, pages, and workflows |
|
Environment |
Application, release, browser, operating system, and device |
|
User context |
Clicks, typing, scrolling, navigation, and Session Replay |
|
Related evidence |
JavaScript errors, memory usage, network requests, and resources |
|
Code-level evidence |
Functions, execution time, DOM activity, and browser events |
GermainUX users can create watches to receive notifications when collected long-task insights meet conditions of interest.
Configuration
No configuration is required to use the default three-second threshold.
Change the long-task threshold
Use settings.plugins.performance.longtaskThresholdMillis to change the minimum duration required for GermainUX to record a long task.
The value is specified in milliseconds. The following example records tasks lasting at least five seconds:
const settings = germainApm.getDefaultSettings();

settings.plugins.performance.longtaskThresholdMillis = 5000;

germainApm.start(settings);
Choose a threshold that reflects the application’s expected behavior and monitoring objectives. A lower threshold detects shorter periods of main-thread blocking but generates more monitoring data.
Recommended investigation workflow
-
Use RUM JS or the RUM Extension to detect long tasks affecting real users.
-
Identify the affected applications, pages, workflows, users, and sessions.
-
Review the user’s experience through Session Replay.
-
Correlate the event with clicks, JavaScript errors, network requests, memory usage, and other browser activity.
-
Enable the JS Profiler for a controlled scope when code-level evidence is required.
-
Identify the responsible JavaScript function, script, component, resource, or dependency.
-
Implement the correction.
-
Validate the result using continuous long-task monitoring and, when necessary, another targeted profiling session.
Browser support
JavaScript Long Task monitoring depends on browser APIs supported by recent versions of:
-
Google Chrome
-
Microsoft Edge
-
Opera
RUM Extension and JS Profiler support also depends on the installed extension version, permissions, application architecture, and enterprise browser policies.
Deployment and configuration
|
For your browser environment |
|---|
|
Review Browser Monitoring. |
|
Review the Browser Monitoring Deployment Overview. |
|
Deploy GermainUX RUM JS when the monitoring script can be added to the application. |
|
Deploy the GermainUX RUM Extension when direct script deployment is unavailable or access to the complete browser-page context requires an extension. |
|
Deploy the GermainUX JS Profiler for deeper JavaScript execution and code-level diagnostics. |
|
Review the available Browser Monitoring configuration. |
|
Review the KPIs for User Monitoring and Replay. |
|
Review the available Browser Monitoring KPIs. |
ℹ️ Get Help
The Germain Team can help you set this up. Contact GermainUX Support.
Component: JS Profiler, RUM JS, RUM Extension
Feature Availability: 2022.1 or later
Browser Support: only latest Chrome, Edge and Opera