
⚙️ Microsoft Dynamics 365 Monitoring
👀 Overview
GermainUX provides real-time user experience monitoring, Session Replay, business-process analysis, application monitoring, and automation for Microsoft Dynamics 365.
It helps organizations understand:
|
Item |
|
|---|---|
|
1 |
How users interact with Dynamics 365 |
|
2 |
Which features and workflows are adopted |
|
3 |
Where users lose time or abandon processes |
|
4 |
Which errors and performance issues affect users |
|
5 |
Why integrations or business transactions fail |
|
6 |
How issues affect productivity and business outcomes |
Monitoring can be configured for Dynamics 365 Sales, Customer Service, Field Service, Finance, Supply Chain Management, and other compatible browser-based Dynamics 365 applications.
🧰 Monitoring Capabilities
👥 Real User Monitoring
GermainUX captures the experience of users working in Dynamics 365, including:
|
Captured Item |
|---|
|
User sessions |
|
Pages, views, and navigation |
|
Clicks and other user actions |
|
User-action response time |
|
Browser and JavaScript errors |
|
Network requests |
|
Failed or slow resources |
|
Browser, device, location, and application context |
This data can be segmented by application, environment, user, role, business process, page, browser, region, release, or other configured attributes.
🎥 Session Replay
Session Replay reconstructs captured user activity so support, application, and business teams can understand what occurred before an issue.
Replay can help identify:
|
Issue |
|---|
|
Navigation and usability problems |
|
Application errors |
|
Slow interactions |
|
Repeated or ineffective actions |
|
Failed workflow steps |
|
User confusion |
|
Process abandonment |
|
Issues reported through user feedback |
Session Replay is a reconstruction of captured browser activity, not a video recording. Its completeness depends on the application structure, browser context, monitoring scope, and privacy configuration.
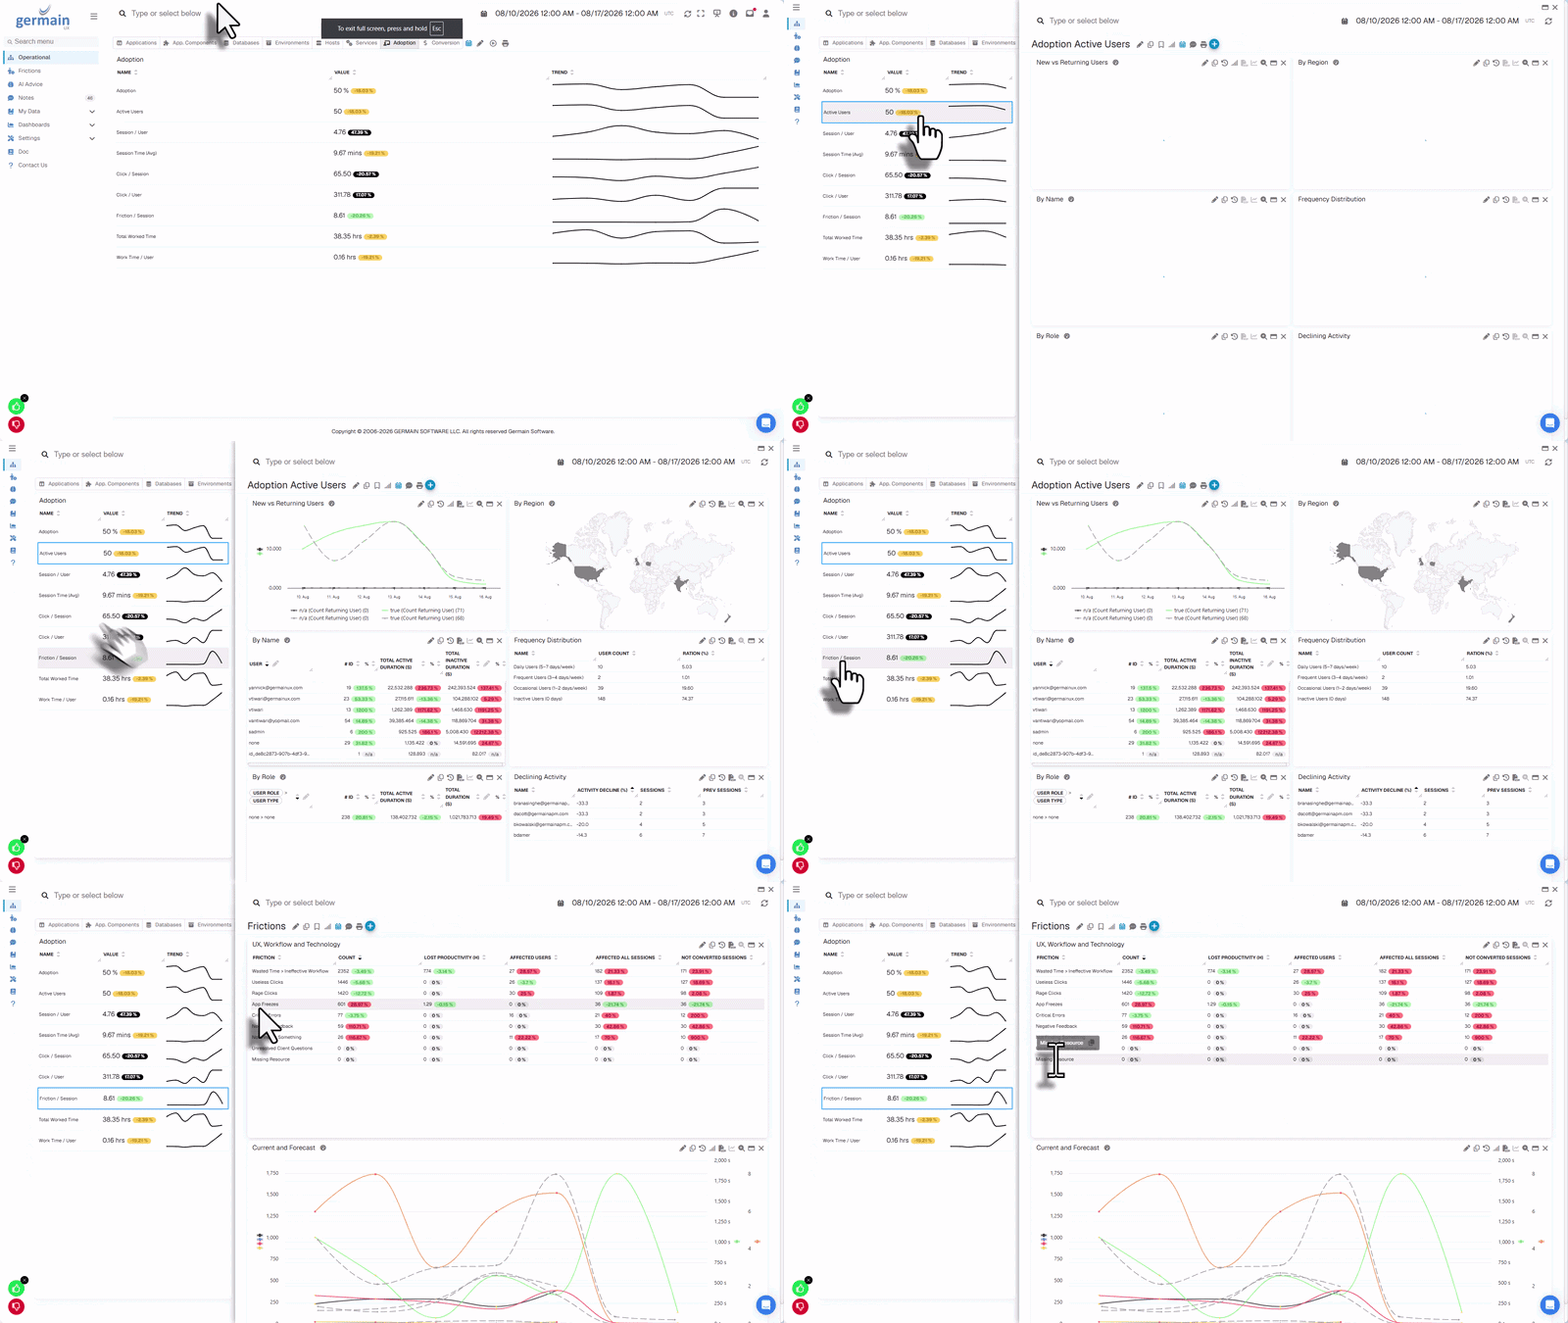
📈 Adoption Analysis
GermainUX measures how Dynamics 365 users and teams adopt applications, features, and processes.
Adoption analysis can include:
|
Metric |
|---|
|
Active and unique users |
|
Session frequency and duration |
|
Pages and features used |
|
Features that are rarely or never used |
|
Usage by role, team, region, or department |
|
Navigation paths |
|
Repeated actions |
|
Process completion and abandonment |
|
Adoption changes after a release or training initiative |
These insights help identify opportunities to simplify workflows, improve training, and increase the value obtained from Dynamics 365.
⚙️ Business-Process Monitoring
GermainUX monitors business processes based on observable user actions, application events, network activity, logs, APIs, or synthetic transactions.
Examples include:
|
Process |
|---|
|
Lead qualification |
|
Opportunity management |
|
Quote creation |
|
Case management |
|
Customer onboarding |
|
Work-order processing |
|
Approval workflows |
|
Sales-order entry |
|
Service-request resolution |
|
Custom Dynamics 365 processes |
For each process, GermainUX can analyze:
|
Analysis |
|---|
|
Process volume |
|
Completion and failure rates |
|
Abandonment |
|
End-to-end duration |
|
Step duration |
|
Repeated steps |
|
Ineffective navigation |
|
Process overrun |
|
Lost productivity |
|
Errors and performance issues affecting completion |
🐛 Error Monitoring and Analysis
GermainUX captures errors visible through browser monitoring and configured data sources, including:
|
Error Source |
|---|
|
JavaScript errors |
|
Browser console errors |
|
HTTP failures |
|
Network timeouts |
|
Failed resources |
|
Visible application error messages |
|
Functional failures returned with successful HTTP statuses |
|
Failed business-process steps |
|
API and integration errors |
|
Errors from accessible application logs |
Errors can be ranked by affected users, sessions, recurrence, duration, process impact, and business importance. Individual errors can then be investigated through related sessions, Session Replay, network requests, and other available telemetry.
🚤 Performance Monitoring
GermainUX measures user-perceived Dynamics 365 performance, including:
|
Metric |
|---|
|
Page and view load time |
|
User-action response time |
|
Network-request duration |
|
Resource-load duration |
|
Business-process duration |
|
Individual process-step duration |
|
API and integration response time |
|
Synthetic transaction duration |
Analyze percentiles and affected-user counts in addition to averages, which can hide severe issues experienced by subsets of users.
💻 JavaScript Monitoring
GermainUX can monitor browser-side JavaScript activity and identify:
|
JS Issue |
|---|
|
JavaScript errors |
|
Long-running or inefficient JavaScript activity |
|
Slow browser operations |
|
Client-side performance bottlenecks |
|
Scripts associated with slow user interactions |
Deep JavaScript profiling depends on browser capabilities, security policies, and the configured GermainUX JS Profiler.
🔗 Integration Monitoring
Dynamics 365 often depends on Microsoft services, APIs, middleware, and external applications. GermainUX can monitor integrations through accessible browser requests, APIs, logs, databases, or custom data sources.
Monitoring can include:
|
Integration Metric |
|---|
|
Request volume |
|
Response time |
|
HTTP status |
|
Errors and timeouts |
|
Retries |
|
Availability |
|
Failed data exchanges |
|
Downstream-service performance |
Examples include integrations with Power Platform, Azure services, ERP systems, identity providers, contact-center platforms, document services, and custom APIs.
GermainUX can monitor only the interfaces and telemetry accessible to its deployed components. It does not automatically access Microsoft-managed server internals.
💬 User Feedback
GermainUX can collect feedback directly from Dynamics 365 users and associate it with the available session context.
Feedback can be analyzed with:
|
Context |
|---|
|
User actions |
|
Application page or view |
|
Business-process step |
|
Errors |
|
Performance |
|
Session Replay |
|
Browser and device context |
This helps determine whether negative feedback is related to a technical issue, inefficient process, usability problem, or training need.
🤖 Synthetic Monitoring
GermainUX RPA bots can execute critical Dynamics 365 scenarios on a schedule to detect problems before users report them.
Synthetic scenarios can validate:
|
Scenario |
|---|
|
Authentication |
|
Application availability |
|
Navigation |
|
Record search |
|
Record creation or update |
|
Form submission |
|
Opportunity or case workflows |
|
Custom business processes |
|
Integrations visible through the tested transaction |
GermainUX can measure scenario availability, duration, step performance, failures, and unexpected application behavior.
Use dedicated test accounts, controlled test data, and the minimum required permissions.
📦 Deployment Options
🔌 GermainUX RUM Browser Extension
For Microsoft-hosted Dynamics 365 pages where customers cannot add a monitoring script to the root application context, deploy the GermainUX browser extension.
The extension enables GermainUX monitoring within the Dynamics 365 application while respecting the configured scope and privacy rules.
✨ GermainUX RUM JS
Use RUM JS for customer-controlled web pages, portals, embedded applications, or custom interfaces where the monitoring script can be deployed in the required browser context.
A script running inside a restricted or cross-origin component cannot automatically monitor the Dynamics 365 parent application. Each required browser context must permit and contain the monitoring mechanism.
🖥️ GermainUX Engine
Deploy the GermainUX Engine to support:
|
Capability |
|---|
|
Synthetic scenario execution |
|
API and integration monitoring |
|
Log and file monitoring |
|
Infrastructure monitoring |
|
Alerts, reports, and automated actions |
|
Custom data collection |
🔎 GermainUX JS Profiler
Use the JS Profiler when deeper browser-side JavaScript analysis is required and permitted by the browser and application security configuration.
📊 Analytics and Dashboards
GermainUX dashboards can provide real-time and historical views of:
|
Dashboard View |
|---|
|
User adoption |
|
User experience |
|
Business-process effectiveness |
|
Lost productivity |
|
Errors and affected users |
|
Application performance |
|
Integration health |
|
Synthetic availability |
|
User feedback |
|
Release impact |
Teams can drill down from aggregated metrics to affected applications, users, sessions, actions, errors, requests, and Session Replays.
⏰ Alerts, Reports, and Automation
Configure SLAs and alerts for conditions such as:
|
Condition |
|---|
|
Dynamics 365 unavailability |
|
Increased error volume |
|
Slow user actions |
|
Failed or abandoned business processes |
|
Integration failures |
|
Synthetic transaction failures |
|
Declining feature adoption |
|
Increased lost productivity |
|
Negative user feedback |
GermainUX can send alerts and scheduled reports or initiate approved actions through the Engine, including webhooks, HTTP requests, scripts, database operations, and ticketing integrations.
Automated corrective actions must be explicitly authorized, tested, and limited to systems accessible to GermainUX.
🔒 Privacy and Security
Before enabling user monitoring and Session Replay:
|
Requirement |
|---|
|
Mask passwords and sensitive input fields. |
|
Exclude confidential pages and elements. |
|
Remove authentication tokens and sensitive URL parameters. |
|
Restrict access to session and replay data. |
|
Define appropriate retention periods. |
|
Use pseudonymous user identifiers where possible. |
|
Review monitoring against organizational and regulatory requirements. |
Test privacy rules across all Dynamics 365 applications and custom components included in the monitoring scope.
Deployment and configuration
|
For your Microsoft Dynamic 365 environment |
|---|
|
Review the Microsoft Dynamics 365 Monitoring Deployment Overview. |
|
Deploy Real User Monitoring, Session Replay, customer-journey analysis, heatmaps, errors, and performance monitoring. |
|
Configure business-process and adoption monitoring for loss productivity discovery and funnel drop-off. |
|
Configure Error Monitoring for Microsoft Dynamics 365. |
|
Configure User Feedback for Microsoft Dynamics 365. |
|
Deploy the GermainUX Engine when Microsoft Dynamics 365 APIs, authoritative order data, integrations, logs, synthetic monitoring, reports, or automation are required. |
|
Deploy the GermainUX RPA Bot Recorder to create synthetic user scenario and other critical workflows. |
|
Review the available Microsoft Dynamics 365 Monitoring KPIs. |
Component requirements and feature availability depend on the Microsoft Dynamics 365 version, available APIs, and desired monitoring depth.
📦 Additional Resources
-
Deploy Monitoring or automation for Microsoft Dynamic 365
-
AI Insights & Recommendations
-
More Analytics Features
-
More Automation Features
ℹ️ Get Help
The Germain Team can help you set this up. Contact GermainUX Support.
Component: Engine, JS Profiler, Mobile App, RPA Bot Recorder, RUM JS
Feature Availability: 2022.1 or later