
🎥 Real User Monitoring, Session Replay and Heatmaps
GermainUX records and analyzes real user activity in monitored web applications, 24/7 and in real time. Its millisecond-precise Session Replay visually reconstructs what users experienced, while searchable events, automated insights and six heatmap types help teams understand behavior and friction across individual sessions and larger user populations.
By combining qualitative evidence from Session Replay with quantitative analytics at scale, GermainUX helps teams understand what happened, why it happened, who was affected and what action should be taken—without manually reviewing thousands of recordings.
🎯 Business Outcomes
GermainUX helps organizations:
-
Improve user experience by identifying confusion, frustration and ineffective interactions.
-
Increase CRM and application adoption by understanding where users struggle with features and workflows.
-
Improve employee productivity by detecting unnecessary steps, delays and time lost.
-
Increase conversion by identifying the behavior, journey and technology issues causing abandonment.
-
Resolve complaints and support cases faster by replaying what the user actually experienced.
-
Prioritize improvements according to the number of users affected and the resulting business impact.
-
Correlate user behavior with errors, performance, network activity and business processes.
-
Protect sensitive data through configurable privacy, masking and access controls.
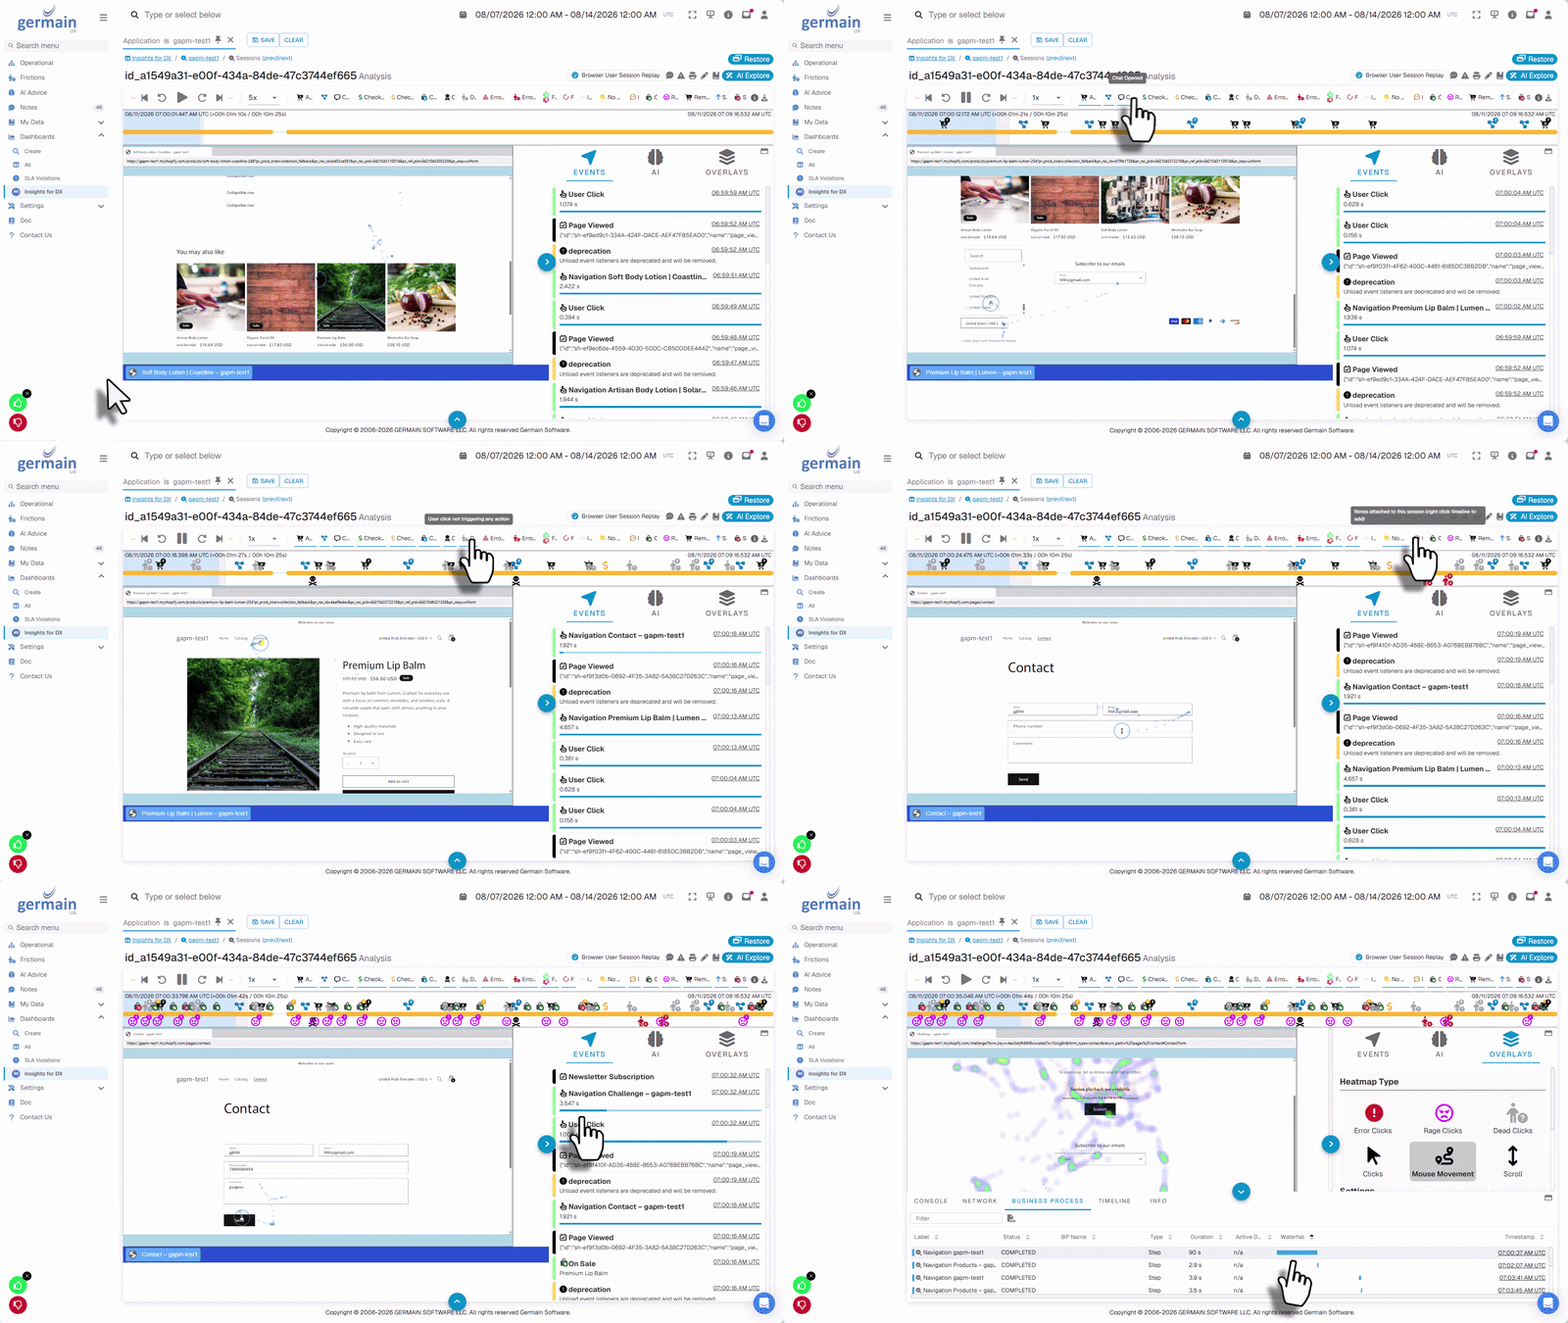
🔁 Session Replay, AI Summary, AI Advice, Heatmaps, Analysis View: Five Complementary Views
Session Replay and heatmaps answer different but complementary questions.
|
Capability |
Primary question answered |
|---|---|
|
Session Replay Player |
What exactly did this user experience, and what happened before and after the issue? |
|
6 Heatmaps |
Where do users collectively engage, hesitate or struggle on this page or experience? |
|
Analysis Dashboard |
How often does the issue occur, who is affected and what is its business impact? |
|
AI Summary for Individual Session |
No need to replay a user session to know what the user did. |
|
AI Summary for Multiple Sessions |
Know the top frictions without manually analyzing thousands of user sessions or doing any data science — delivered straight to your inbox at the end of each day, week, or month or available on the AI Advice dashboard. |
A heatmap can reveal that many users repeatedly interact with an ineffective element. Session Replay can then show what those users saw, what they attempted and what happened next. Dashboards quantify the pattern and help determine whether it deserves priority.
📹 Real User Monitoring and Session Replay
GermainUX captures authorized user activity and reconstructs the experience for investigation and analysis.
Depending on the monitored application and privacy configuration, recorded activity can include:
-
Mouse movements, clicks and touch interactions
-
Keyboard and text-input activity
-
Page navigation and application transitions
-
Dropdown, menu and selection activity
-
Popups and browser-window behavior
-
Multi-tab activity within the authorized monitored application
-
User-visible messages and validation events
-
Business-process milestones
-
Page loads and performance events
-
Browser freezes, errors and network activity
Session Replay provides more than a video. Every captured event remains structured, timed and searchable, allowing teams to move directly to the relevant moment and correlate it with supporting evidence.
🔎 What Teams Can Investigate
Session Replay helps teams:
-
See exactly what a user did before an issue occurred
-
Understand the sequence of actions and application events
-
Investigate complaints without asking the user to reproduce the problem
-
Identify workflow friction and wasted time
-
Understand why a user abandoned a journey
-
Validate whether an error was visible to the user
-
Correlate behavior with application slowness or failure
-
Compare successful and unsuccessful sessions
🤖 AI-Generated Session Summaries
GermainUX can automatically summarize a user session, highlighting:
-
The user’s apparent objective
-
Important actions and journey milestones
-
Errors, delays and friction encountered
-
Behavioral signals indicating confusion or frustration
-
The likely outcome of the session
-
Areas requiring further investigation
This reduces the need to replay an entire session while preserving access to the complete evidence.
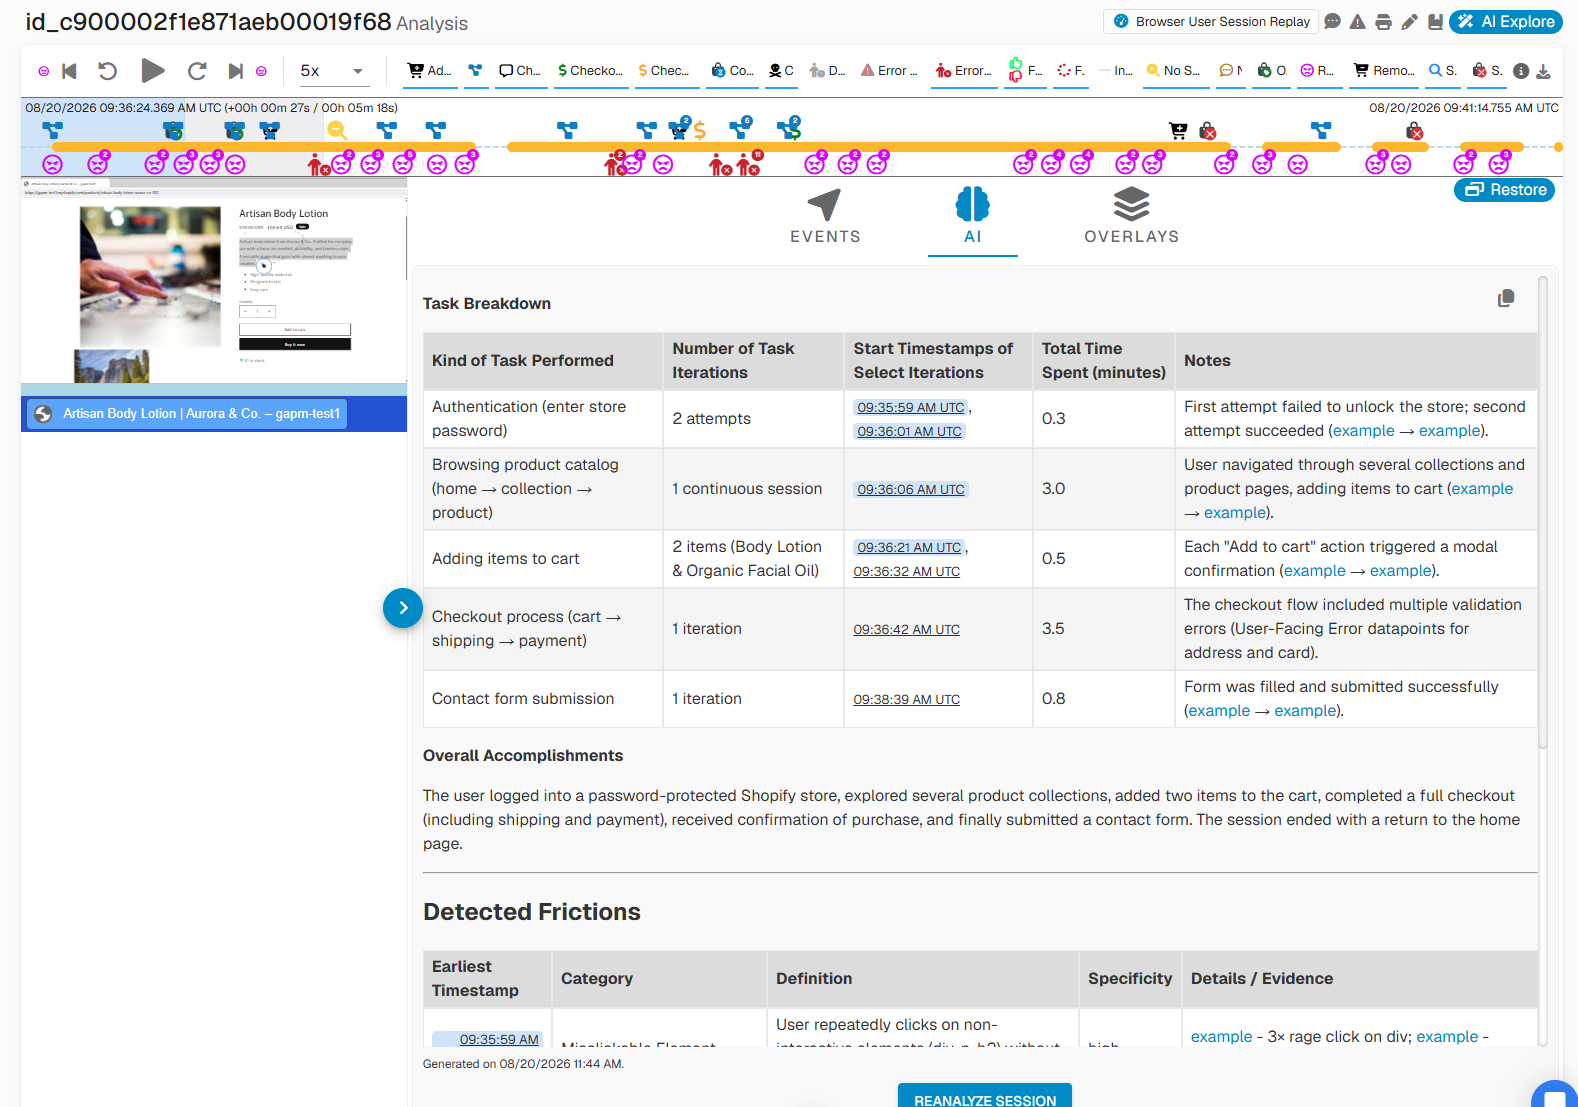
Summaries and prompts can be customized for use cases such as CRM adoption, eCommerce conversion, employee productivity, customer support or application troubleshooting.
Analysis Across Multiple Sessions
GermainUX can analyze multiple sessions together to identify and rank recurring UX, workflow and technology issues. This helps teams understand the most important patterns without selecting recordings at random.
Analysis can be scheduled and delivered through alerts or recurring reports, with prioritization based on measures such as affected users, lost productivity, conversion impact, error frequency or another configured business KPI.
Scheduled AI Summary Report Example (to find & solve the top 10 critical issues):
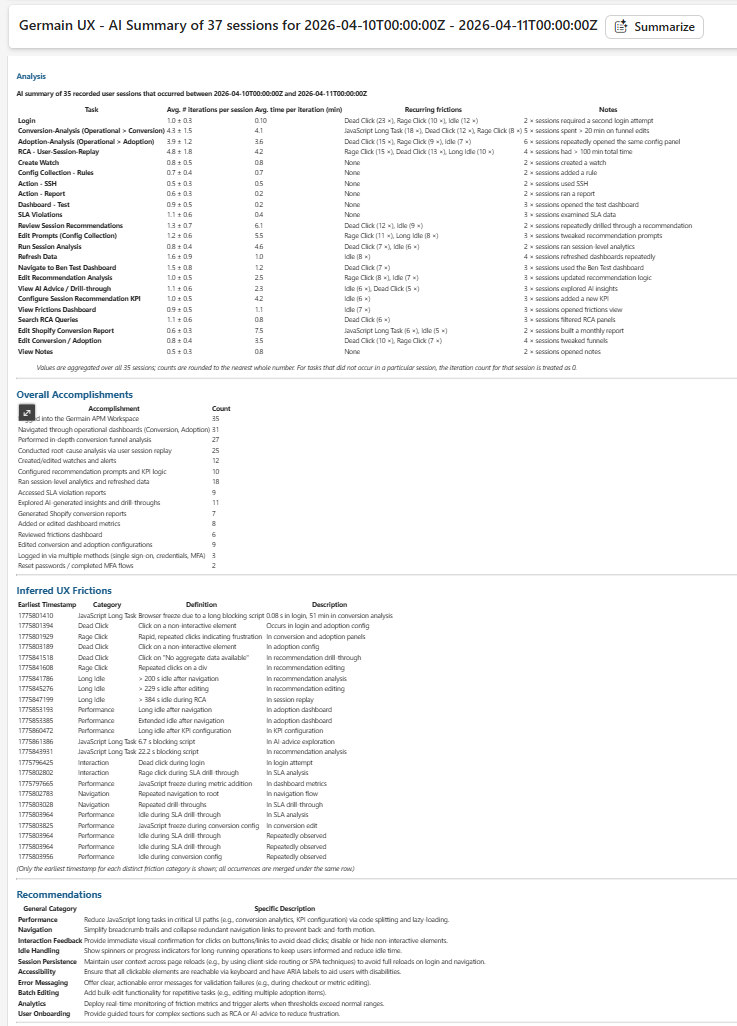
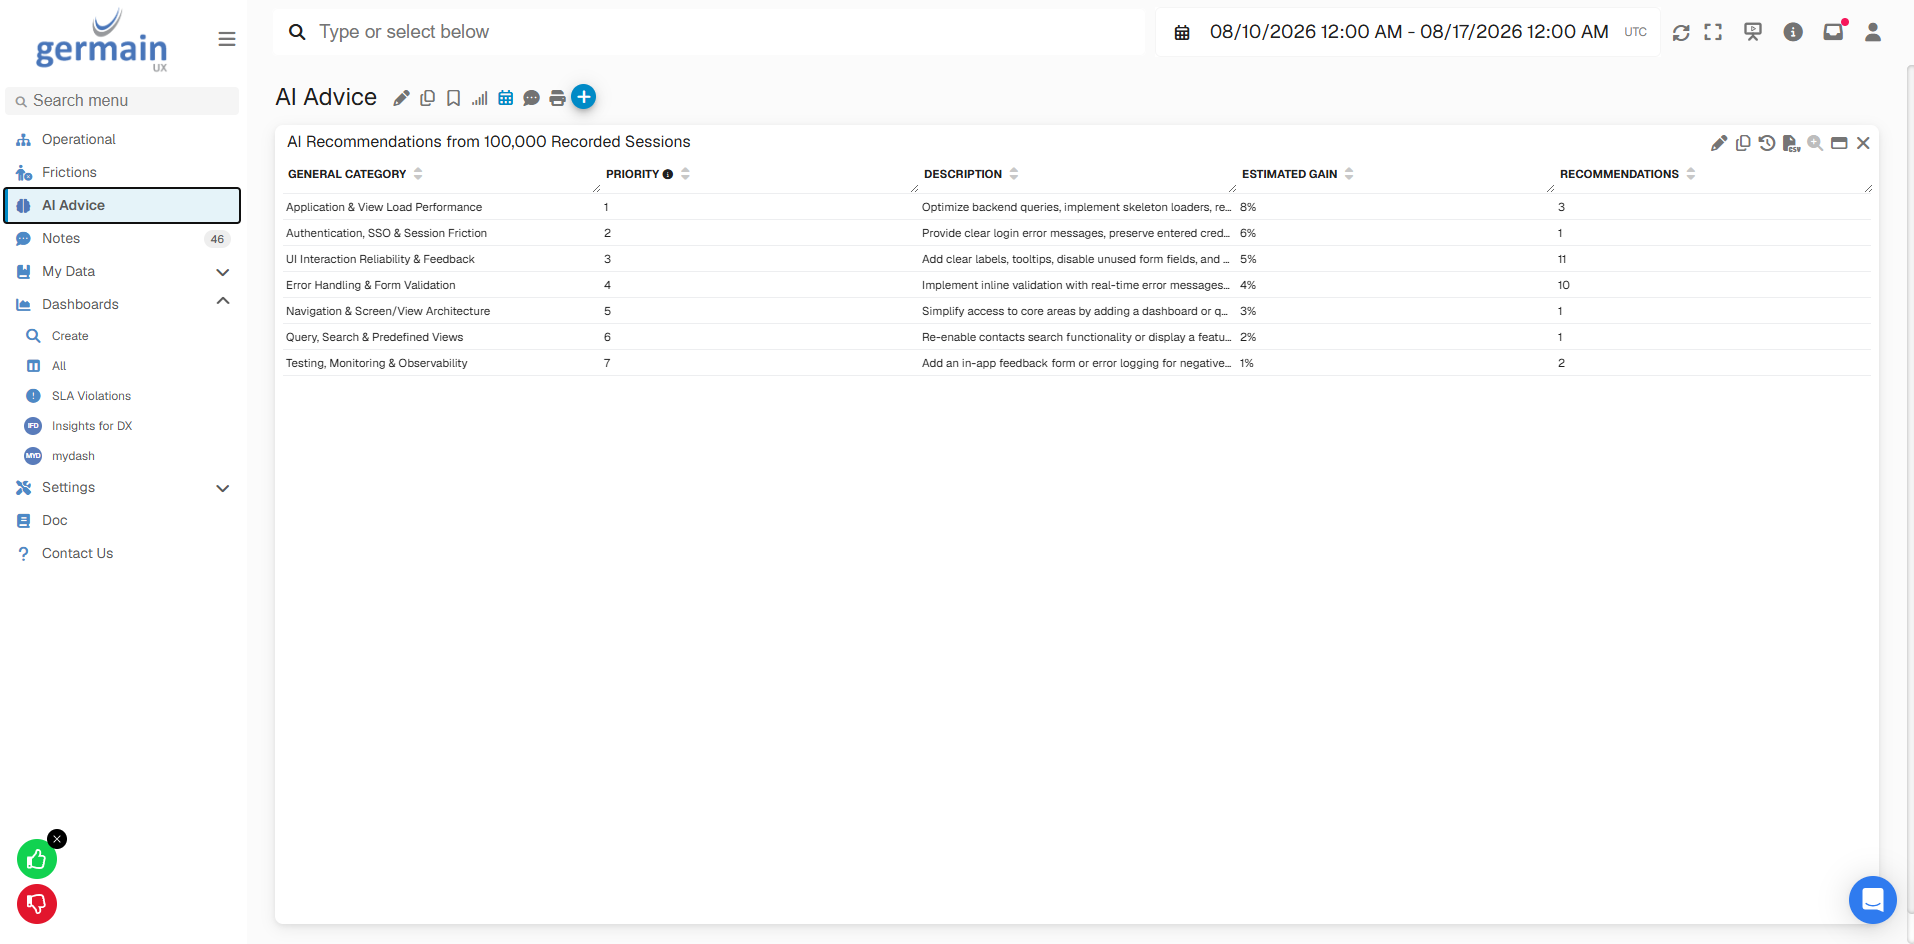
Or this analysis can be delivered through dashboards such as the AI Advice dashboard:
AI Advice Dashboard
🔥 Six heatmaps and Behavioral Overlays
GermainUX provides six heatmap and overlay types for analyzing where users engage and where they encounter friction. They can be used within an individual session or across larger sets of sessions, depending on the selected heatmap and configuration.
Heatmaps help teams understand:
-
Which areas receive the most interaction
-
Which content and calls to action attract attention
-
Where users click on elements that do not respond
-
Where repeated interaction may indicate frustration
-
How far users progress through pages or experiences
-
How behavior differs across user segments, devices or outcomes
Heatmaps are most useful when combined with Session Replay and business outcomes. A heavily clicked element is not necessarily successful; replay and downstream behavior reveal whether the interaction helped the user progress or created friction.
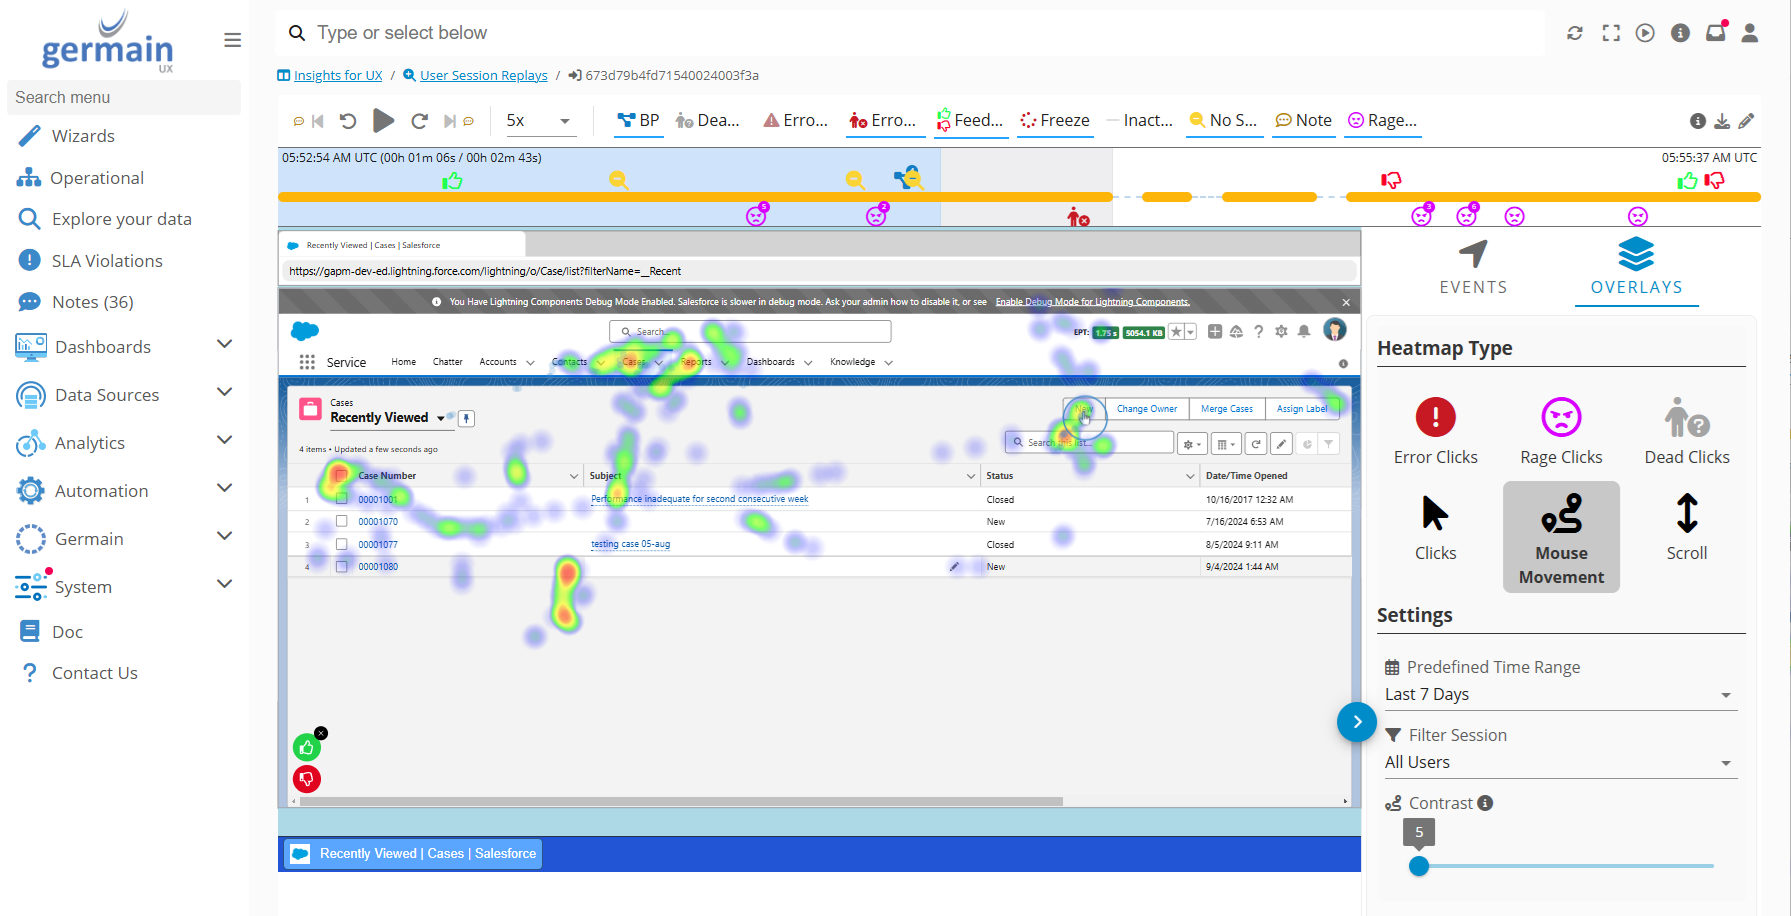
Learn more about configuring and using GermainUX heatmaps.
⚠️ Automated Friction Detection
GermainUX automatically detects behavioral, workflow and technology signals that may indicate a poor user experience.

🧭 Behavioral Friction
Examples include:
-
Dead or ineffective clicks
-
Rage clicks and repeated interactions
-
Repeated searches or selections
-
No-result searches
-
Confusing navigation patterns
-
Unexpected inactivity or abandonment
-
Users unable to locate expected content or functionality
Workflow Friction
Configured business processes make it possible to track:
-
When each process step occurs
-
How long the step and complete workflow take
-
Where users wait, repeat work or abandon
-
Which users, teams or segments are affected
-
How much productivity or conversion is lost
Business-process events appear in the Session Replay timeline, allowing teams to connect process measurements with the user’s actual experience.
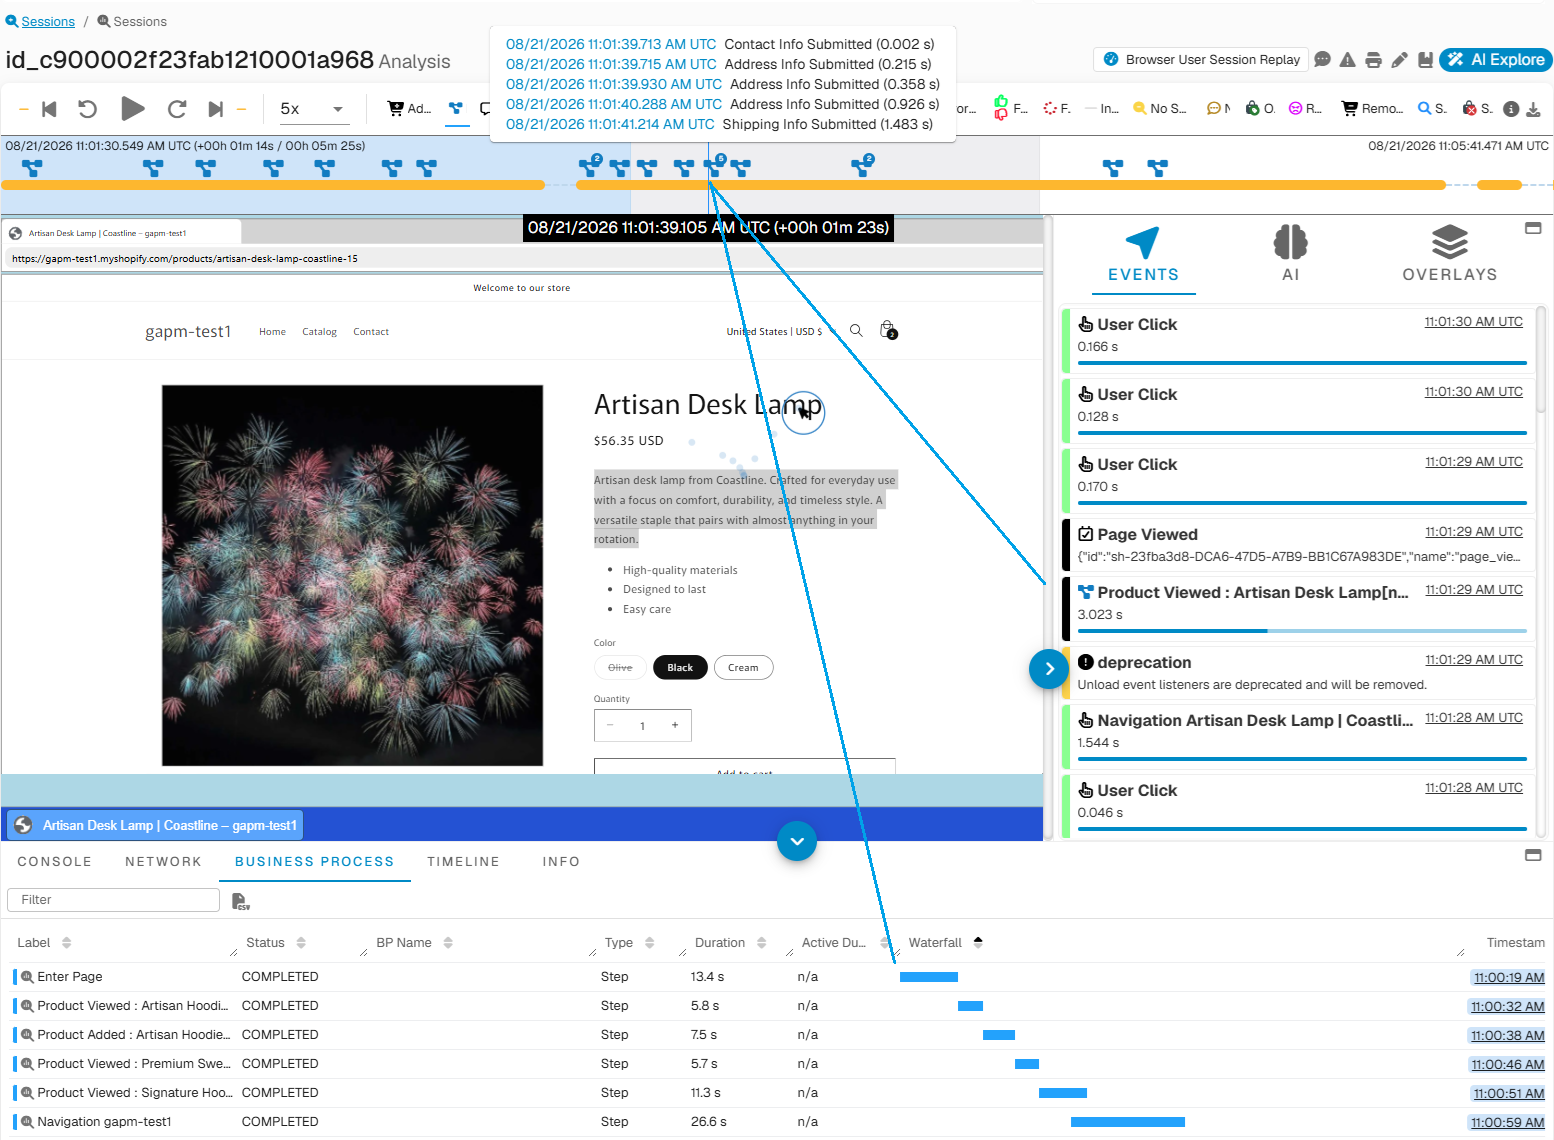
Technology Friction
Examples include:
-
User-visible application errors
-
Hidden browser or backend errors
-
Failed HTTP requests
-
Slow page loads and application operations
-
JavaScript long tasks and browser freezes
-
Failed integrations or unavailable services
-
Incorrect or outdated static resources
Technology events can be replayed in context so teams understand whether and how they affected the user. Check our Technology-related KPIs
User-Visible and Hidden Errors
GermainUX distinguishes errors that users saw from errors that occurred only in browser, application or backend telemetry.
|
Error perspective |
Why it matters |
|
User-visible error |
Directly affected the experience and may have blocked a task or journey |
|
Hidden technical error |
May still explain degraded behavior, incomplete processing or a later failure |
|
User validation event |
Provides expected feedback intended to prevent invalid input or workflow mistakes |
This distinction helps teams prioritize broken experiences without treating every validation message or background error as equally important.
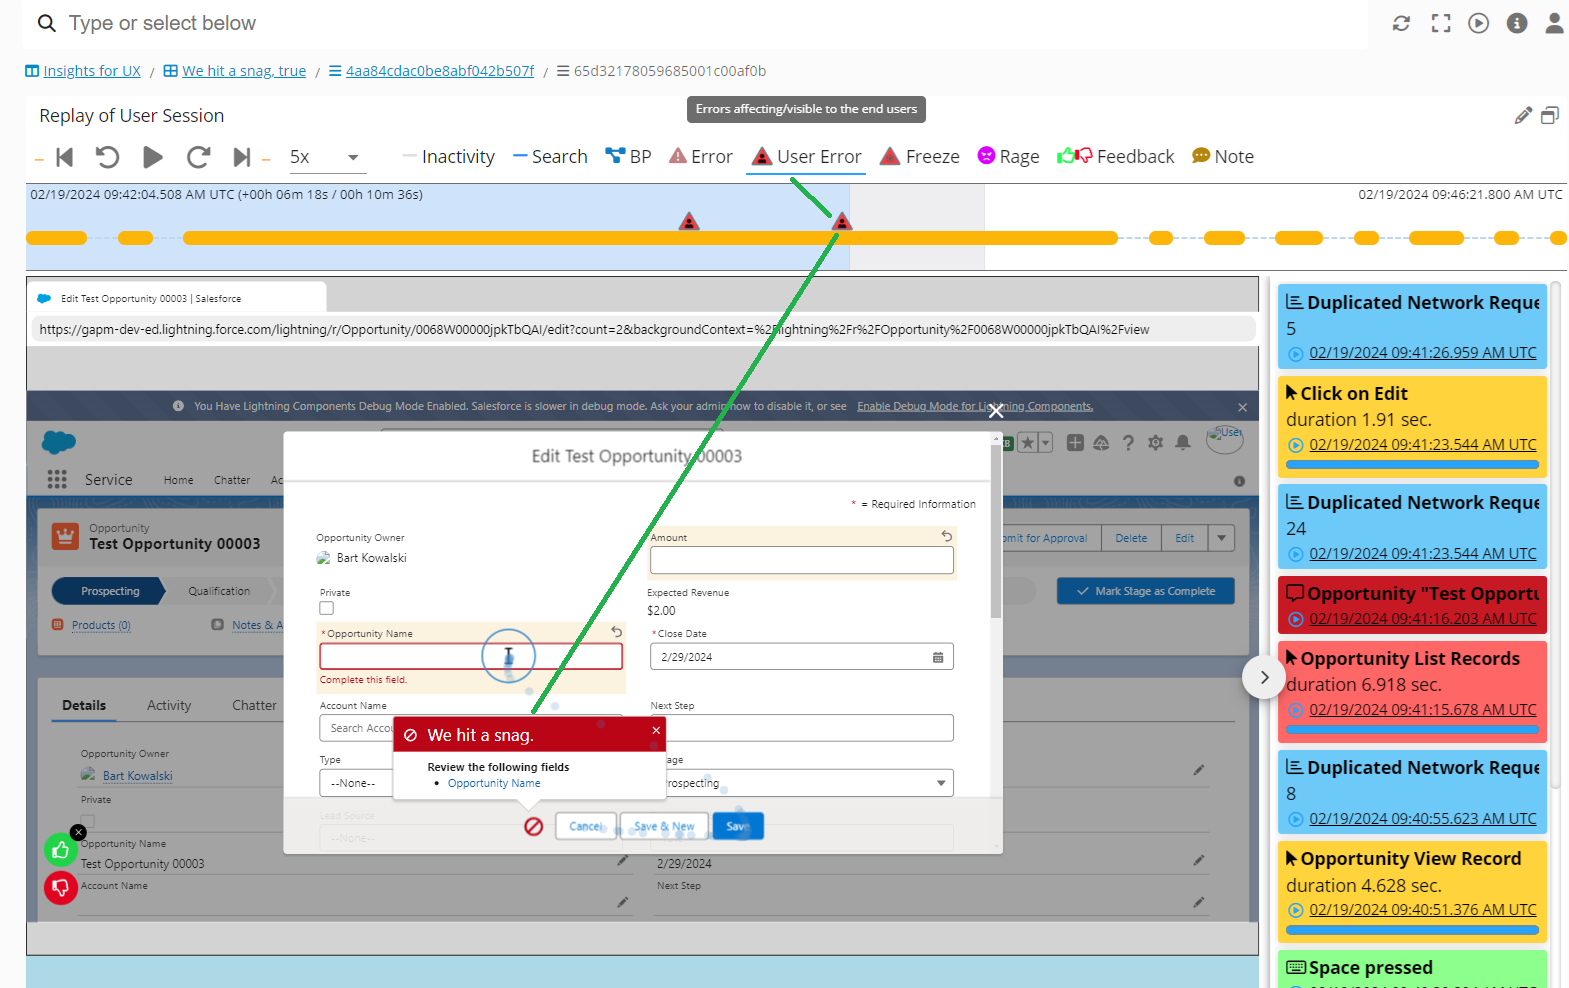
.
Feedback Connected to Session Replay
The GermainUX Feedback Popup can collect ratings, NPS-style feedback and comments during a monitored experience.
Each response can be associated with the relevant Session Replay, allowing teams to understand:
-
What the user attempted before providing feedback
-
Which friction or error may have influenced the response
-
Whether similar feedback affects other users
-
Which page, workflow, product or application area was involved
Aggregated feedback reports quantify recurring themes, while individual replays provide the context required for root-cause validation.
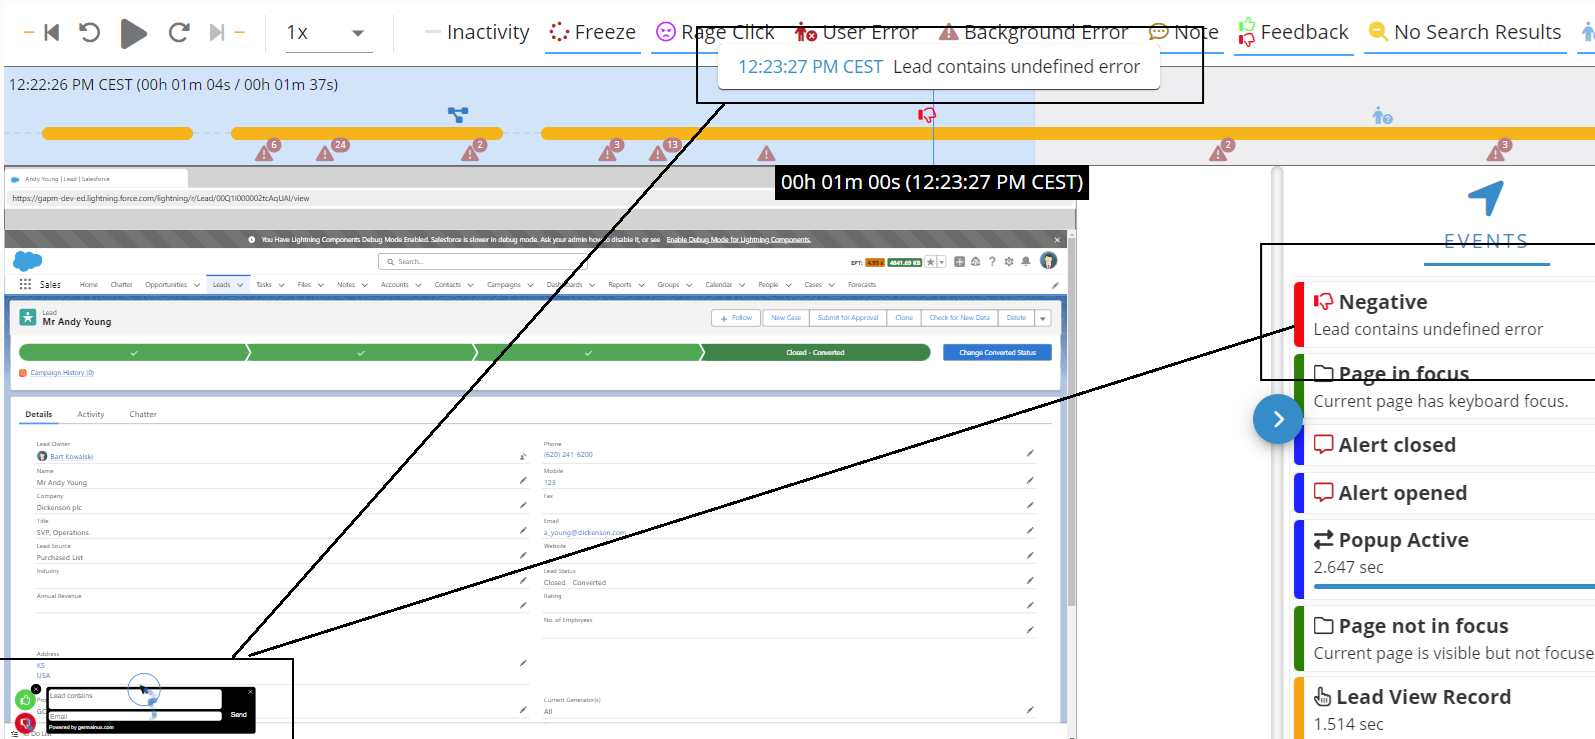
Learn more about Real User Feedback.
Search Across and Within Sessions
Captured metadata, events and authorized business data are searchable both across sessions and within an individual replay.
Teams can search for:
-
Users, sessions and application versions
-
Error messages and user-visible text
-
Page, screen and workflow events
-
Products, orders, cases or other business identifiers
-
Clicks, searches and selections
-
Feedback and outcome data
-
Technical events and performance conditions
When a match is found, GermainUX highlights the relevant part of the session so investigators can move directly to the moment where it occurred.
Search Across Sessions
Cross-session search identifies every matching session within the selected scope. This makes it possible to quantify impact before replaying individual examples.
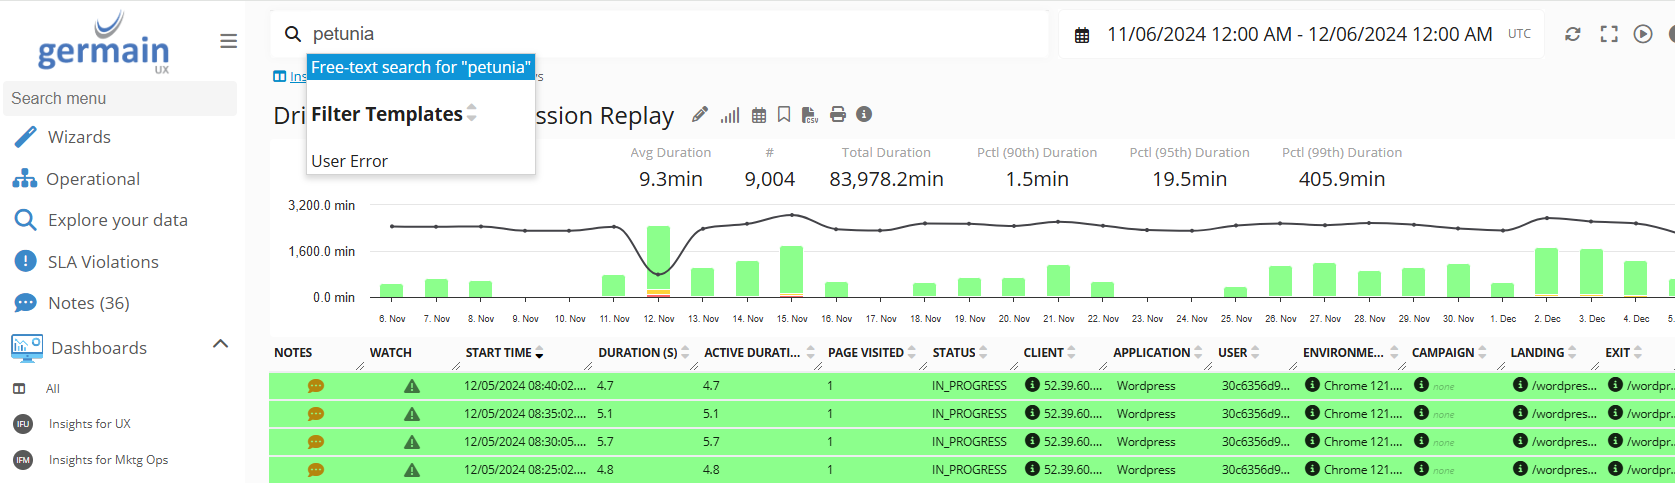
For frequent or business-critical searches, teams can create:
-
Saved filters
-
Custom tabs
-
Preconfigured or custom KPIs
-
Automated alerts and reports
Search Within a Session
Search can continue recursively from dashboards into a specific replay while retaining the investigation context and highlights. This helps teams locate a message, event or data value without manually scanning the complete timeline.
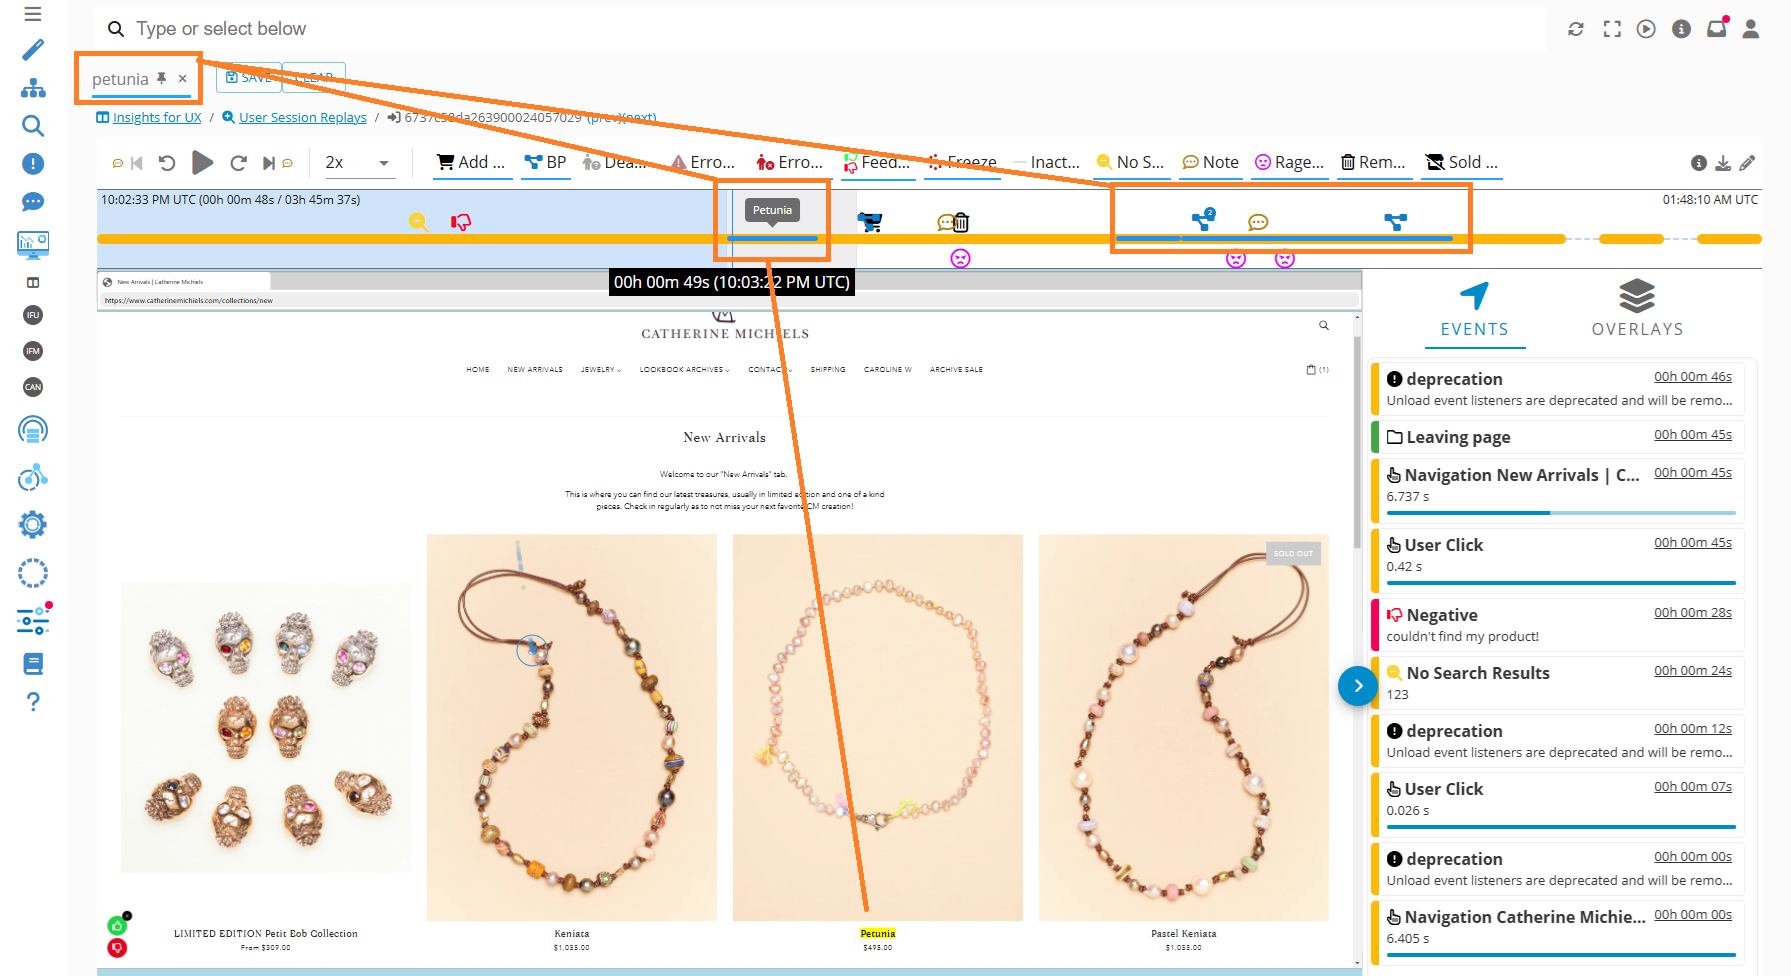
Session Replay Workspace
The GermainUX Session Replay Workspace brings playback, behavioral insights and technical evidence into one investigation.
|
Workspace area |
Purpose |
|
Replay controls |
Play, pause, change playback speed and navigate the session |
|
Events and insights |
Review user activity, detected friction, AI findings and heatmaps |
|
Search and custom tabs |
Find specific events and surface use-case-specific evidence |
|
Developer tools |
Inspect console events, session metadata, network activity and the event timeline |
Developer Tools
Developer-oriented evidence can include:
-
Console: JavaScript errors, warnings and logs
-
Info: Session, user, browser, application and environment metadata
-
Network: HTTP requests and responses associated with the session
-
Timeline: Chronological user, business and technology events
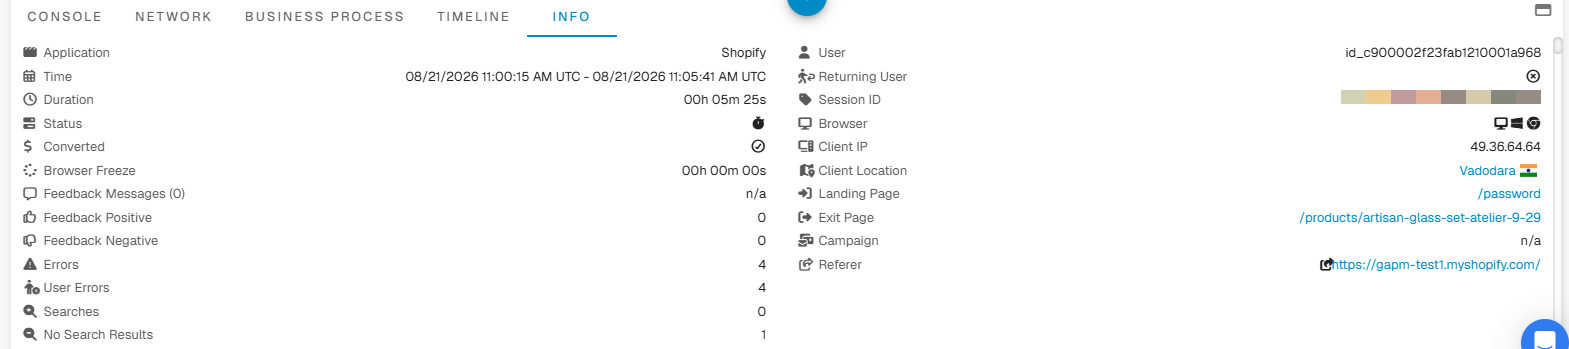
Info Tab on the Session Replay Player Console - GermainUX
This helps UX, product, support and engineering teams investigate the same issue from their respective perspectives without losing the shared context.
Business Impact at Scale
GermainUX connects individual replays with analytics across the monitored population.
The platform can quantify:
-
Users and sessions affected
-
Frequency and trend of the issue
-
Conversion and abandonment impact
-
Lost productivity and time wasted
-
Applications, pages, products or workflows affected
-
Errors and performance conditions correlated with the issue
-
Differences across user and technology segments
Aggregate, Pivot, Drill-through and Analysis dashboards help teams move from a business symptom to affected segments, individual instances and supporting Session Replay.
-
Aggregate, Pivot, Drill-through and Analysis Dashboards
Segmentation
Session and heatmap analysis can be segmented using captured application, user, business and technology attributes.
Examples include:
|
Segment category |
Examples |
|
Behavior |
Usage frequency, new versus returning user and observed activity |
|
Journey |
Awareness, consideration, decision and post-purchase stages |
|
Organization |
Role, team, department or another authorized user attribute |
|
Engagement |
Pages visited, active time and application usage pattern |
|
Geography |
Country, region and city, when configured and permitted |
|
Technology |
Device, operating system, browser and application version |
|
Transaction |
Purchase history, order value, payment method and purchase frequency |
|
Custom business context |
Product, service, case, account, workflow or organization-specific attributes |
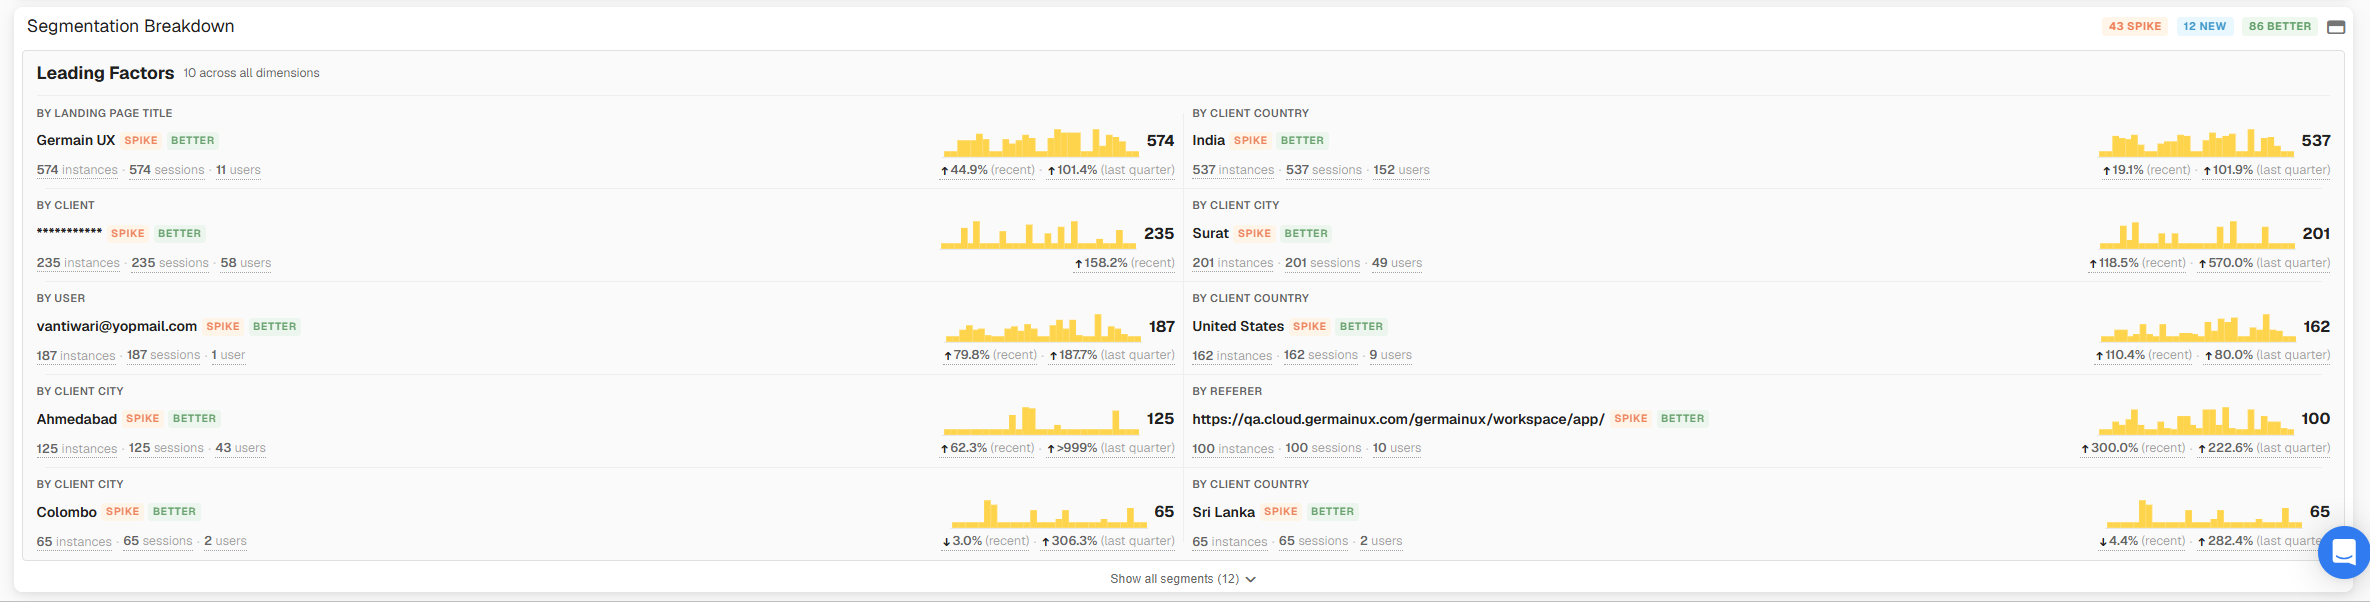
Segment availability depends on the data collected, application configuration and applicable privacy requirements.
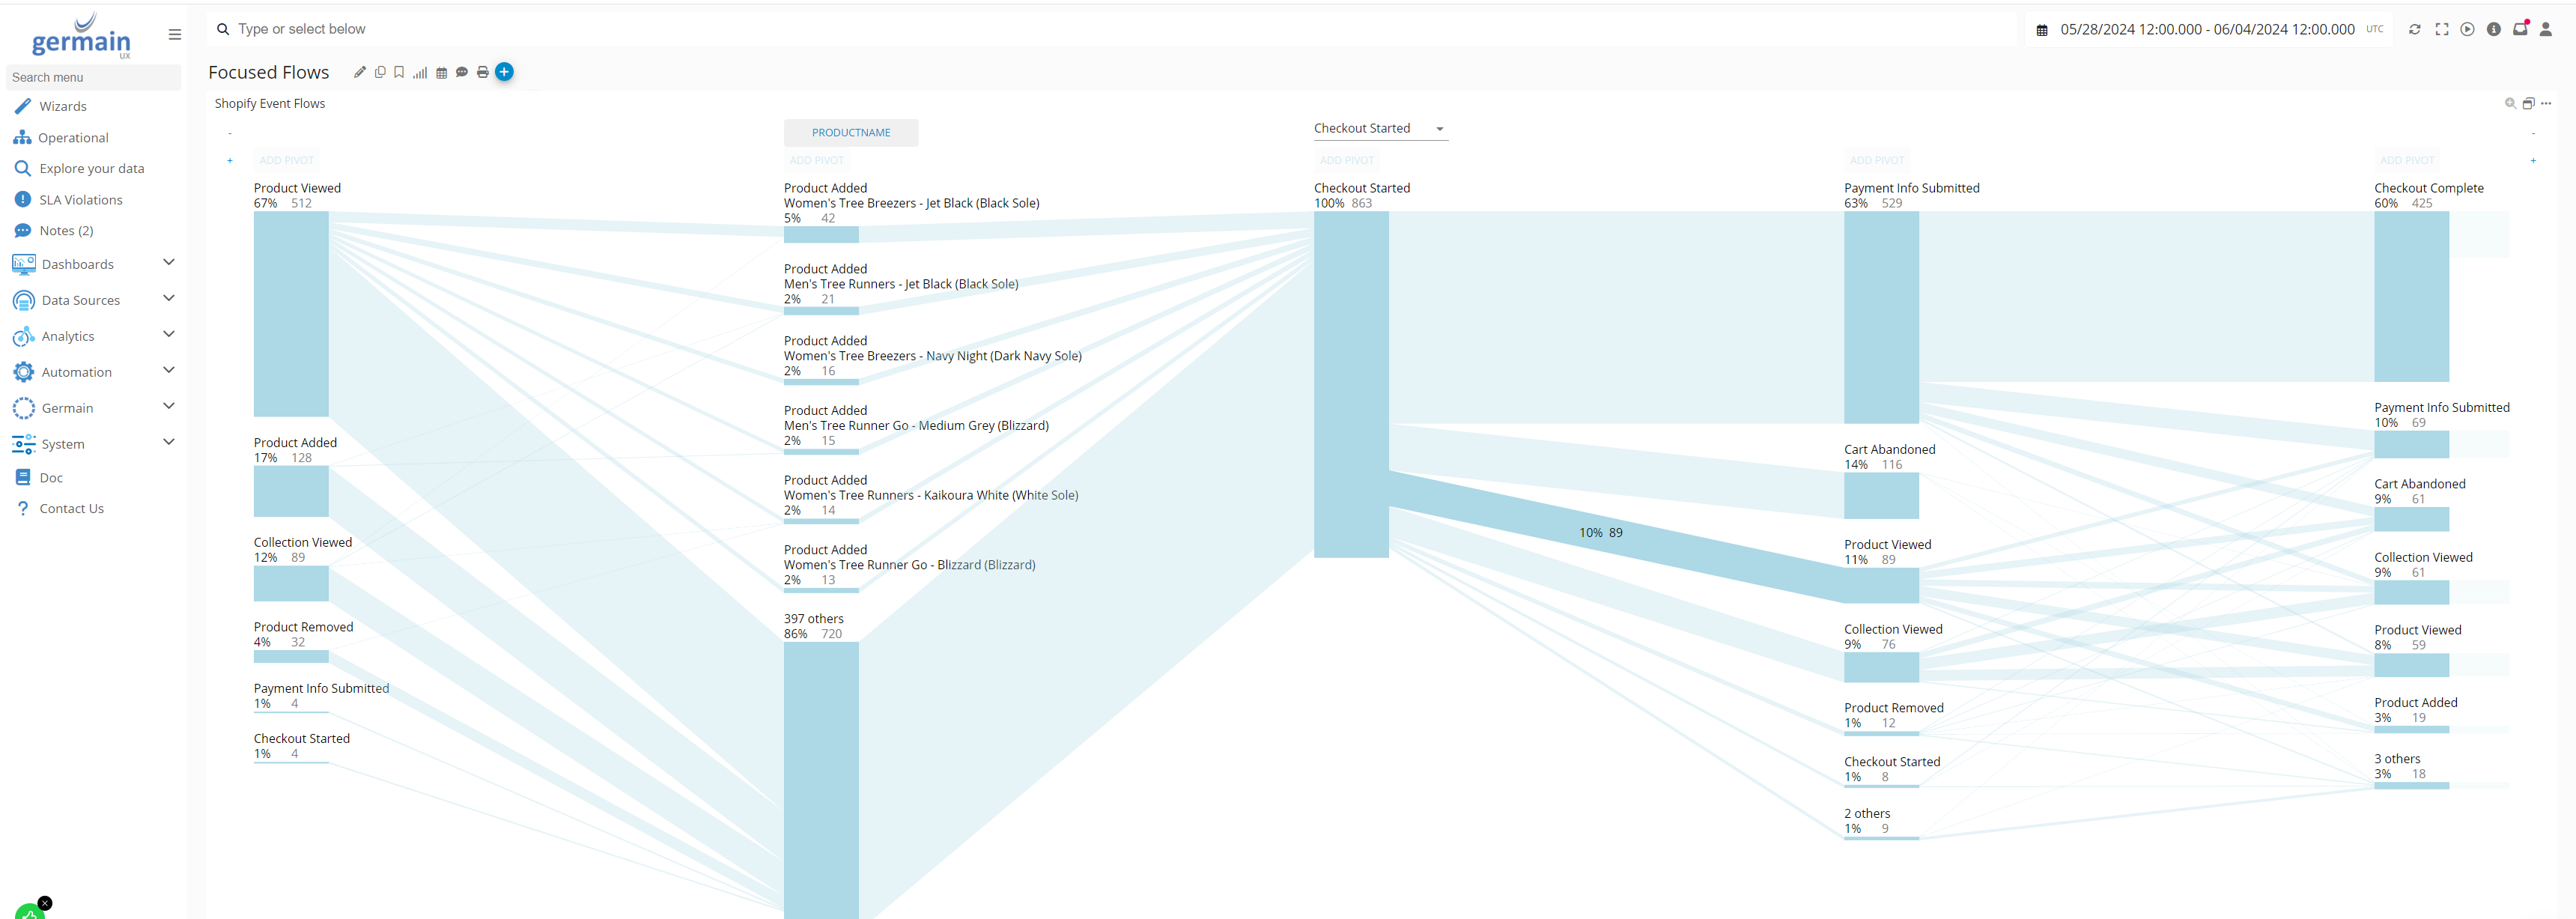
Review the preconfigured segmentation KPIs.
Collaboration and Resolution
Teams can add notes to replays, share observations and assign follow-up work. This turns Session Replay from passive evidence into part of the investigation and resolution workflow.
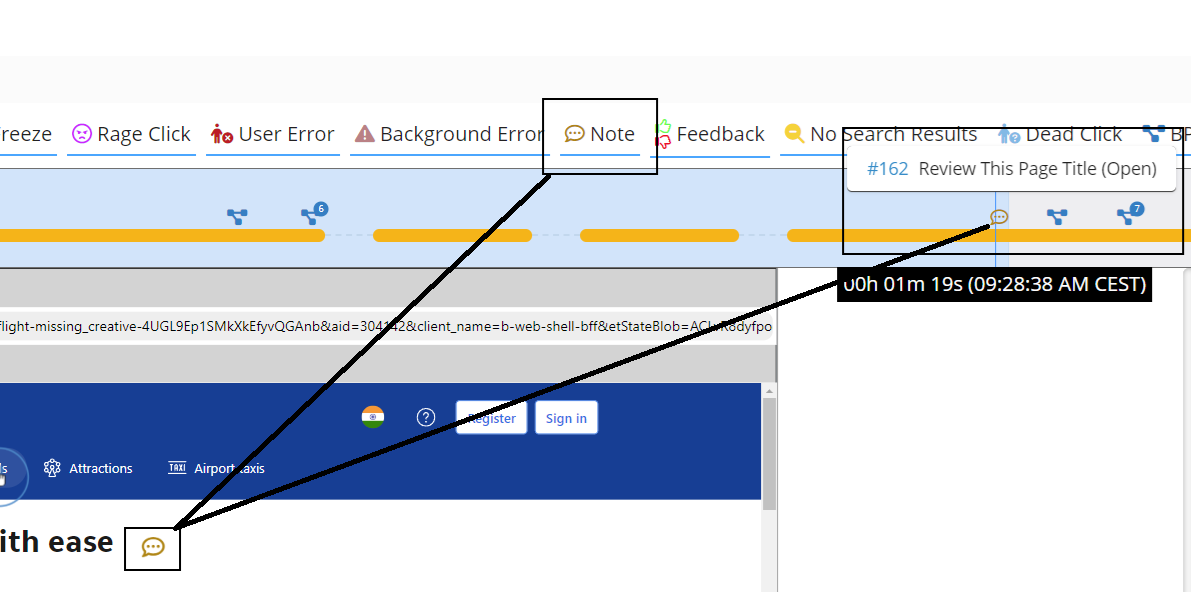
Learn more about Notes and collaboration.
GermainUX can also use detected conditions to trigger alerts, reports or approved automated workflows.
KPIs, Measures and Customization
The source page identifies approximately:20217
-
20 preconfigured KPIs
-
140 measures
-
50 pivots
For more details on any KPIs.
AI KPIs
When AI analysis is enabled for recorded user sessions, GermainUX can generate:
-
AI Session Analysis - AI-generated analysis of a real user session.
-
AI Session Friction - Friction detected by AI within a real user session.
-
AI Session Recommendation - Recommendations generated by AI from a collection of user sessions.
For more details on AI KPIs.
The available set can vary by GermainUX version, application and deployed components. Organizations can also create custom KPIs, measures, pivots, tabs, filters and insights for their specific business and technical requirements.
-
KPIs related to User Monitoring and Session Replay
Security and Privacy
Session Replay can contain sensitive user and business information. GermainUX provides controls to help organizations collect only authorized data and protect it according to applicable requirements such as GDPR and PCI DSS.
Depending on the deployment, controls can include:
-
Masking or excluding sensitive fields and content
-
Anonymizing user or business identifiers
-
Restricting access by role and responsibility
-
Applying retention and deletion policies
-
Respecting configured consent requirements
-
Limiting recording to authorized applications and browser contexts
Keystrokes and text input should be captured only where permitted and should be masked or excluded wherever sensitive information may be entered.
Deployment and Application Coverage
Browser-based Session Replay can use:
-
GermainUX RUM JS for browser applications where the monitoring script can be deployed
-
GermainUX RUM Extension for applications requiring browser-level deployment or root-page access
-
GermainUX RUM Windows for Windows applications where the monitoring agent can be deployed
The precise capabilities available depend on the application architecture, browser security model, deployed component, configured privacy controls and data sources.
GermainUX also provides native Windows Session Replay through a separate Windows monitoring approach. Heatmap availability and behavior may differ from browser-based monitoring.
📦 Additional Resources
-
Deploy User Monitoring and Session Replay
-
Configure User Monitoring and Session Replay
-
Session Replay Player
-
API of User Monitoring and Session Replay
-
AI Insights & Recommendations
-
More Analytics Features
-
More Automation Features
-
Management Features.
ℹ️ Get Help
The Germain Team can help you set this up. Contact GermainUX Support.
Component: RUM JS, RUM Extension, RUM Windows
Supported Version: 2017.1 or later