Feature
Key Performance Indicator are available out-of-the-box to monitor User Experience of Web or Native/Desktop Application. And you can create your own KPI or we can do it for you.
Video overview: https://youtu.be/BT1pTYbZdvQ
KPIs for Web User Experience
Preconfigured KPIs to monitor and analyze Real User Experience. And you can create your own KPI, or we can do it for you.
|
KPI |
UX Level |
Technology Level |
Data Model |
KPI Description |
|---|---|---|---|---|
|
AI Recommendation |
x |
|
Event from a scheduled action that automatically summarizes N recorded user sessions and provides recommendations to improve UX. This scheduled action is fully configurable (frequency, AI prompt, session selection criteria, etc.).. |
|
|
Browser Crash |
x |
x |
|
Event of a browser experiencing a Freeze or Hand that lead to a critical error (e.g. “Aw, Snap”, “This tab has crashed”). |
|
Browser Freeze (aka JavaScript Long Task) |
x |
x |
Event of a browser experiencing a JavaScript Long Task. What the Chrome Team says about Freezes: https://web.dev/long-tasks-devtools/
|
|
|
Browser Visibility |
|
x |
Event of a browser or page being active, inactive, visible, hidden. |
|
|
Dead Click |
x |
x |
Event of a dead click (page content did not change or scroll did not occur after the click). |
|
|
Error Click |
x |
x |
Event of an error click (JavaScript console error did occur after the click). |
|
|
Mouse Click |
|
x |
Event of a mouse click or user touch. |
|
|
No Search Results |
x |
|
Event of a search which gave no results. |
|
|
Phrase of Interest Appearance |
x |
x |
An appearance of text on page that matches a phrase-of-interest as configured on its corresponding UX Monitoring Profile. |
|
|
Rage Click |
x |
x |
Count of multiple consecutive clicks on the same element. |
|
|
Session Analysis |
x |
|
AI-generated summary analysis of user sessions. |
|
|
Session Friction |
x |
|
AI-generated friction from a user session. |
|
|
Session Recommendation |
x |
|
AI-generated recommendation from a collection of user sessions. |
|
|
Story Beat |
x |
x |
A short interval of UX activity, labelled to describe what the user was doing, at up to five levels of abstraction. |
|
|
User Change |
x |
|
Event of a end-user changing a value (input, select). |
|
|
User Click |
x |
|
Cumulative transaction duration of all requests and events between 2 consecutive clicks (in seconds). It will contain async and sync transactions. |
|
|
User Feedback |
x |
|
Feedback provided by a user. |
|
|
User Key Press |
x |
|
Event of key pressed by a user on a keyboard. |
|
|
User Session Replay |
x |
|
User Session Video Recording And Replay KPI. |
KPIs for Native User Experience
A number of KPIs are preconfigured in Germain and these ones are to help you analyze User Experience of Native/OS/Desktop Application.
|
KPI |
Fact Class |
Desc |
|---|---|---|
|
Native User Click |
|
A loading interval, but for non-web. i.e. 'Native' to the OS. |
|
Native Mouse Click |
|
Instantaneous user input from a physical mouse button or touch screen, but for non-web. i.e. 'Native' to the OS. |
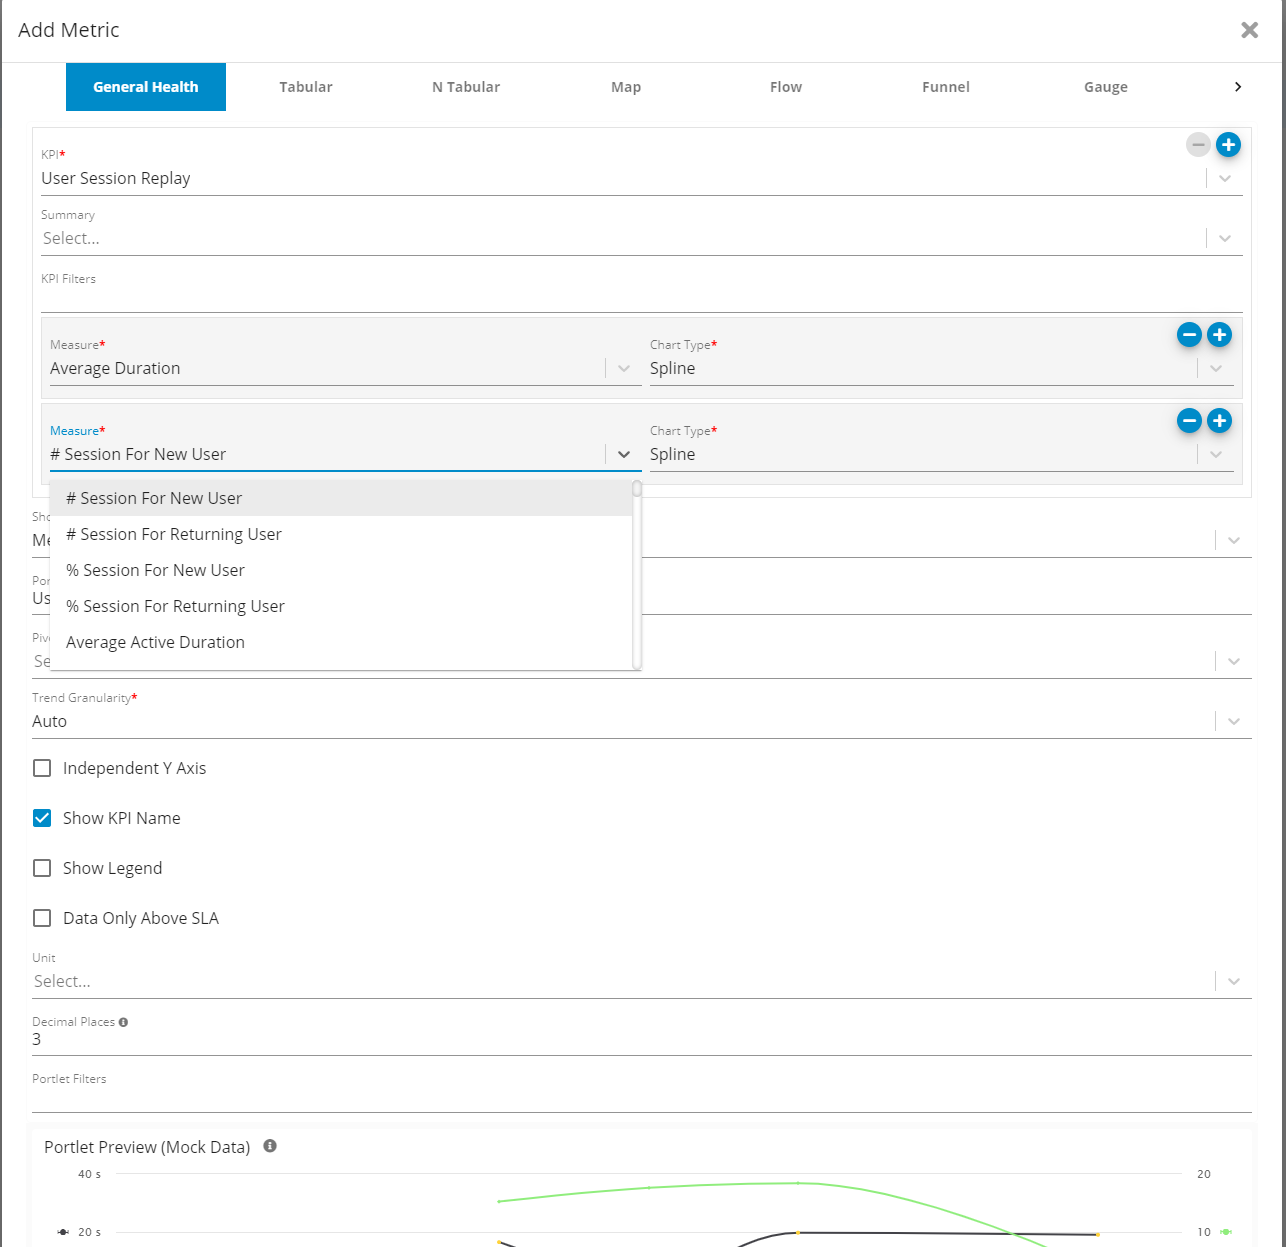
Measures
Metrics provide more insights, and are automatically computed by Germain UX to help you understand the performance of the above KPIs.
|
Measure |
|---|
|
# Session For New User |
|
# Session For Returning User |
|
% Session For New User |
|
% Session For Returning User |
|
Average Active Duration |
|
Average Color Threshold |
|
Average Duration |
|
Average Error # |
|
Average Feedback Comment # |
|
Average Inactive Duration |
|
Average Negative Feedback # |
|
Average Page Visited |
|
Average Positive Feedback # |
|
Count |
|
Count Dropoff |
|
Count Not Dropoff |
|
Count Unique Access |
|
Count Unique Application Component |
|
Count Unique Application Name |
|
Count Unique Campaign Content |
|
Count Unique Campaign Medium |
|
Count Unique Campaign Name |
|
Count Unique Campaign Source |
|
Count Unique Campaign Term |
|
Count Unique Client IP |
|
Count Unique Client Location City |
|
Count Unique Client Location Continent |
|
Count Unique Client Location Country |
|
Count Unique Client Location Region |
|
Count Unique Color |
|
Count Unique Correlation Id |
|
Count Unique Dropoff |
|
Count Unique End Time |
|
Count Unique Environment Browser |
|
Count Unique Environment Browser Family |
|
Count Unique Environment Device |
|
Count Unique Environment OS |
|
Count Unique Exit Page Path |
|
Count Unique Exit Page Query |
|
Count Unique Exit Page Title |
|
Count Unique Landing Page Path |
|
Count Unique Landing Page Query |
|
Count Unique Landing Page Title |
|
Count Unique Provenance |
|
Count Unique Ref Subtype |
|
Count Unique Ref Type |
|
Count Unique Ref Url |
|
Count Unique Returning User |
|
Count Unique Session Id |
|
Count Unique Status |
|
Count Unique System Environment |
|
Count Unique System Name |
|
Count Unique System Type |
|
Count Unique Target Environment |
|
Count Unique Target Hostname |
|
Count Unique Target Location City |
|
Count Unique Target Location Continent |
|
Count Unique Target Location Country |
|
Count Unique Target Location Region |
|
Count Unique Target Name |
|
Count Unique Target Type |
|
Count Unique User |
|
Count Unique User Department |
|
Count Unique User Group |
|
Count Unique User Location City |
|
Count Unique User Location Continent |
|
Count Unique User Location Country |
|
Count Unique User Location Region |
|
Count Unique User Role |
|
Count Unique User Type |
|
Max Active Duration |
|
Max Color Threshold |
|
Max Duration |
|
Max Error # |
|
Max Feedback Comment # |
|
Max Inactive Duration |
|
Max Negative Feedback # |
|
Max Page Visited |
|
Max Positive Feedback # |
|
Min Active Duration |
|
Min Color Threshold |
|
Min Duration |
|
Min Error # |
|
Min Feedback Comment # |
|
Min Inactive Duration |
|
Min Negative Feedback # |
|
Min Page Visited |
|
Min Positive Feedback # |
|
Percentage Dropoff |
|
Percentage Not Dropoff |
|
Percentile (50th) Active Duration |
|
Percentile (50th) Duration |
|
Percentile (50th) Error # |
|
Percentile (50th) Feedback Comment # |
|
Percentile (50th) Inactive Duration |
|
Percentile (50th) Negative Feedback # |
|
Percentile (50th) Page Visited |
|
Percentile (50th) Positive Feedback # |
|
Percentile (90th) Active Duration |
|
Percentile (90th) Duration |
|
Percentile (90th) Error # |
|
Percentile (90th) Feedback Comment # |
|
Percentile (90th) Inactive Duration |
|
Percentile (90th) Negative Feedback # |
|
Percentile (90th) Page Visited |
|
Percentile (90th) Positive Feedback # |
|
Percentile (95th) Active Duration |
|
Percentile (95th) Duration |
|
Percentile (95th) Error # |
|
Percentile (95th) Feedback Comment # |
|
Percentile (95th) Inactive Duration |
|
Percentile (95th) Negative Feedback # |
|
Percentile (95th) Page Visited |
|
Percentile (95th) Positive Feedback # |
|
Percentile (99.9th) Active Duration |
|
Percentile (99.9th) Duration |
|
Percentile (99.9th) Error # |
|
Percentile (99.9th) Feedback Comment # |
|
Percentile (99.9th) Inactive Duration |
|
Percentile (99.9th) Negative Feedback # |
|
Percentile (99.9th) Page Visited |
|
Percentile (99.9th) Positive Feedback # |
|
Percentile (99th) Active Duration |
|
Percentile (99th) Duration |
|
Percentile (99th) Error # |
|
Percentile (99th) Feedback Comment # |
|
Percentile (99th) Inactive Duration |
|
Percentile (99th) Negative Feedback # |
|
Percentile (99th) Page Visited |
|
Percentile (99th) Positive Feedback # |
|
Standard Deviation Active Duration |
|
Standard Deviation Duration |
|
Standard Deviation Error # |
|
Standard Deviation Feedback Comment # |
|
Standard Deviation Inactive Duration |
|
Standard Deviation Negative Feedback # |
|
Standard Deviation Page Visited |
|
Standard Deviation Positive Feedback # |
|
Total Active Duration |
|
Total Color Threshold |
|
Total Duration |
|
Total Error # |
|
Total Feedback Comment # |
|
Total Inactive Duration |
|
Total Negative Feedback # |
|
Total Page Visited |
|
Total Positive Feedback # |
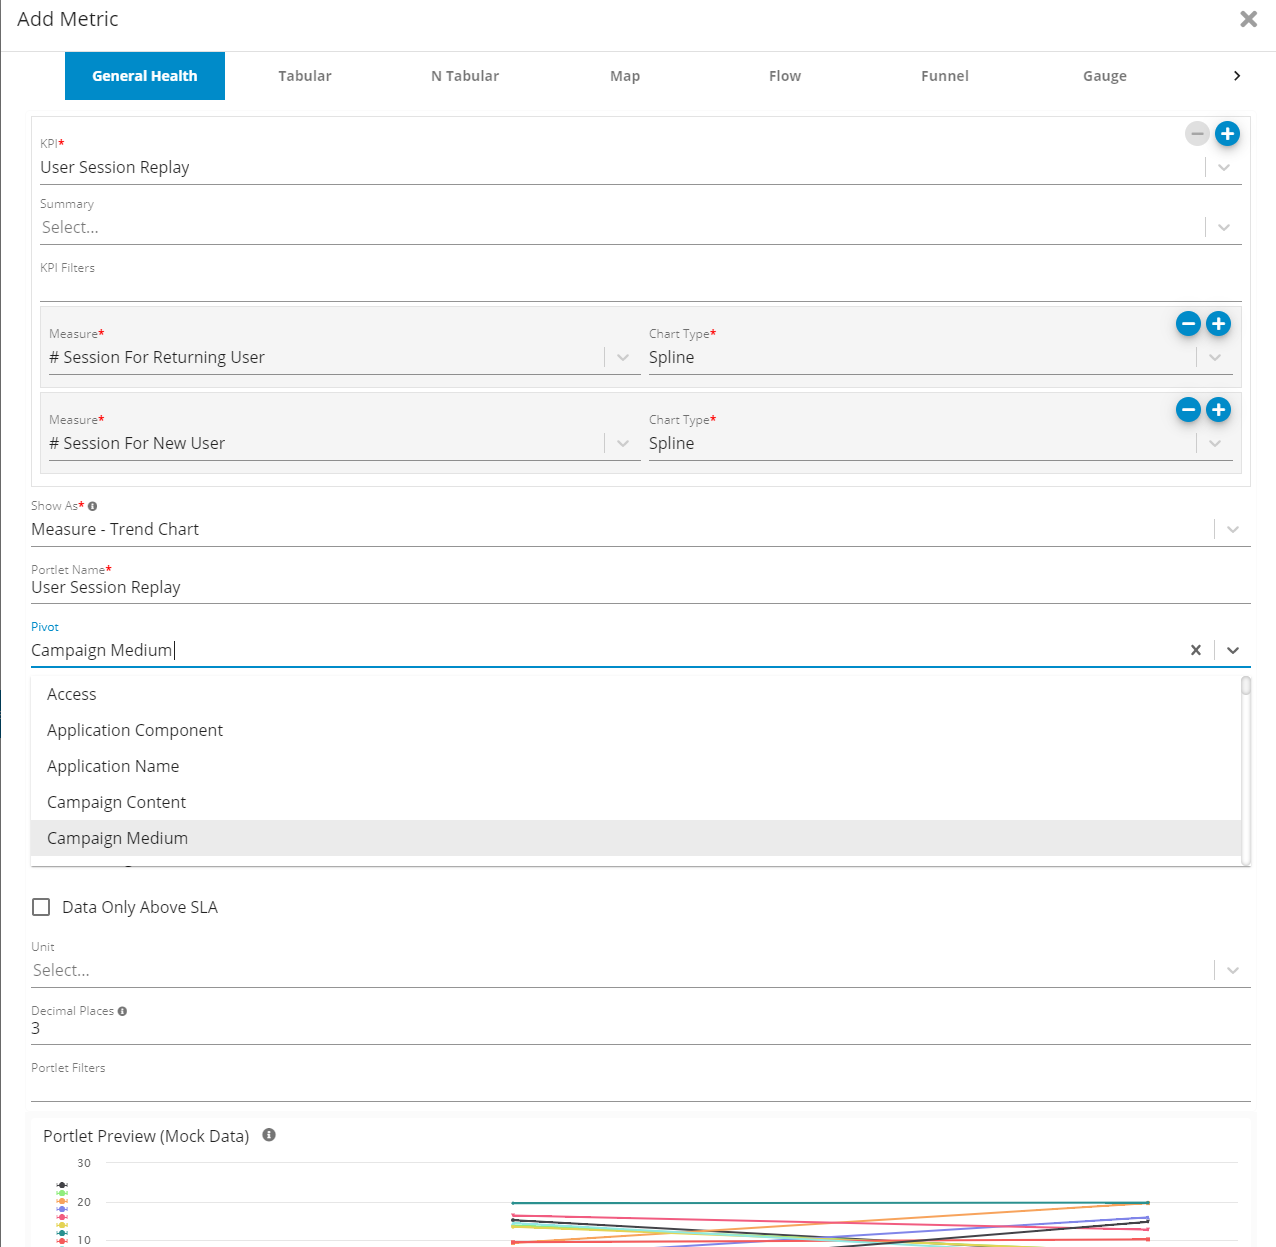
Pivots
Pivots provide more insights, and are automatically computed by Germain UX to help you understand the performance of the above KPI. Other KPIs have same/more/less pivots depending on what makes senses (we are not listing them here to make this documentation readable, but they are all available when you are editing a portlet.
|
Pivot |
|
Access |
|
Application Component |
|
Application Name |
|
Campaign Content |
|
Campaign Medium |
|
Campaign Name |
|
Campaign Source |
|
Campaign Term |
|
Client IP |
|
Client Location City |
|
Client Location Continent |
|
Client Location Country |
|
Client Location Region |
|
Color |
|
Correlation Id |
|
Dropoff |
|
End Time |
|
Environment Browser |
|
Environment Browser Family |
|
Environment Device |
|
Environment OS |
|
Exit Page Path |
|
Exit Page Query |
|
Exit Page Title |
|
Landing Page Path |
|
Landing Page Query |
|
Landing Page Title |
|
Provenance |
|
Ref Subtype |
|
Ref Type |
|
Ref Url |
|
Returning User |
|
Session Id |
|
Status |
|
System Environment |
|
System Name |
|
System Type |
|
Target Environment |
|
Target Hostname |
|
Target Location City |
|
Target Location Continent |
|
Target Location Country |
|
Target Location Region |
|
Target Name |
|
Target Type |
|
User |
|
User Department |
|
User Group |
|
User Location City |
|
User Location Continent |
|
User Location Country |
|
User Location Region |
|
User Role |
|
User Type |
Filters
Filters provide more insights, and are automatically computed by Germain UX.
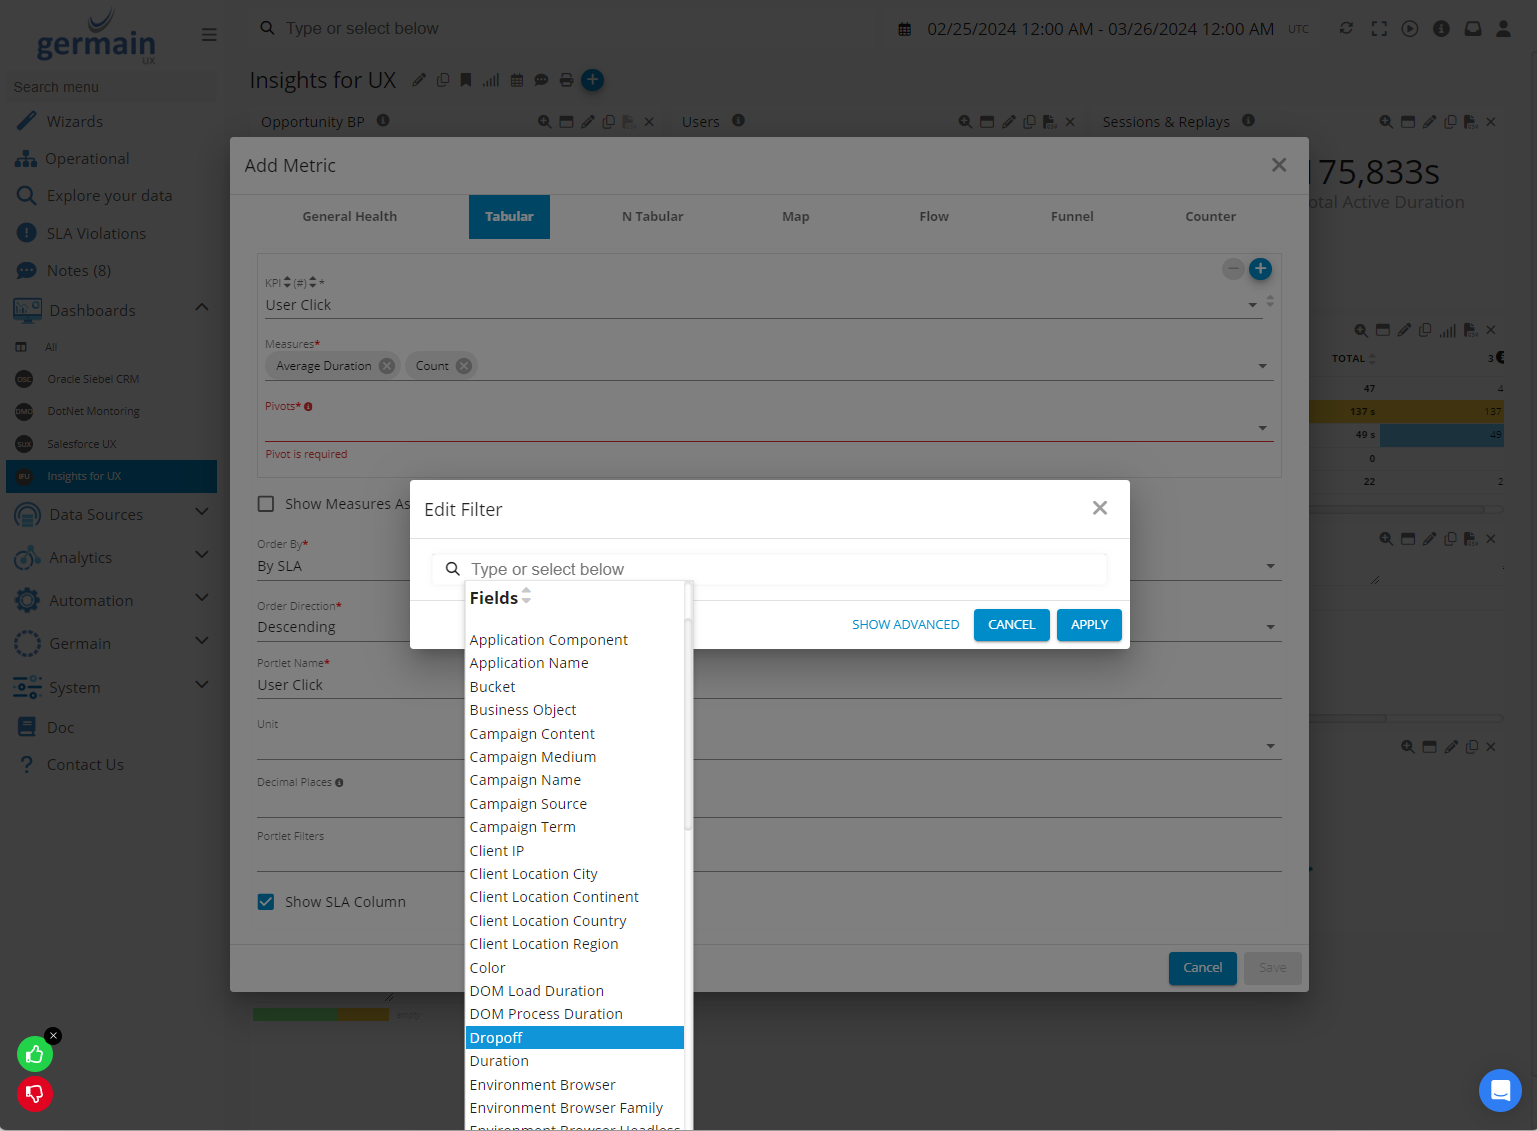
Dropoffs
One of the many KPI filters is the Dropoff filter, which can be used as following:
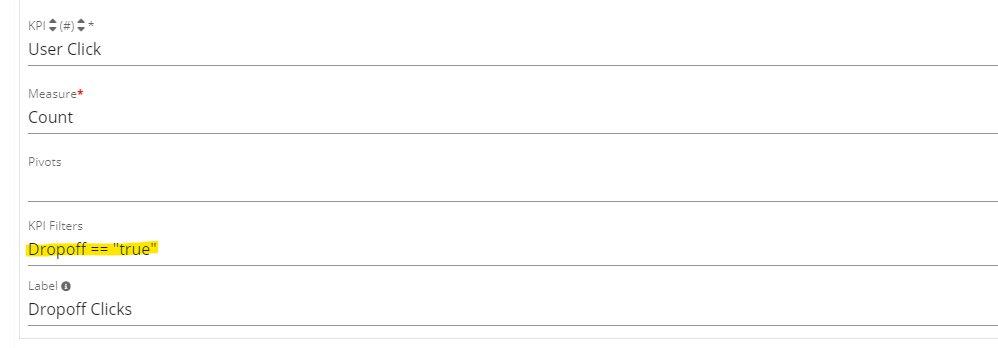
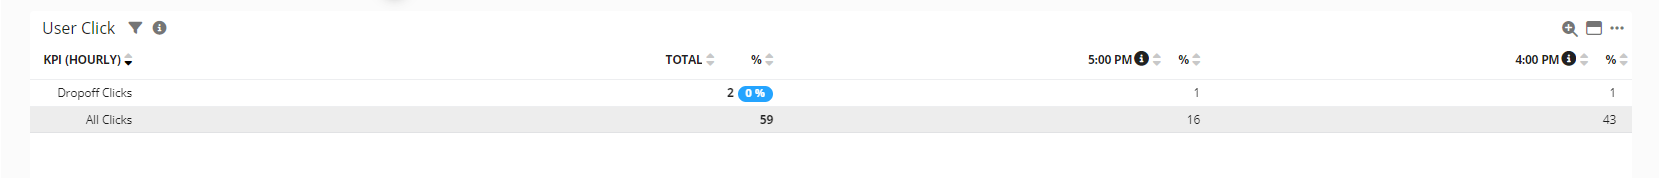
Dropoffs can be viewed on all portlets.
For instance, you can view dropoffs on Aggregate portlet to quantify issues at scale:
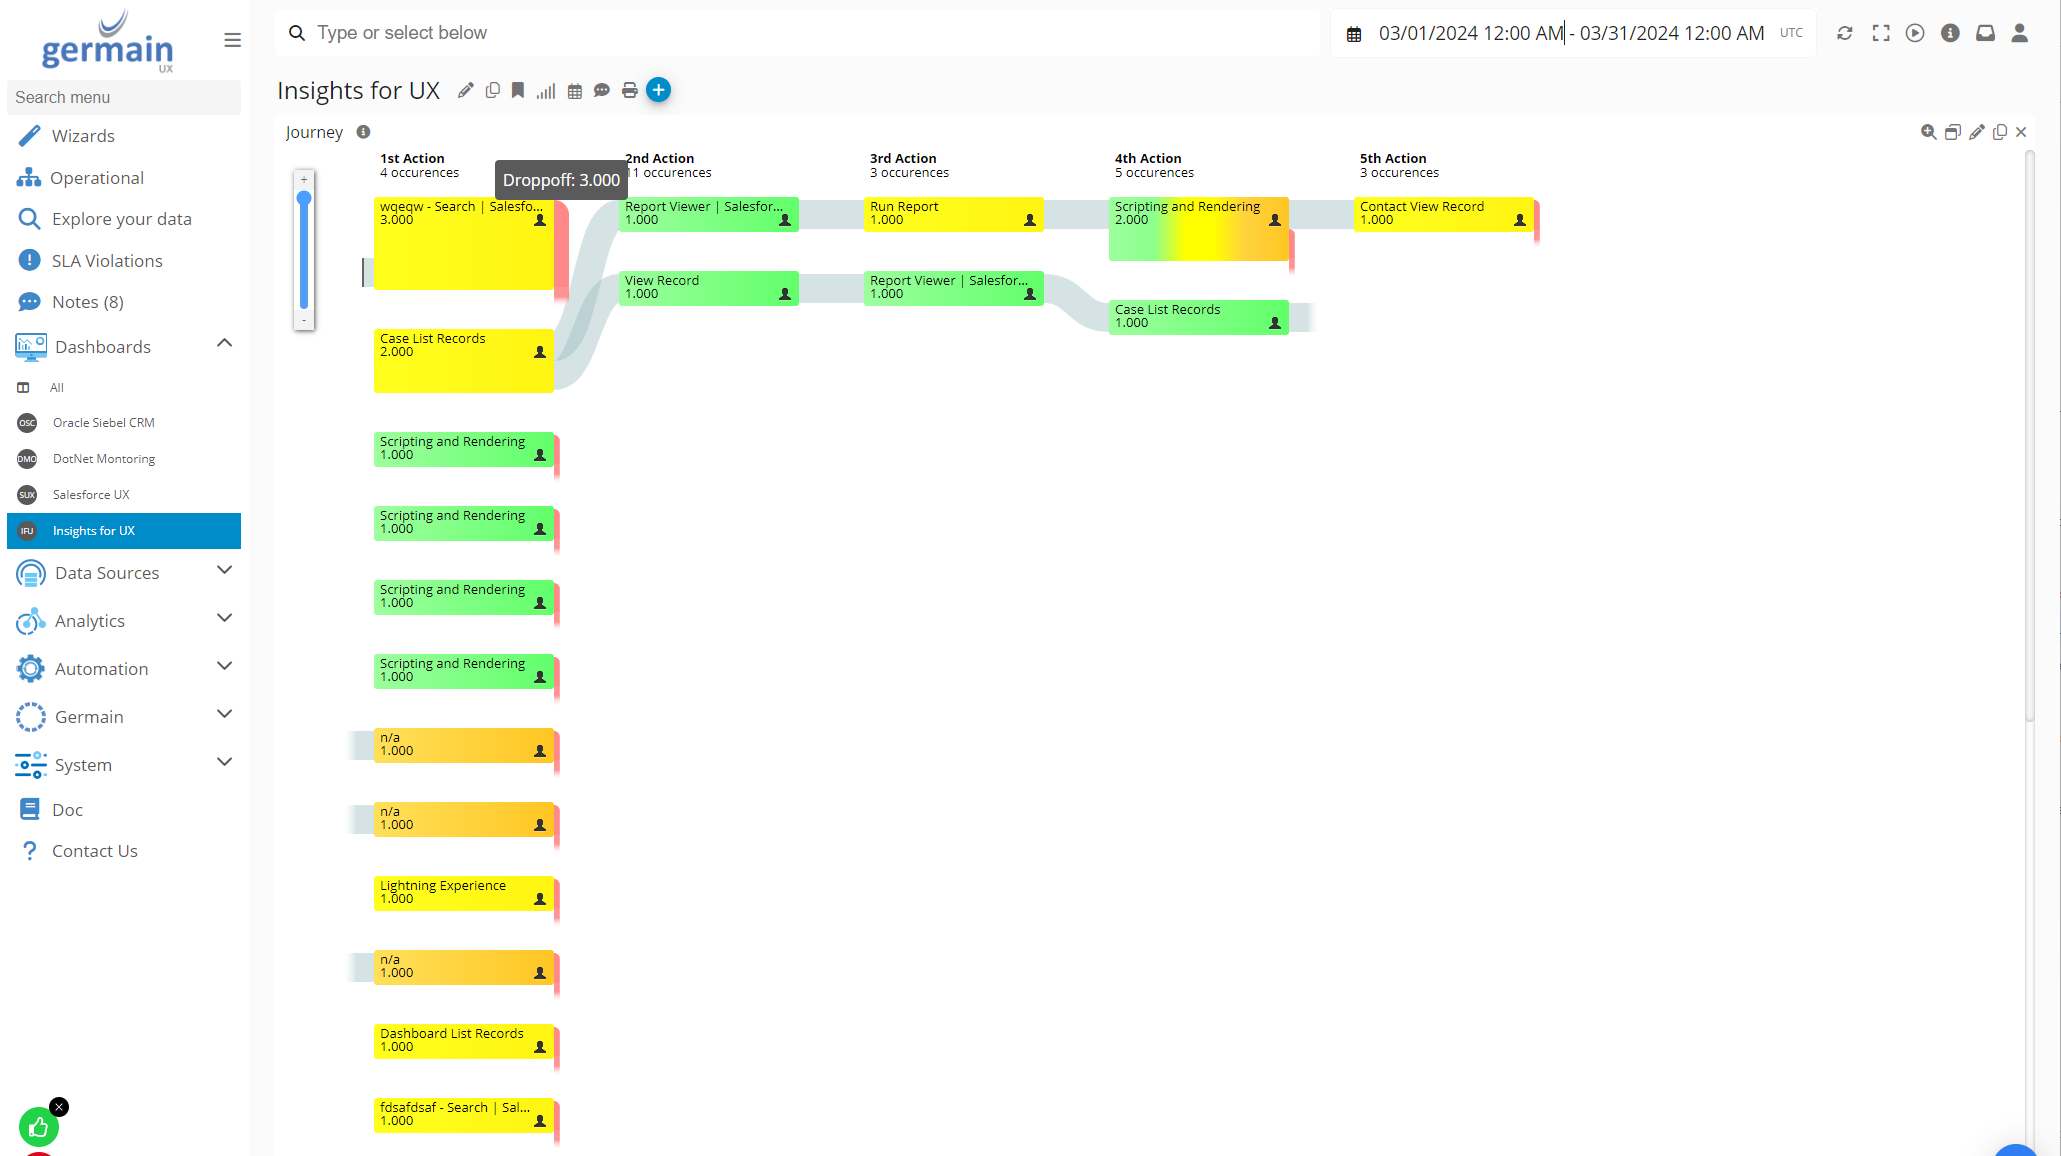
Or you can view Dropoffs on a flow graph to understand when users or processes fail to complete what they were expected to:
And from there, you can drilldown into Dropoffs and further analyze them a this Drillthrough dashboard:

And from the Drillthrough dashboard, if you are a DevOps engineer, you can drilldown into the 4th level of analysis called the RCA dashboard.
Service: Analytics
Feature Availability: 2014.1 or later