Steps on how to configure Germain UX’s code profiling & usage monitoring for .NET.
Customizing configuration settings for monitored .NET applications
You can use agent profiles to customize the monitoring of a .NET application. The default profile enables most of the available monitoring features, but depending on your application you may want to adjust individual settings.
The following shows the default profile configuration that can be found under
germain.apm.monitoringClient.dotNetMonitoringProfiles(default) via the Germain configuration console.
{
  "description": "Default configuration for Germain CLR Agent.",
  "queue": {
    "pushInterval": 30,
    "bufferSize": 1000,
    "batchSize": 100
  },
  "debug": {
    "walkSiblings": false,
    "walkTree": false,
    "dumpTree": false,
    "printCreateWinInfo": false
  },
  "globalVariables": [

  ],
  "exclusions": [

  ],
  "features": {
    "processMetrics": {
      "enabled": true,
      "interval": 60
    },
    "profiler": {
      "enabled": true,
      "interval": 1000
    },
    "http": {
      "enabled": true,
      "sslEnabled": true,
      "sslPorts": [ 443 ],
      "excludedPorts": [ 4225, 4226 ],
      "collectRequestBody": true,
      "requestBodyExclusions": "",
      "collectResponseBody": false,
      "responseBodyExclusions": ".*(css|js|png|jpg|jpeg|gif|svg|mpg)"
    },
    "keyboard": {
      "enabled": true,
      "collectPrintable": true
    },
    "mouse": {
      "enabled": true
    },
    "change": {
      "enabled": true
    },
    "tabEvents": {
      "enabled": true
    },
    "exception": {
      "enabled": true
    },
    "userClicks": {
      "enabled": true,
      "flowSteps": false,
      "typeValue": "Native:User Click",
      "selectors": {
        "Tab Navigation": {
          "prefix": "Navigate to",
          "filter": {
            "type": "tab item"
          },
          "variables": [
            {
              "name": "argument1",
              "contextScan": false,
              "filter": {
                "name": "hierarchy"
              },
              "childIndex": 0,
              "expression": "\\w+ - (\\w+)"
            }
          ]
        },
        "Button Click": {
          "prefix": "Click on",
          "filter": {
            "type": "button"
          },
          "variables": [
            {
              "name": "argument1",
              "contextScan": false,
              "filter": {
                "name": "hierarchy"
              },
              "childIndex": 0,
              "expression": "\\w+ - (\\w+)"
            }
          ]
        },
        "Menu Click": {
          "prefix": "Click on",
          "filter": {
            "type": "menu item"
          },
          "variables": [
            {
              "name": "argument1",
              "contextScan": false,
              "filter": {
                "name": "hierarchy"
              },
              "childIndex": 0,
              "expression": "\\w+ - (\\w+)"
            }
          ]
        }
      }
    }
  },
  "monitorConfig": {
    "winTitle": ""
  },
  "logging": {
    "level": "DEBUG",
    "name": "clragent",
    "path": ""
  }
}
Our support team is able to assist you in customizing the agent to your needs.
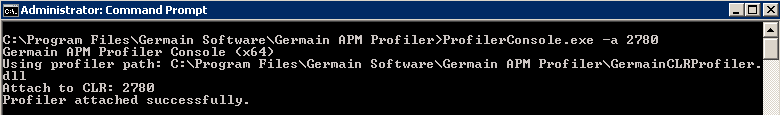
Attach Profiler to Running .NET Application
Starting with .NET4, it is possible to dynamically attach the profiler to a running CLR. To do so, run the following command with specific process ID:
Launch .NET Application with Profiler Attached
The profiler console can be used to list all currently running .NET CLRs. Please note, that the 32 and 64 bit versions of the console will only show .NET CLRs of the corresponding architecture (i.e., 64 bit console will only show 64 bit CLRs).
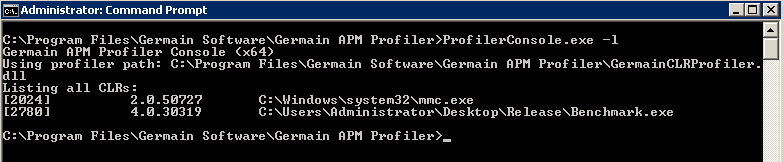
For each CLR, the console will display the process ID, CLR version, and application path. For a list of .NET runtime versions, see https://msdn.microsoft.com/en-us/library/w4atty68(v=vs.110).aspx#version .
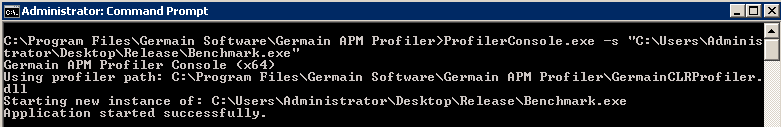
To start profiling a new .NET executable, run the following command:
Profiling to a http://ASP.NET Application
The following instructions are specific to monitoring Internet Information Services (IIS), but should be applicable to monitoring other Windows services as well.
-
Create new environment variables to enable profiling:
w3wp.exe - Germain UX -
Create an environment variable for the profiler class ID ({D768E37F-294B-43D3-9178-250C40F6F8C1}):
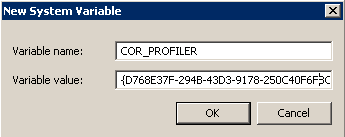
Add COR_PROFILER variable - Germain UX -
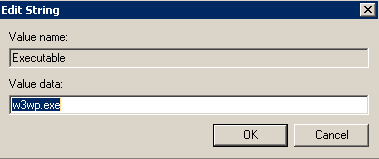
Create registry key to specify the executable to monitor under HKEY_LOCAL_MACHINE\SOFTWARE\Germain Software\Germain Profiler
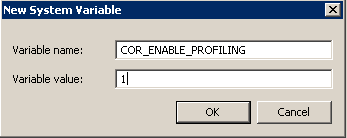
Add COR_ENABLE_PROFILING variable - Germain UX -
Restart the server to apply the environment variables. The profiler will automatically attach the next time the IIS service is started.
Component: Code Profiler
Feature Availability: 8.6.0 or later