Features
Germain Workspace serves as the primary interface for managing and accessing various features and functionalities provided by Germain. It provides a user-friendly and centralized environment where you can perform a wide range of tasks related to monitoring, configuration, and analysis.
In addition to Workspace, Germain also provides a secondary user interface called the "config console." The config console serves as a secondary access point and acts as a backdoor to access certain functionalities that may not be available directly within the Workspace interface.
While most tasks and configurations can be performed within the Workspace interface, the config console serves as a supplementary tool for more advanced scenarios or specific use cases that require direct access to underlying configurations.
Together, Workspace and the config console provide a comprehensive and flexible user interface for managing and configuring your Germain environment, ensuring that you have the necessary tools and options to effectively monitor and optimize your applications.
Workspace
Default place to go to configure anything. Within Germain Workspace, you can access different modules and tools, such as monitoring dashboards, configuration wizards, performance analysis, user experience insights, and more. It offers a comprehensive set of features to monitor and manage your applications effectively.
Overview in this video: https://youtu.be/WsTFxBDJuRQ
Analytics Management
Where to configure the “how” data gets analyzed e.g. KPI, SLA.
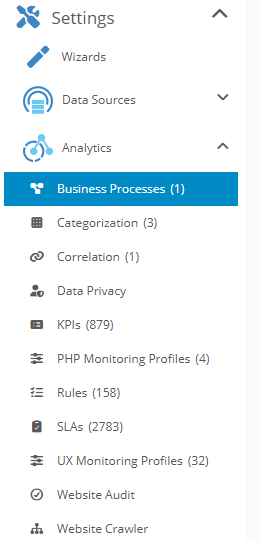
Overview in this video:https://youtu.be/f9nyMsOtCjI?si=xFD2jJgSvvj1xd9F
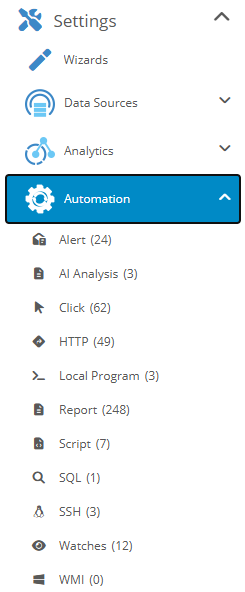
Automation Management
Where you define any automated action, email, sql, etc.
Overview in this video:https://youtu.be/cWtEheBz2LA?si=QGp3bmWq5bdX8NIl
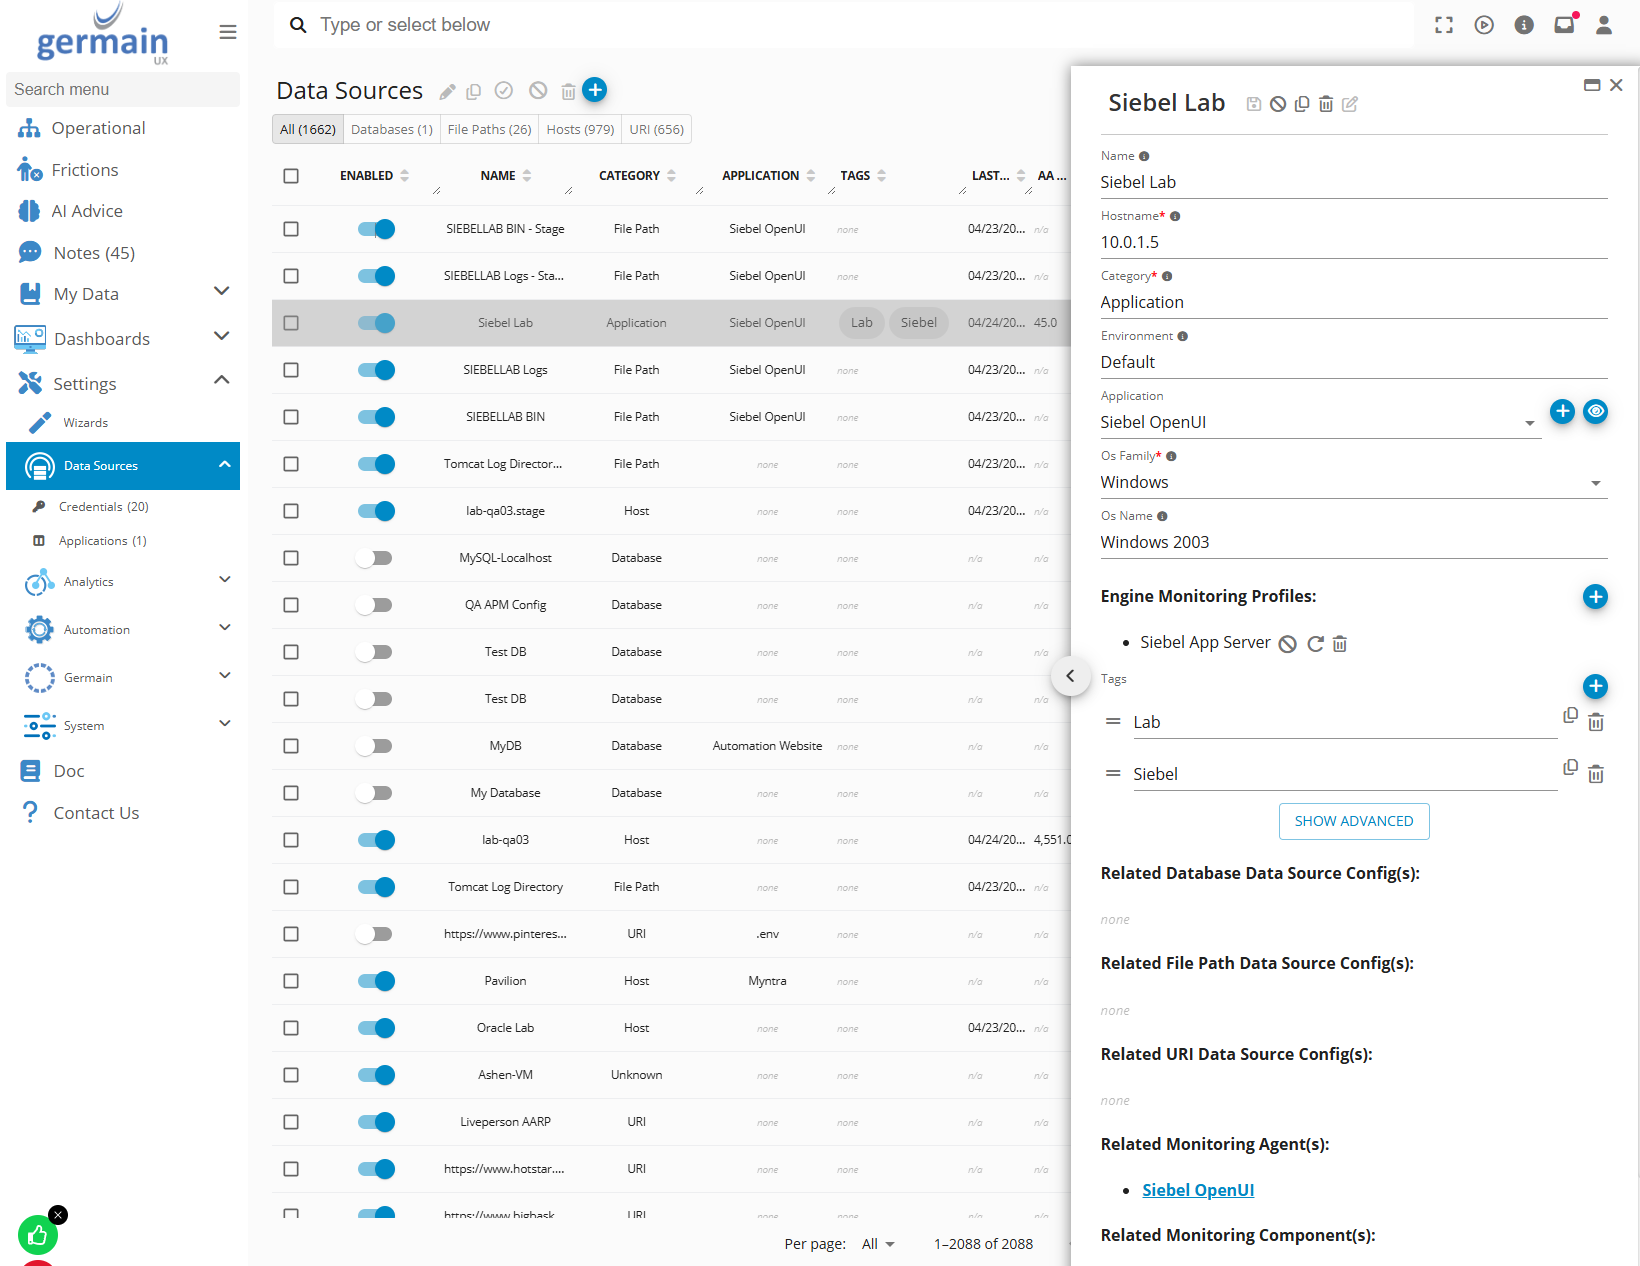
Datasource Management
The Data Source dashboard allows you to effectively manage all the data sources from which Germain UX collects data or executes transactions. A Data Source can encompass any software or hardware resource. Furthermore, the customization of Data Source categories, among other entities, is available to better align with various environments.
Overview in this video: https://youtu.be/QyZm42uL9AM?si=_xzXlAYNfQuskZYJ
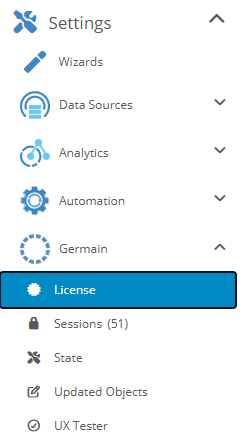
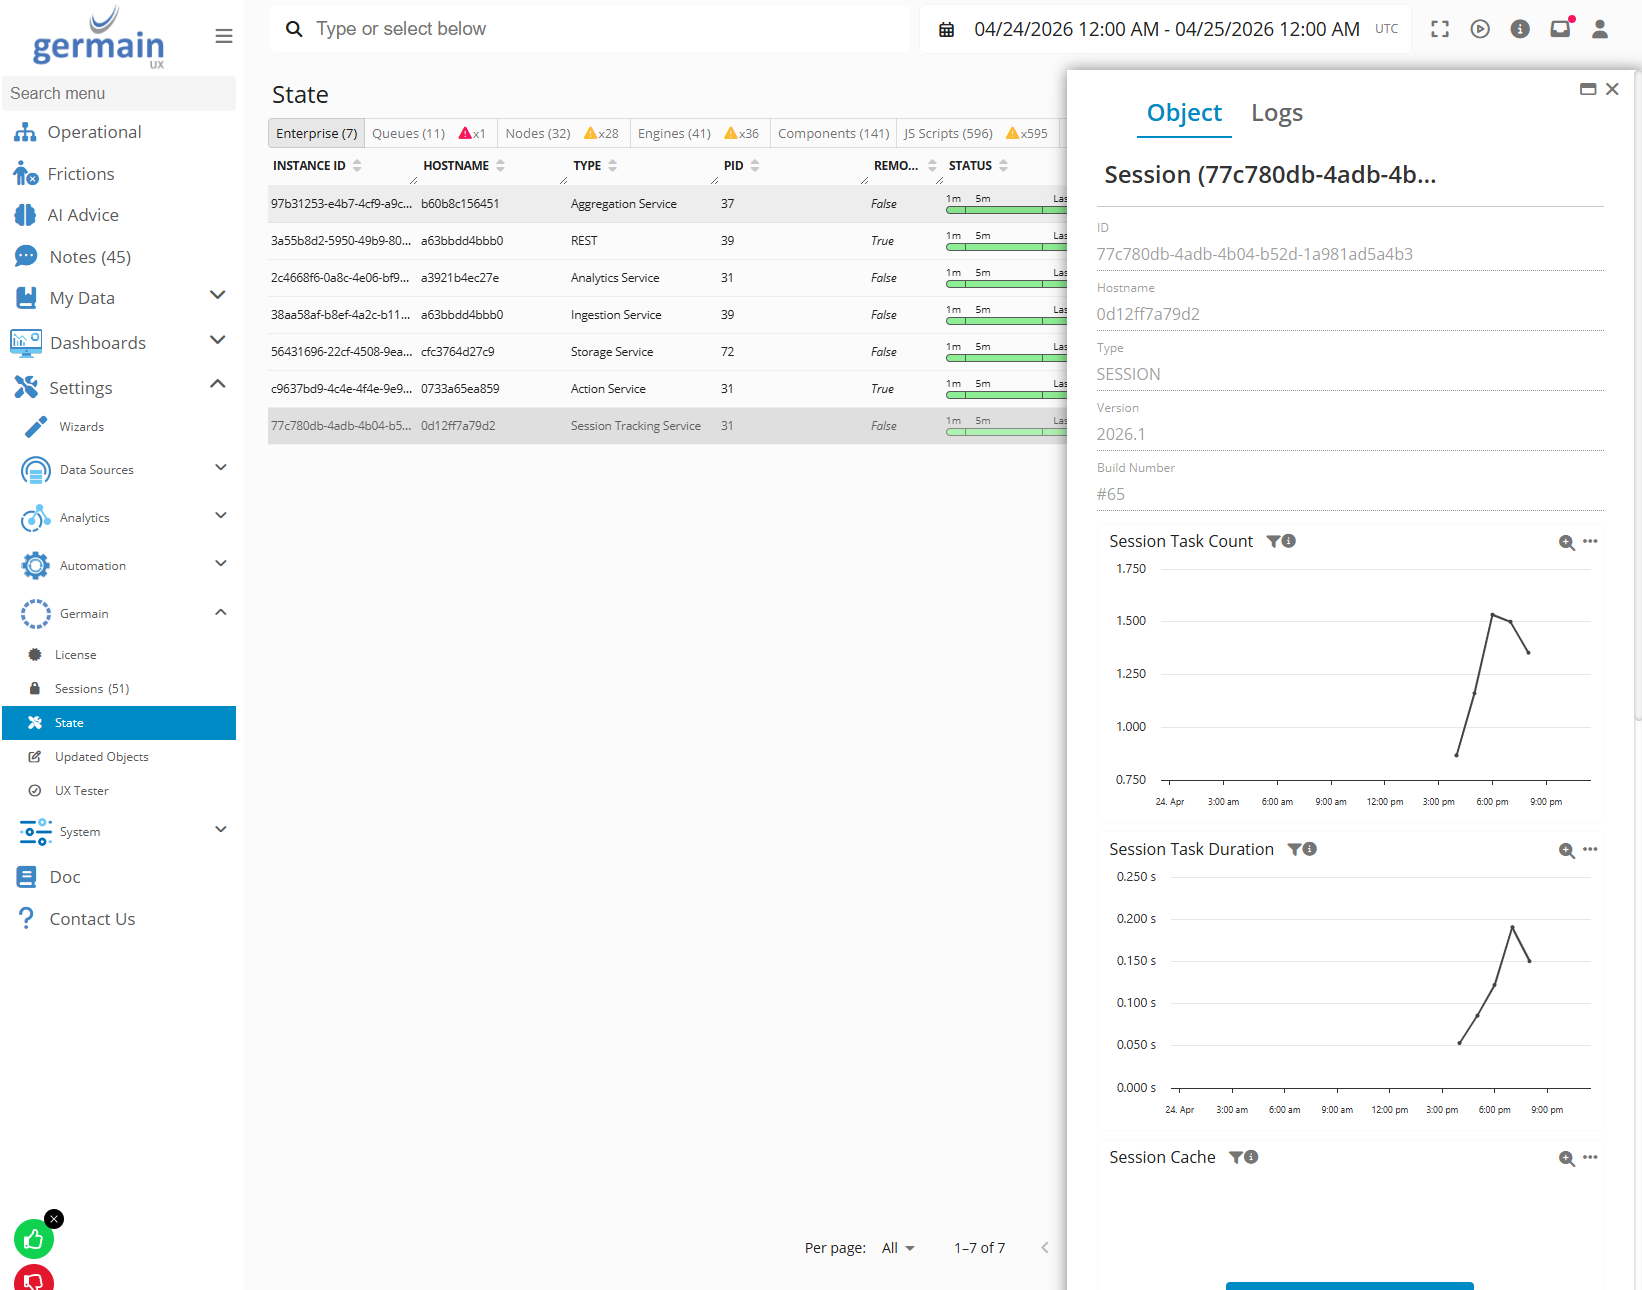
Germain
The Germain Dashboard is where you can manage the operating level and state of Germain, including the Engine, Enterprise, Nodes, Queues, and more. More details on how manage Germain health.
Overview in this video: https://youtu.be/Cj73P3dFmt4?si=Fj7hbjkDny-5zgiC
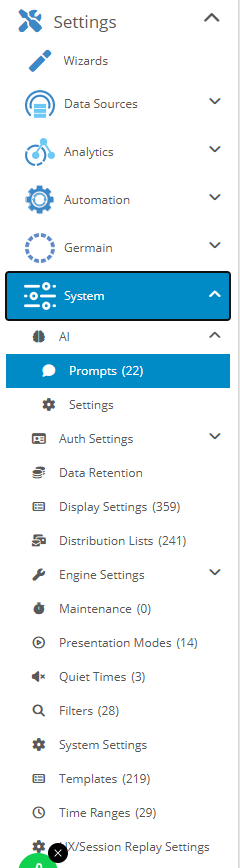
System Management
Any other settings or configuration, including: User Management.
Overview in this video: https://youtu.be/olr0QWPL184?si=EPY1eUXgXqphpul4
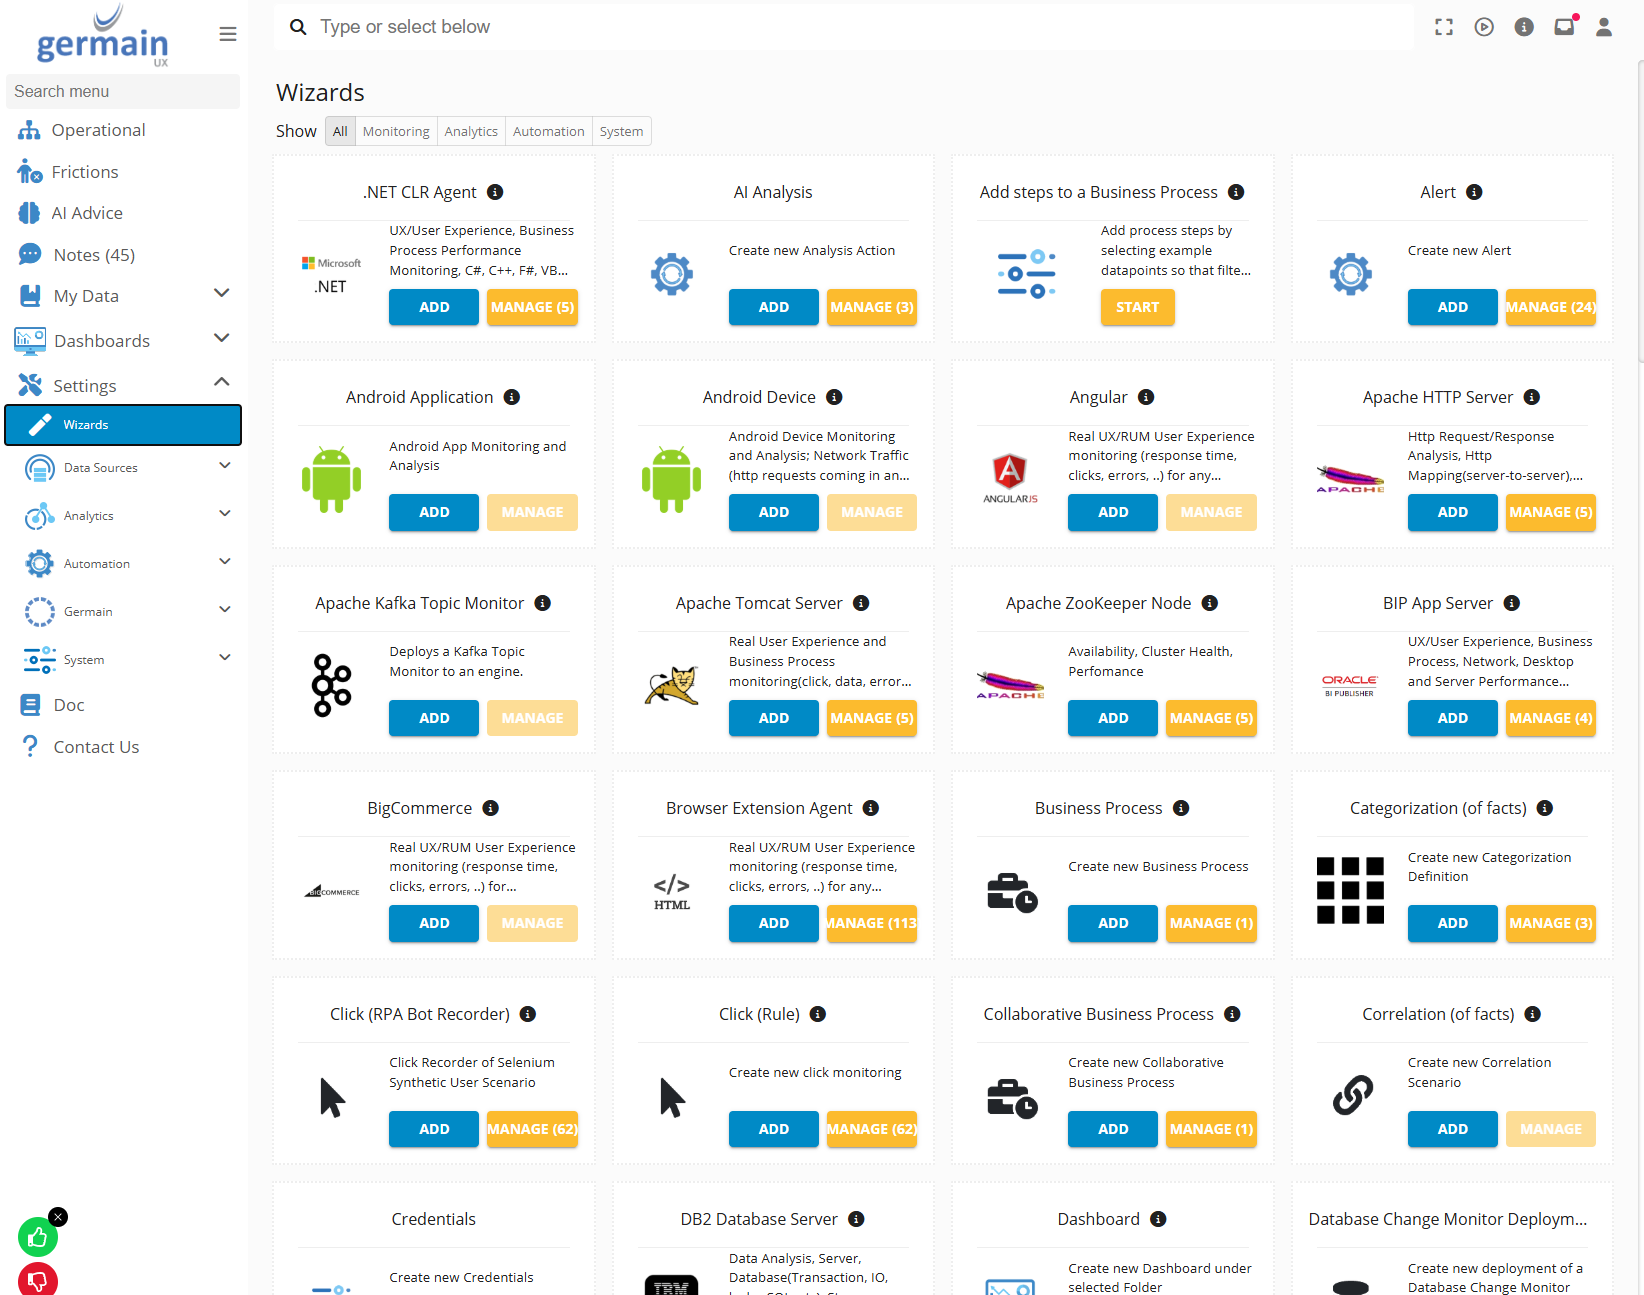
Wizards
Preconfigured or Custom Wizards to help configure any Monitoring, Analytics, Automation.
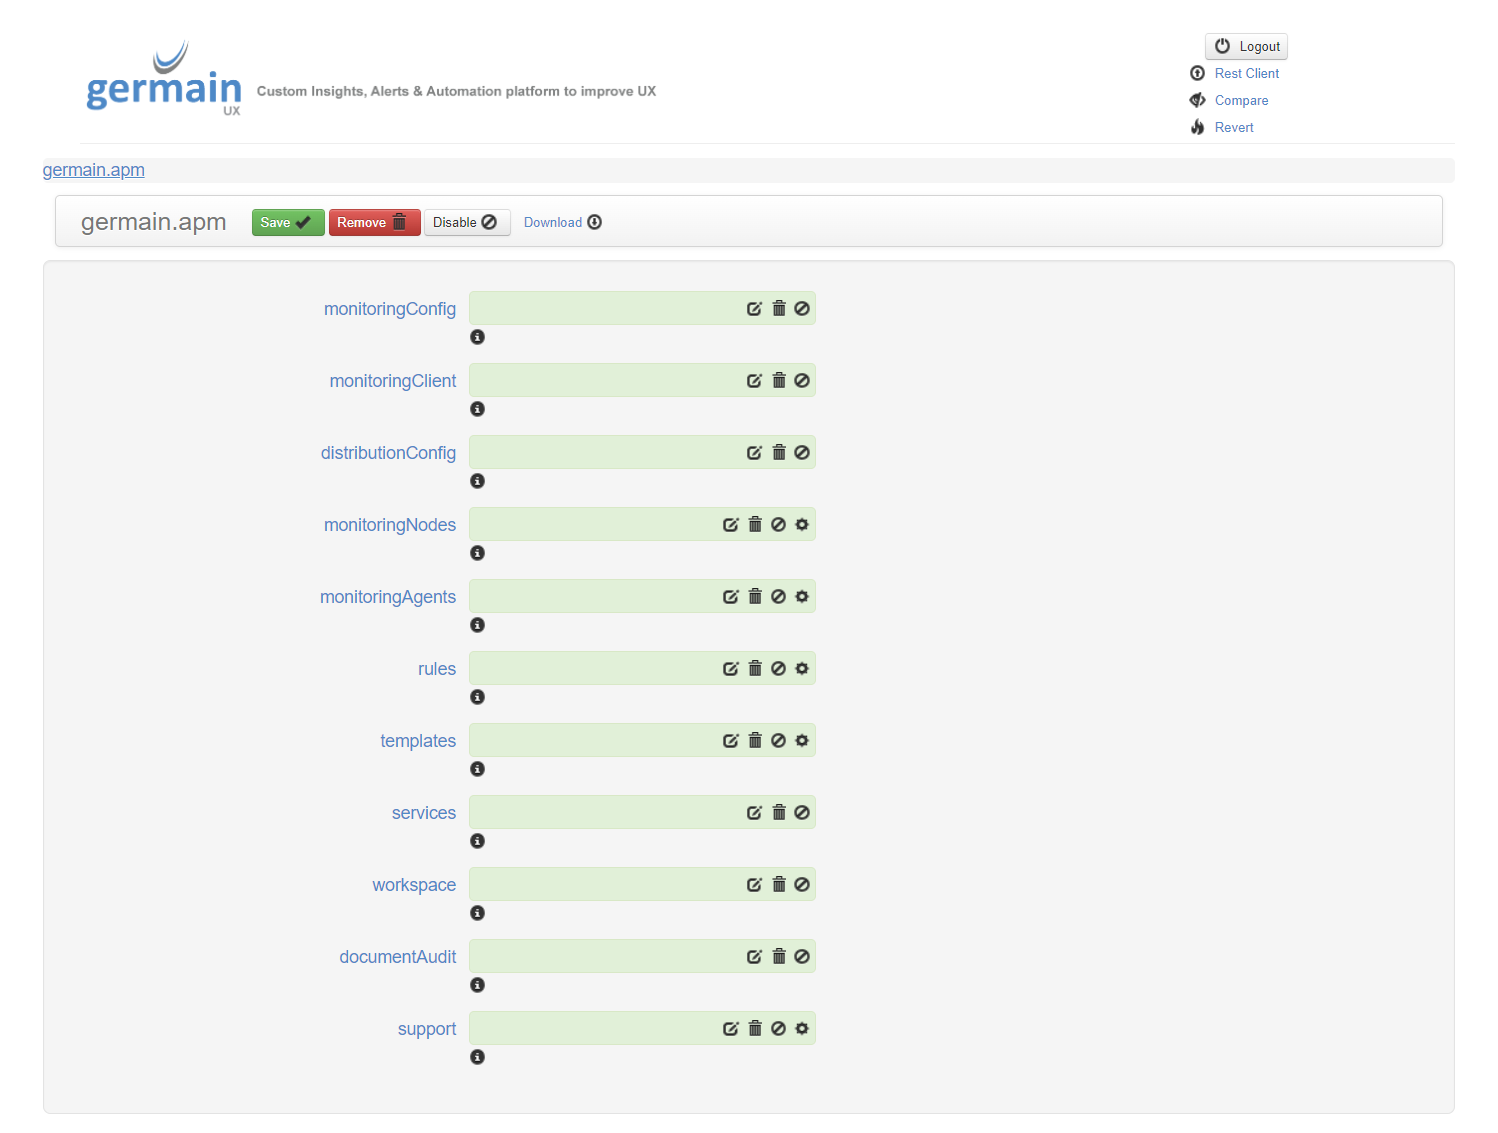
Config Console (“back door”)
The config console allows you to perform advanced configuration tasks, access additional settings and options, and make specific adjustments that may not be available or visible in the main Workspace interface. It provides a more technical and in-depth approach to configuration and management, giving you finer control over specific aspects of your monitoring setup.
Log on to Config Console
https://INSTANCE_NAME/germainapm/console
(From Workspace): Left Menu > System > System Settings
Request Access
Please ask your Germain Administrators. It is recommended not to give your regular users access to the Config Console.
Users
Administrators: to Enable or add any Alert, Insights, Automation, Dashboard, Report, (...). whenever that cannot be done via Workspace
Example
Feature Availability: 8.6.0 or later