
⚙️ Configure Apex Exception Monitoring for Salesforce
GermainUX detects, categorizes, and analyzes exceptions generated by Salesforce Apex code.
💡 Apex Exception Monitoring helps teams:
-
Identify unexpected Apex exceptions
-
Measure their frequency and business impact
-
Rank exceptions by affected users, transactions, or workflows
-
Distinguish recurring issues from isolated failures
-
Analyze trends by class, trigger, exception type, or Salesforce environment
-
Correlate exceptions with debug logs and related Salesforce telemetry
-
Connect technical failures to affected user sessions and Session Replay
-
Trigger alerts or automated actions when critical exceptions occur
📑 Prerequisites
Before configuring Apex Exception Monitoring, confirm that:
-
A GermainUX Engine is deployed and running.
-
Salesforce monitoring has been configured through the Salesforce Application wizard.
-
The Salesforce OAuth connection is active.
-
The integration user can access the Salesforce data source used for exception collection.
-
The required Salesforce log or event monitoring is enabled.
-
The selected GermainUX Engine can reach Salesforce APIs.
-
Salesforce exceptions are available through the configured source.
For the initial integration, see Deploy GermainUX for Salesforce.
🛠️ How Exception Monitoring Works
GermainUX collects Apex exception evidence from the Salesforce monitoring sources enabled for the organization.
Depending on the Salesforce features, permissions, and GermainUX configuration, this evidence may originate from:
-
Salesforce debug logs
-
Salesforce event monitoring
-
Salesforce log monitoring
-
Apex execution telemetry
-
API or integration errors
-
Other configured Salesforce monitoring sources
GermainUX then normalizes and categorizes the exception data so that related occurrences can be analyzed together.
🗄️ Configure the Required Salesforce Data Source
Apex Exception Monitoring requires a Salesforce source that contains exception information.
Configure one or more of the following as applicable:
|
Source |
Use |
|---|---|
|
Salesforce Debug Logs |
Detailed Apex execution, exceptions, stack traces, SOQL, DML, triggers, and governor-limit activity |
|
Salesforce Log Monitoring |
Broader collection and analysis of available Salesforce log records |
|
Real-Time Event Monitoring |
Timely collection of supported Salesforce events |
|
Error Monitoring |
Detection and analysis of Salesforce errors from multiple sources |
|
User Monitoring and Session Replay |
Correlation of technical exceptions with the affected user experience |
Related guides:
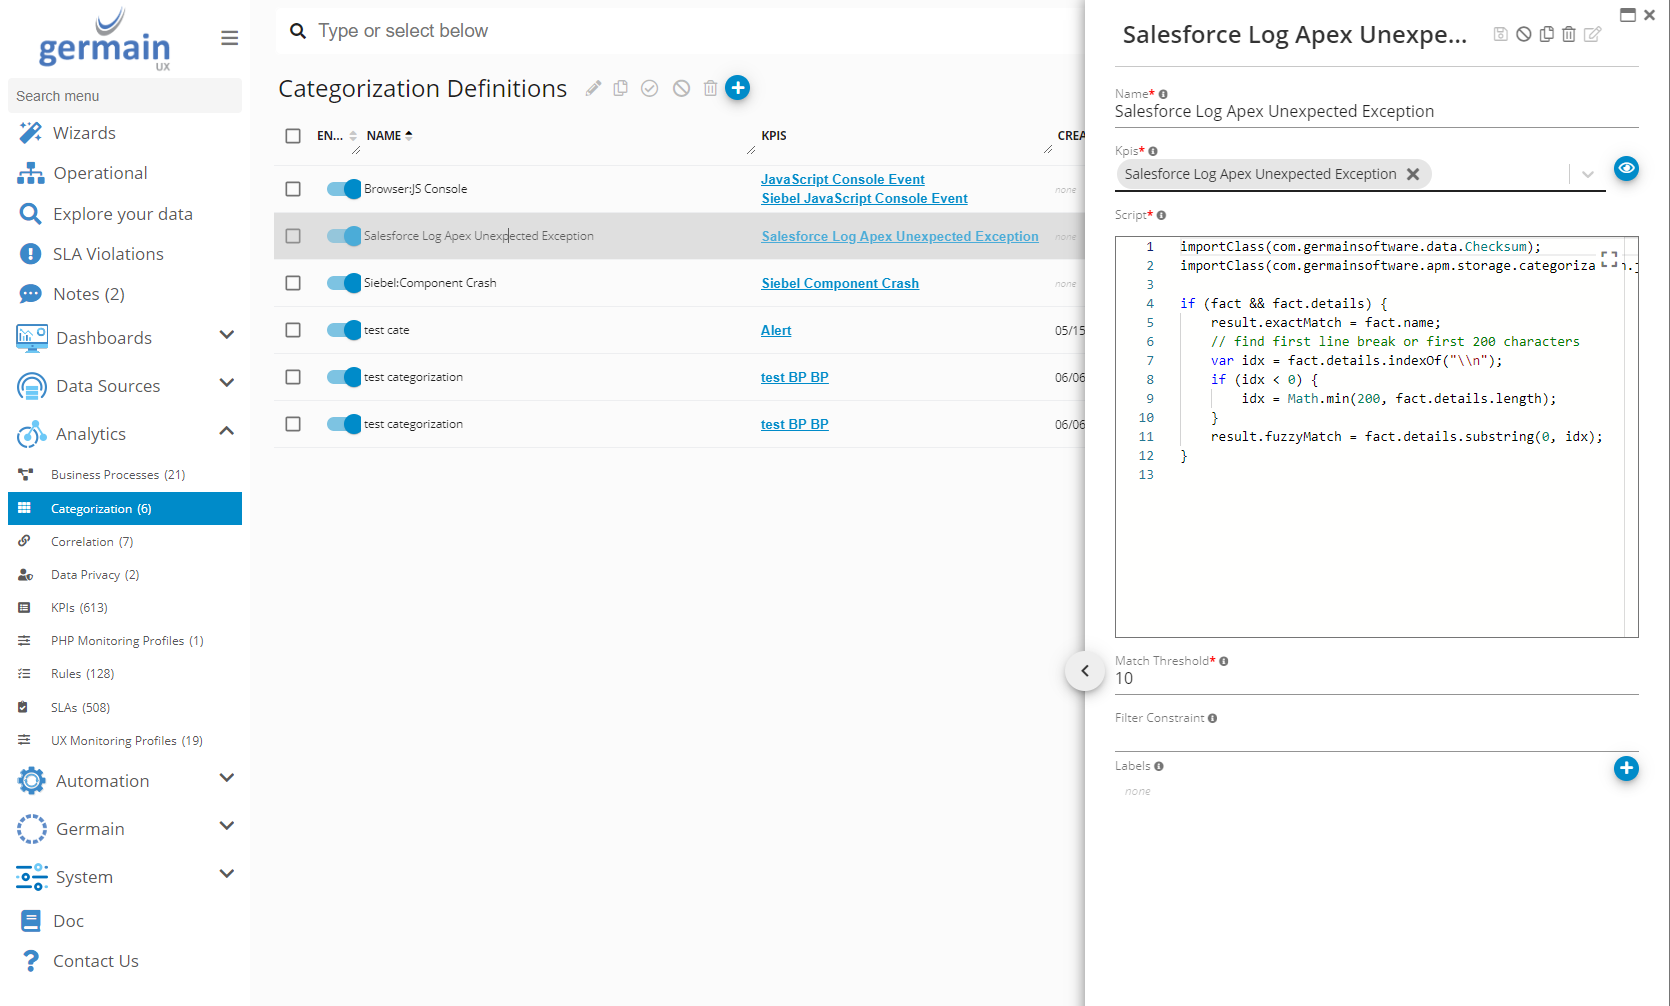
🏷️ Configure Exception Categorization
Exception categorization groups technically equivalent failures even when individual messages contain changing values such as:
-
Salesforce record IDs
-
User IDs
-
Timestamps
-
Line numbers
-
Request IDs
-
Object names
-
Dynamic parameter values
For example, these occurrences may represent the same underlying problem:
NullPointerException in AccountService for Account 001...
NullPointerException in AccountService for Account 001...
A categorization rule can normalize the changing account identifier so GermainUX reports one recurring exception category instead of separate unrelated errors.
✅ Recommended Categories
Create categories based on the information available in the exception record:
-
Exception type
-
Apex class
-
Apex trigger
-
Method
-
Message pattern
-
Stack-trace pattern
-
Line or source location
-
Salesforce namespace
-
Transaction or operation
-
User-facing impact
-
Expected or unexpected status
The objective is to group exceptions that likely share the same root cause while keeping unrelated failures separate.
🔍 Distinguish Expected and Unexpected Exceptions
Not every Apex exception indicates a defect.
Some exceptions may be expected as part of:
-
Input validation
-
Business-rule enforcement
-
Controlled transaction rollback
-
Permission enforcement
-
Duplicate detection
-
An intentionally handled workflow outcome
Create categorization or filtering rules that distinguish:
|
Classification |
Meaning |
Recommended handling |
|---|---|---|
|
Unexpected exception |
Salesforce or custom Apex code did not operate as intended |
Include in technical-error KPIs and prioritize for investigation |
|
Expected business validation |
The user received intended guidance before an invalid operation could continue |
Analyze separately as validation or UX feedback |
|
Handled technical exception |
An exception occurred but the application recovered as designed |
Track if operationally useful, but rank below unhandled failures |
|
Known non-actionable exception |
A documented event that does not require investigation |
Exclude, suppress, or classify separately |
This prevents expected validation behavior from distorting the KPI used to measure broken Salesforce workflows.
👥 Identify User-Facing Impact
An Apex exception is technically important, but it does not always produce a visible Salesforce error.
When browser monitoring is enabled, GermainUX can help distinguish:
-
Exceptions that caused a visible error
-
Exceptions that caused an interaction to fail
-
Exceptions associated with slow Salesforce behavior
-
Exceptions handled without visible impact
-
Exceptions that affected an API or background process
-
Exceptions correlated with abandonment or repeated user actions
Use this distinction to prioritize exceptions by actual user and business impact.
📃 Recommended Exception Attributes
When available, retain the following attributes for analysis:
|
Attribute |
Purpose |
|---|---|
|
Exception type |
Identifies the technical failure class |
|
Message |
Provides failure details |
|
Apex class |
Identifies the affected class |
|
Apex trigger |
Identifies the affected trigger |
|
Method |
Identifies the executing method |
|
Stack trace |
Supports root-cause analysis |
|
Line number |
Identifies the source location |
|
Namespace |
Distinguishes managed-package and custom code |
|
User |
Identifies affected users or profiles |
|
Transaction ID |
Correlates related Salesforce telemetry |
|
Request or session ID |
Supports browser-to-server correlation |
|
Salesforce organization |
Distinguishes monitored environments |
|
Environment |
Separates production, staging, test, or development |
|
Timestamp |
Supports correlation with other events |
|
Governor-limit context |
Identifies limit-related failures when available |
Apply masking, anonymization, or exclusions to sensitive values before retaining or displaying exception content.
🔔 Configure Alerts
Create alerts for exceptions requiring timely investigation.
Useful alert conditions include:
-
A new unexpected exception appears.
-
A critical exception occurs.
-
Exception volume exceeds a baseline or threshold.
-
The same exception affects multiple users.
-
An exception occurs in a critical Salesforce workflow.
-
Exception frequency increases after a deployment.
-
A visible Salesforce error correlates with an Apex exception.
-
A previously resolved exception reappears.
Alerts can notify teams through:
-
Email
-
Tickets
-
Webhooks
-
Scheduled or immediate reports
-
Other configured GermainUX actions
Avoid alerting on every individual occurrence when a grouped, threshold-based alert provides a clearer operational signal.
📈 Analyze Apex Exceptions
Use GermainUX dashboards and Analysis to answer:
-
Which Apex exceptions occur most frequently?
-
Which are new?
-
Which increased after a Salesforce deployment?
-
Which users, profiles, or business units are affected?
-
Which Salesforce workflows fail?
-
Which exceptions produce visible errors?
-
Which classes and triggers generate the most failures?
-
Are exceptions isolated to one Salesforce organization or environment?
-
Which exceptions correlate with slow interactions, API calls, or SOQL activity?
-
How much productivity or business activity is affected?
📊 Aggregate Analysis
At the aggregate level, compare exception categories by:
-
Count
-
Trend
-
Affected users
-
Affected sessions
-
Salesforce organization
-
Apex class or trigger
-
Workflow
-
Application version or deployment period
-
User-facing impact
👁️ Instance-Level Analysis
Open an individual occurrence to review the available:
-
Exception message
-
Stack trace
-
Apex class, trigger, method, and line
-
User and transaction identifiers
-
Related Salesforce events
-
Debug-log activity
-
Related browser interactions
-
Session Replay
-
Correlated API or integration activity
🔗 Correlate Exceptions With User Sessions
When Salesforce Real User Monitoring is enabled, correlate the exception with:
-
The user action that initiated the transaction
-
The affected page or record
-
Interaction response time
-
Browser and JavaScript errors
-
Network calls
-
User-facing error messages
-
Repeated clicks or retries
-
Workflow abandonment
-
Session Replay
This connection allows teams to move from “an Apex exception occurred” to “this exception prevented these users from completing this Salesforce workflow.”
For browser deployment, see User Monitoring and Session Replay for Salesforce.
✅ Validate the Configuration
Trigger or locate a known Apex exception in a controlled Salesforce environment, then verify that:
-
The exception appears in GermainUX.
-
Its timestamp is correct.
-
The expected Salesforce organization and environment are assigned.
-
Exception type and message are populated.
-
Apex class or trigger information appears when available.
-
The categorization rule assigns the expected category.
-
Expected validation exceptions are not classified as unexpected failures.
-
Relevant user and transaction context is present.
-
Related Salesforce logs or events are accessible.
-
The associated user session and replay can be opened when correlation is configured.
-
Any applicable alert is triggered once and routed correctly.
 No Apex Exceptions Appear
If expected exceptions are missing:
-
Confirm that the GermainUX Engine is running.
-
Verify the Salesforce OAuth connection.
-
Confirm that the integration user has the required permissions.
-
Verify that the configured Salesforce source contains Apex exception data.
-
Check that debug-log or event collection is enabled for the affected users or transactions.
-
Confirm that the responsible monitoring component is enabled.
-
Review its execution schedule or polling interval.
-
Check Engine logs for Salesforce API, authorization, and parsing errors.
-
Review Salesforce API usage and limits.
-
Confirm that filters or categorization rules are not excluding the exception.
-
Verify the selected time range and Salesforce environment in GermainUX.
❗ Exception Details Are Incomplete
If an exception appears without a stack trace, class, method, or line number, the underlying Salesforce source may not provide those details.
Enable a more detailed source—typically Salesforce Debug Log Monitoring—for the affected user or transaction when deeper evidence is required.
Because debug logging can generate significant data and consume Salesforce resources, enable it only for the required users and investigation period.
🔒 Security and Privacy
Exception messages and stack traces can contain:
|
Potential Sensitive Content |
|---|
|
Record identifiers |
|
User identifiers |
|
Customer information |
|
Query parameters |
|
Field values |
|
Integration endpoints |
|
Internal implementation details |
Before production use:
-
Configure masking, anonymization, and exclusions.
-
Restrict access to exception details.
-
Limit collection to required sources and fields.
-
Apply appropriate retention policies.
-
Avoid exposing secrets, session IDs, or OAuth tokens.
-
Review the configuration with Salesforce security and privacy owners.
📚 Related Documentation
-
Other Analytics Features
-
Other Automation Features
ℹ️ Get Help
The Germain Team can help you set this up. Contact GermainUX Support.
Component: Engine
Feature Availability: 2017.1 or later