
🚀 Deploy Campaign Monitoring
GermainUX Campaign Monitoring connects campaign attribution data with real-user behavior, Session Replay, engagement, drop-offs, conversions, feedback, and application performance.
🔎 Purpose
This configuration lets teams determine which campaigns attract users, how those users behave, and which UX or technology issues affect campaign performance.
⚙️ Data collection components
Campaign insights can be collected and processed by the following GermainUX components:
|
Component |
Role |
|---|---|
|
Primary component for collecting campaign attribution, referrer, landing-page, session, behavior, performance, and conversion data from web applications. |
|
|
Used when RUM JS cannot be injected into the required application context. |
|
|
Supports additional processing, enrichment, correlation, and custom analytics when required. |
Deploy Real User Monitoring and Session Replay
Deploy Real User Monitoring and Session Replay using RUM JS or the RUM Browser Extension.
Session Replay is recommended because it lets teams investigate what users from a particular campaign experienced before converting, abandoning, or encountering friction.
Configure Campaign Attribution
Google Analytics UTM Parameters
GermainUX can extract campaign attribution from:
|
Source |
Description |
|---|---|
|
Page query string |
Reads UTM parameters directly from the landing-page URL. |
|
|
Reads campaign information from the legacy Google Analytics campaign cookie, when available. |
Common UTM parameters include:
|
UTM parameter |
GermainUX campaign field |
|---|---|
|
|
Source |
|
|
Medium |
|
|
Name |
|
|
Content |
|
|
Term |
See Google Analytics campaign URL configuration.
Configure a Custom Campaign Extractor
Use settings.application.campaignExtractor when campaign information must be extracted from a custom URL structure, page content, application state, cookie, or another source.
The following example extracts standard UTM parameters from the page query string:
const settings = germainApm.getDefaultSettings(loaderArgs, agentConfig);

settings.application.campaignExtractor = function () {
    const queryString = window.location.search;

    if (!queryString) {
        return undefined;
    }

    const values = germainApm.utils.parseQueryStringToMap(queryString);

    // Source and medium are required in this example.
    if (!values.utm_source || !values.utm_medium) {
        return undefined;
    }

    return {
        source: values.utm_source || null,
        medium: values.utm_medium || null,
        name: values.utm_campaign || null,
        content: values.utm_content || null,
        term: values.utm_term || null
    };
};

germainApm.start(settings);
The extractor returns the campaign attributes that GermainUX associates with the user’s session, landing page, behavior, and monitored outcomes.
Create a Campaign Analytics Dashboard
After campaign monitoring is active, to analyze campaign traffic, behavior, conversion, and friction.
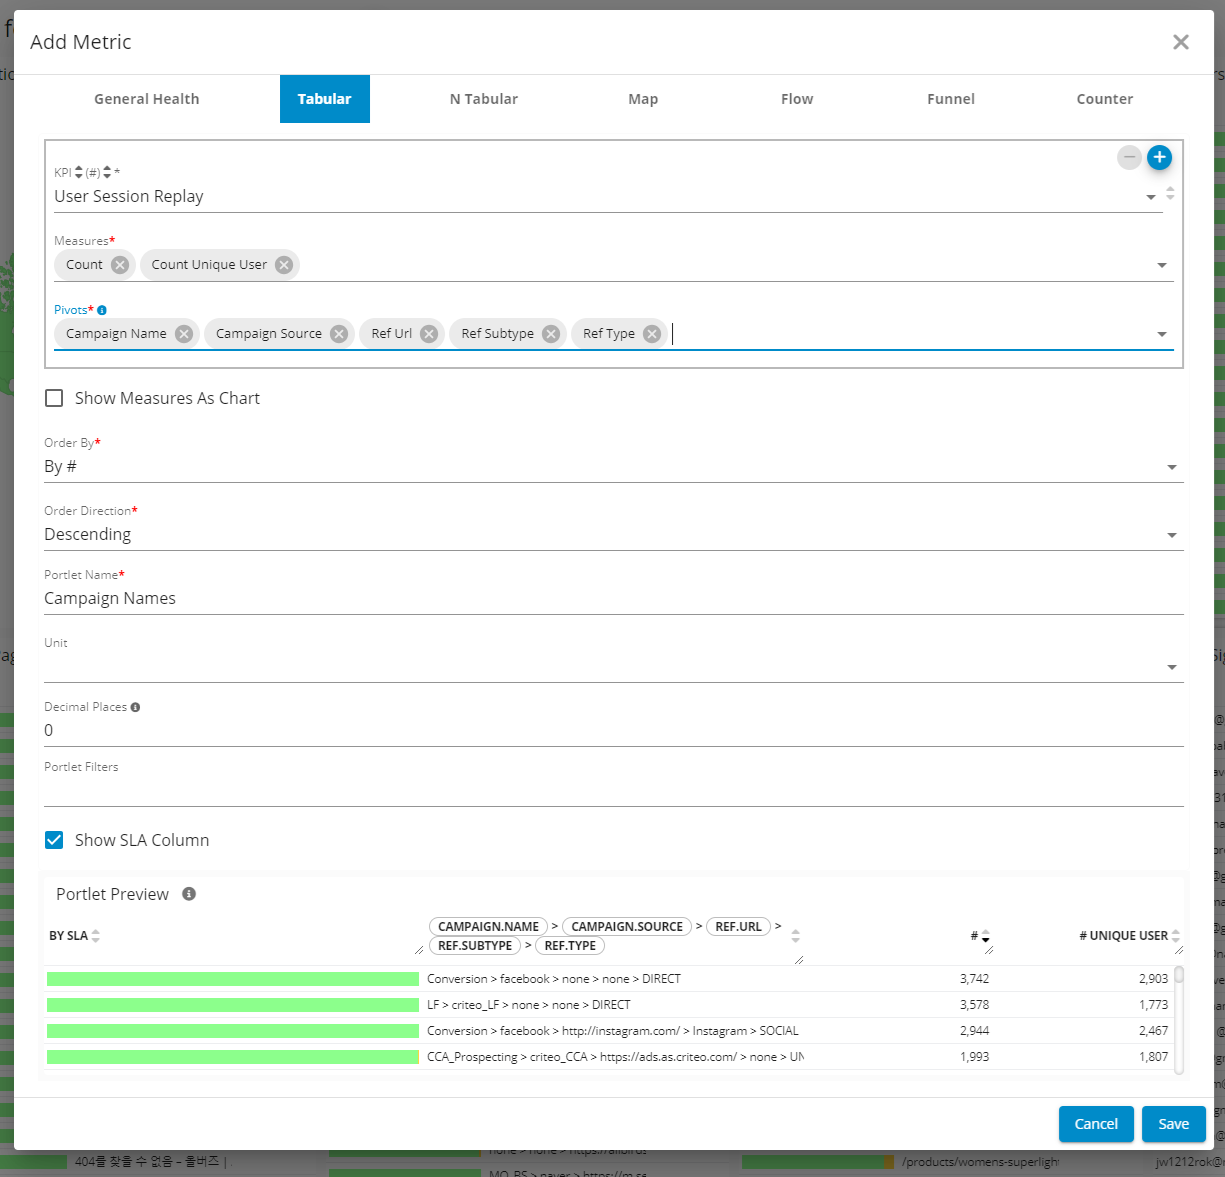
Recommended Pivots
|
Pivot |
What it reveals |
|---|---|
|
Campaign Name |
Campaign associated with the session. |
|
Campaign Source |
Origin of the traffic, such as Google, Facebook, LinkedIn, or an email provider. |
|
Campaign Medium |
Marketing channel, such as organic, paid, email, social, or referral. |
|
Campaign Content |
Creative, advertisement, link, or content variant associated with the visit. |
|
Campaign Term |
Paid-search keyword or other campaign term. |
|
Landing Page |
First page visited during the campaign session. |
|
Exit Page |
Last page visited before the session ended. |
|
Referrer URL |
Page or application from which the user arrived. |
|
Referrer Type |
High-level referrer category, such as Direct, Search, Social, or Internal. |
|
Referrer Subtype |
More specific classification of the referring source. |
|
Returning User |
Whether the campaign attracted a new or returning user. |
|
Device, Browser, or Location |
Technology and geographic segments associated with campaign performance. |
Recommended Measures
|
Measure |
What it quantifies |
|---|---|
|
Session Count |
Number of sessions attributed to the campaign. |
|
Unique User Count |
Number of users reached by the campaign. |
|
Conversion Count and Rate |
Outcomes completed by campaign visitors. |
|
Drop-Off Count and Rate |
Users who abandoned a page, journey, or conversion flow. |
|
Average Active Duration |
Time users actively engaged with the application. |
|
Average Session Duration |
Total duration of campaign-attributed sessions. |
|
Pages Visited |
Depth of navigation and content engagement. |
|
Error Count |
Errors encountered by campaign visitors. |
|
Positive and Negative Feedback |
User sentiment associated with the campaign experience. |
These pivots and measures can be combined to compare campaigns, identify underperforming segments, quantify conversion loss, and replay the sessions affected by specific issues.
For assistance with campaign-specific attribution or dashboard design, contact GermainUX Support.
📦 Additional Resources
-
Troubleshoot GermainUX
-
Management Features.
ℹ️ Get Help
The Germain Team can help you set this up. Contact GermainUX Support.
Service: Analytics
Component: RUM JS, RUM Extension, RUM Windows
Feature Availability: 2014.1 or later