
✨ Features
GermainUX provides search and filtering capabilities across its dashboards, enabling users to quickly find and analyze both aggregated and raw data.
Search and filters help teams:
|
Capability |
|---|
|
Find specific users, sessions, errors, products, pages, transactions, or events |
|
Focus dashboards on the data relevant to an investigation |
|
Search across related parent and child data |
|
Assess the business and user impact of an issue |
|
Save frequently used filters |
|
Share filters with other users or teams |
|
Ask AI questions about an insight and its potential root cause |
Search criteria and filters remain part of the analytical context as users move from high-level dashboards to individual events and Session Replay.
🤖 AI Explore
AI Explore provides a conversational, ChatGPT-like interface within the Analysis Dashboard.
Instead of manually examining every chart, segment, related KPI, and instance, users can ask questions about the data being analyzed.
AI Explore can help:
|
Task |
|---|
|
Explain an insight |
|
Summarize what changed |
|
Determine whether a KPI is abnormal |
|
Identify affected users, sessions, pages, products, or processes |
|
Investigate relationships between KPIs |
|
Interpret Leading Factors |
|
Suggest potential root causes |
|
Recommend corrective actions |
|
Summarize the available evidence |
❓ Example questions include:
|
Question |
|---|
|
Why are Salesforce clicks slower than usual? |
|
Which users and pages are most affected? |
|
What changed at the same time as the slowdown? |
|
What is the likely root cause? |
|
Why are customers encountering errors during Shopify checkout? |
|
Which products, devices, or customer segments are most affected? |
|
What actions could reduce checkout abandonment? |
AI Explore uses the current Analysis Dashboard context, including the selected KPI, time range, filters, related KPIs, segmentation, and available instance data.
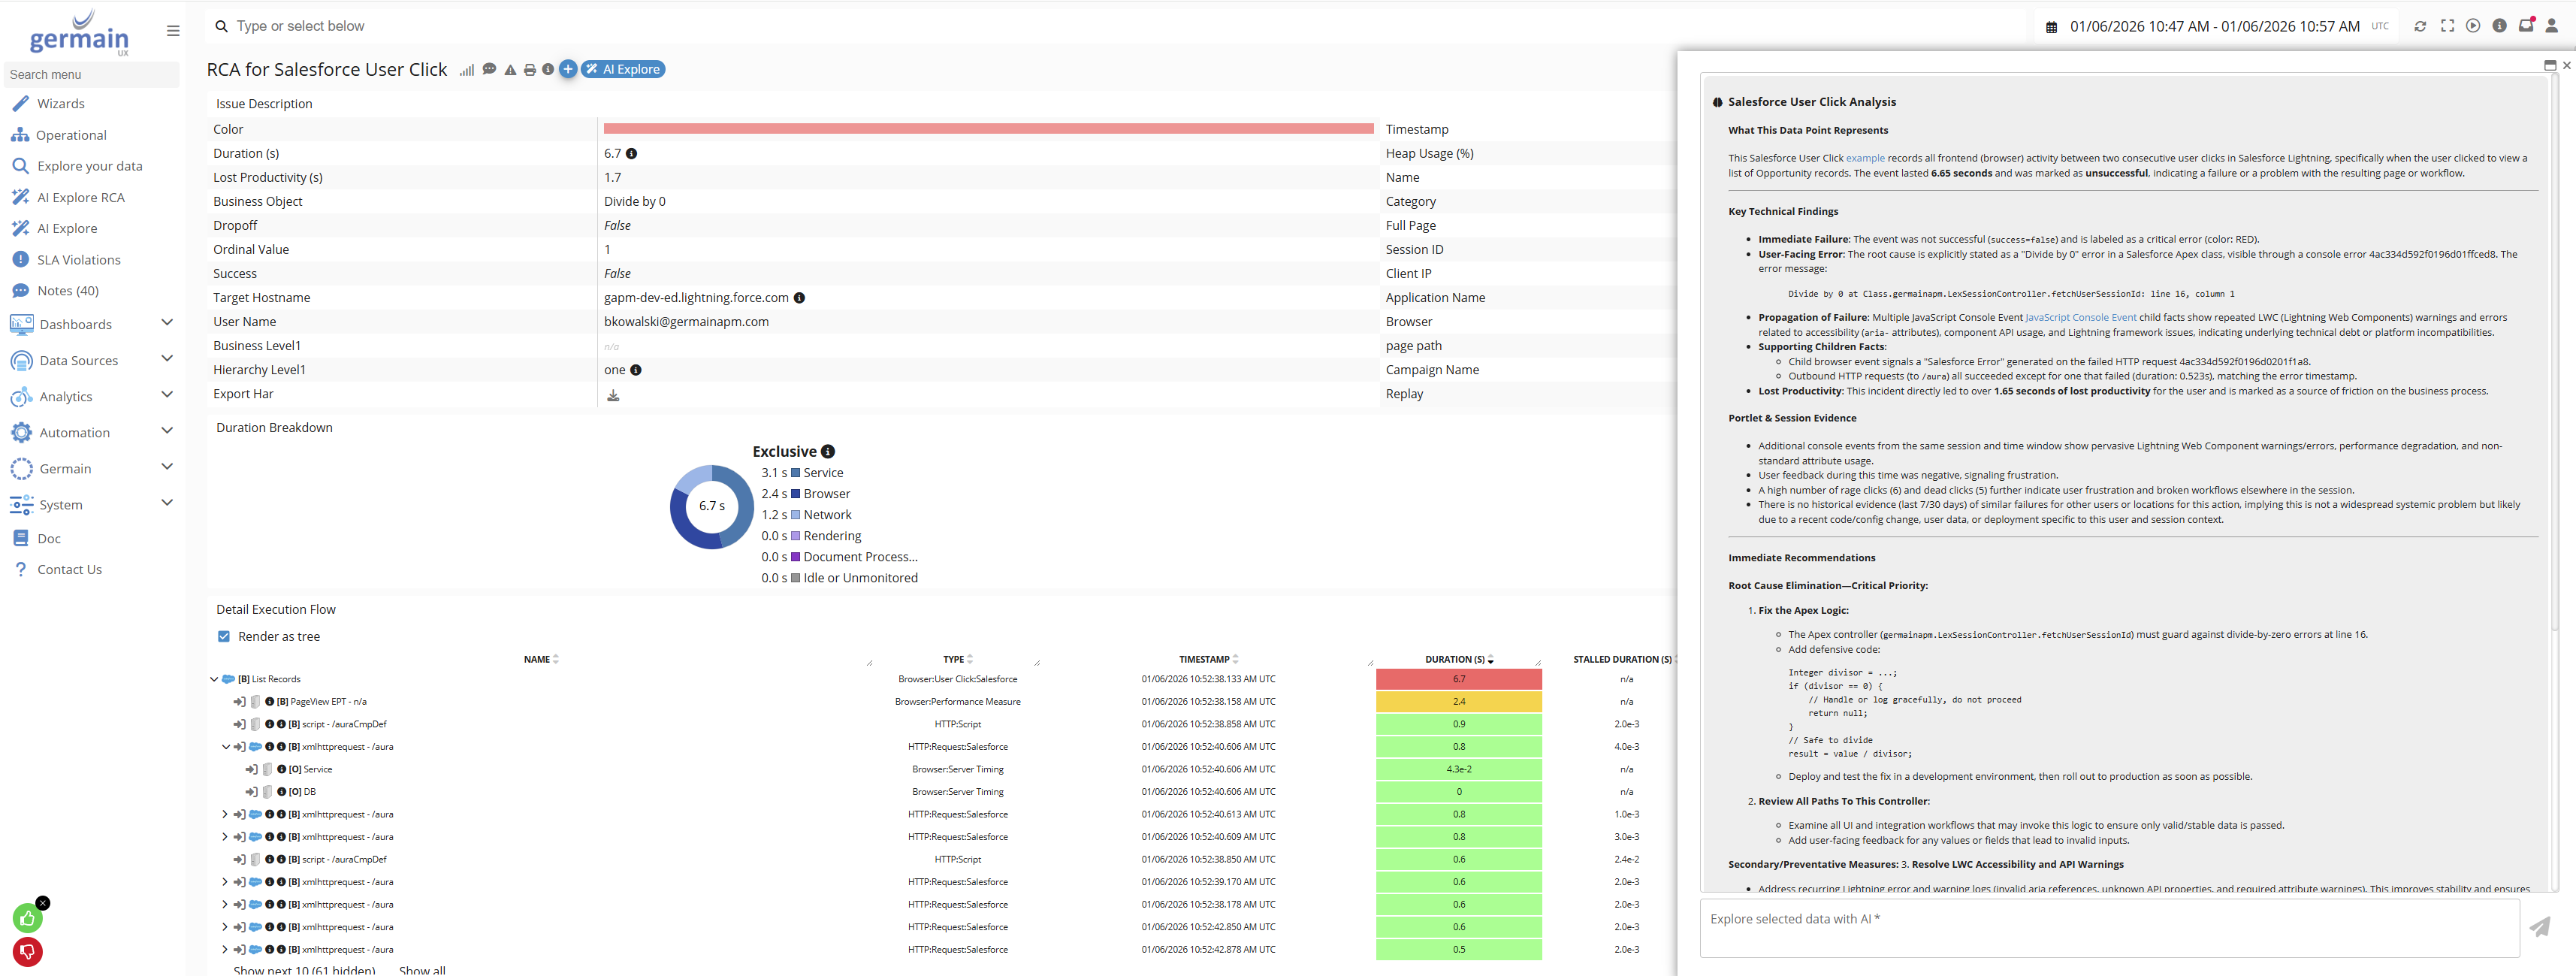
⏳ Example: Slow Salesforce Clicks
AI Explore can analyze a slow Salesforce User Click KPI and help explain:
|
Question |
|---|
|
Whether the slowdown is abnormal |
|
Which pages or actions are affected |
|
Which users and sessions experience it |
|
Whether errors or HTTP requests increased at the same time |
|
Whether the bottleneck is associated with the browser, network, or backend service |
|
Which corrective actions should be investigated |
🛒 Example: Shopify Checkout Errors
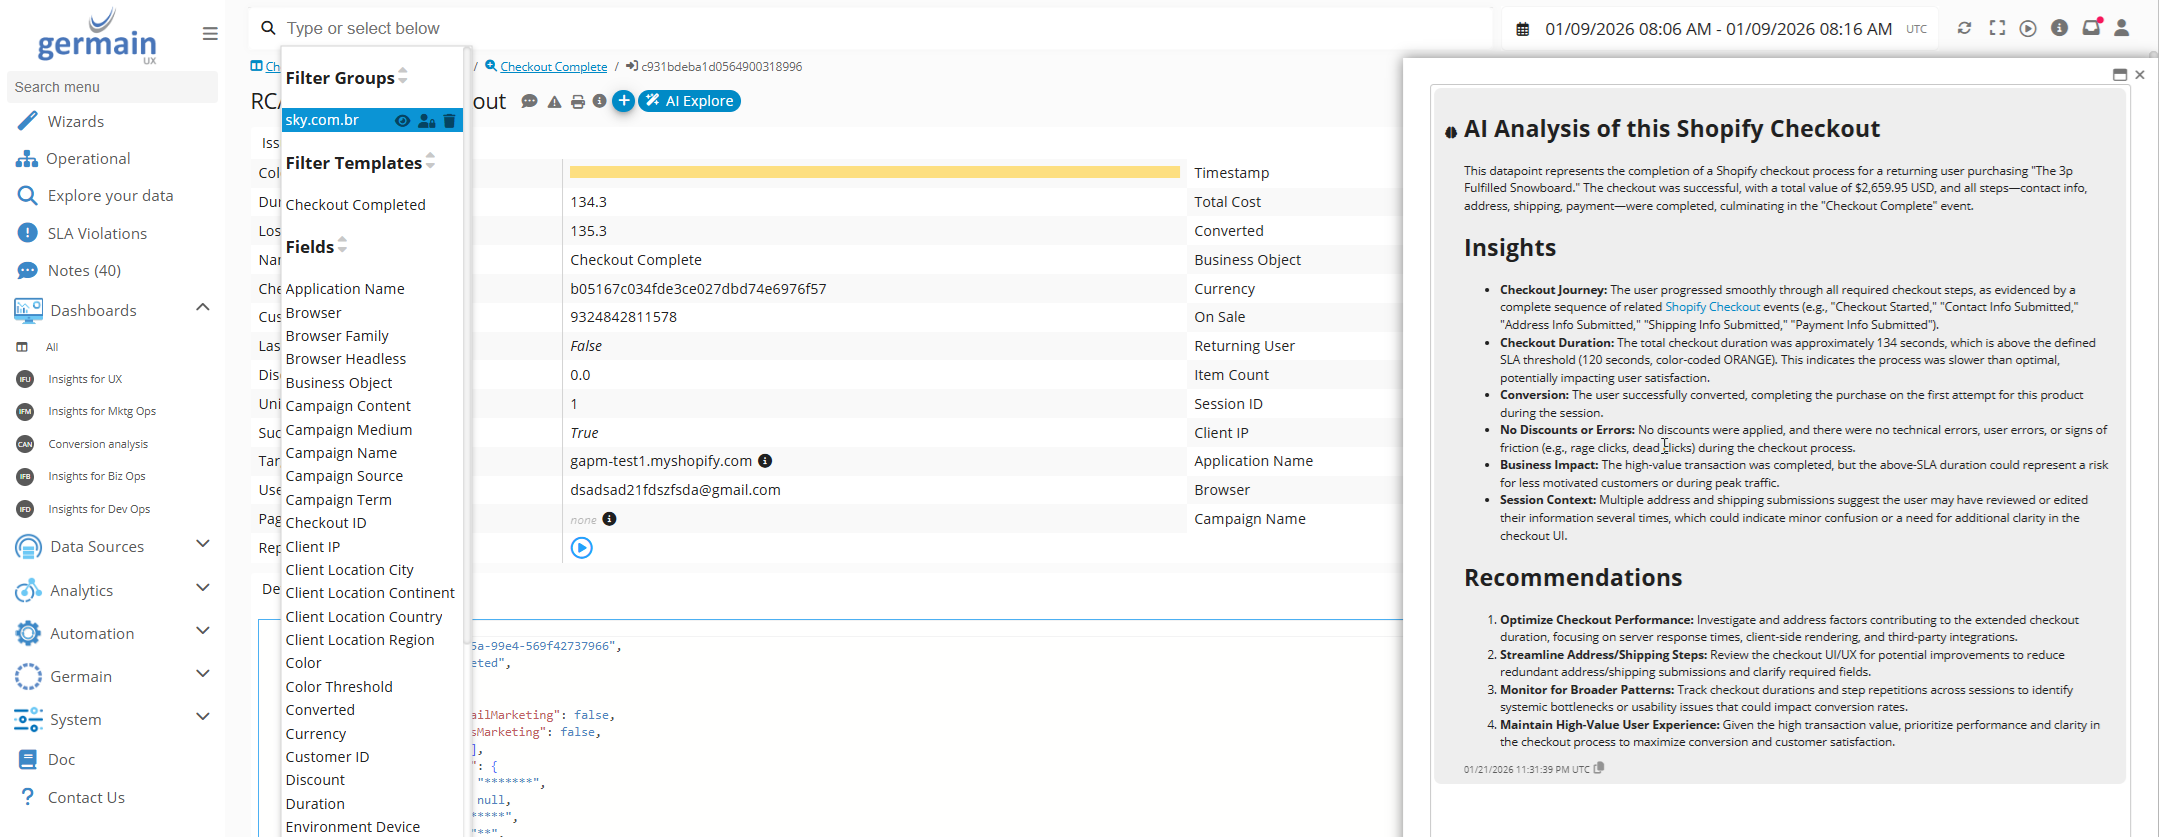
AI Explore can analyze a Shopify checkout error and help identify:
|
Finding |
|---|
|
The affected checkout step |
|
The products or variants involved |
|
The devices, browsers, or customer segments affected |
|
Related errors or performance problems |
|
The likely cause of abandonment |
|
Recommended actions to improve conversion |
🔍 Full-Text Search
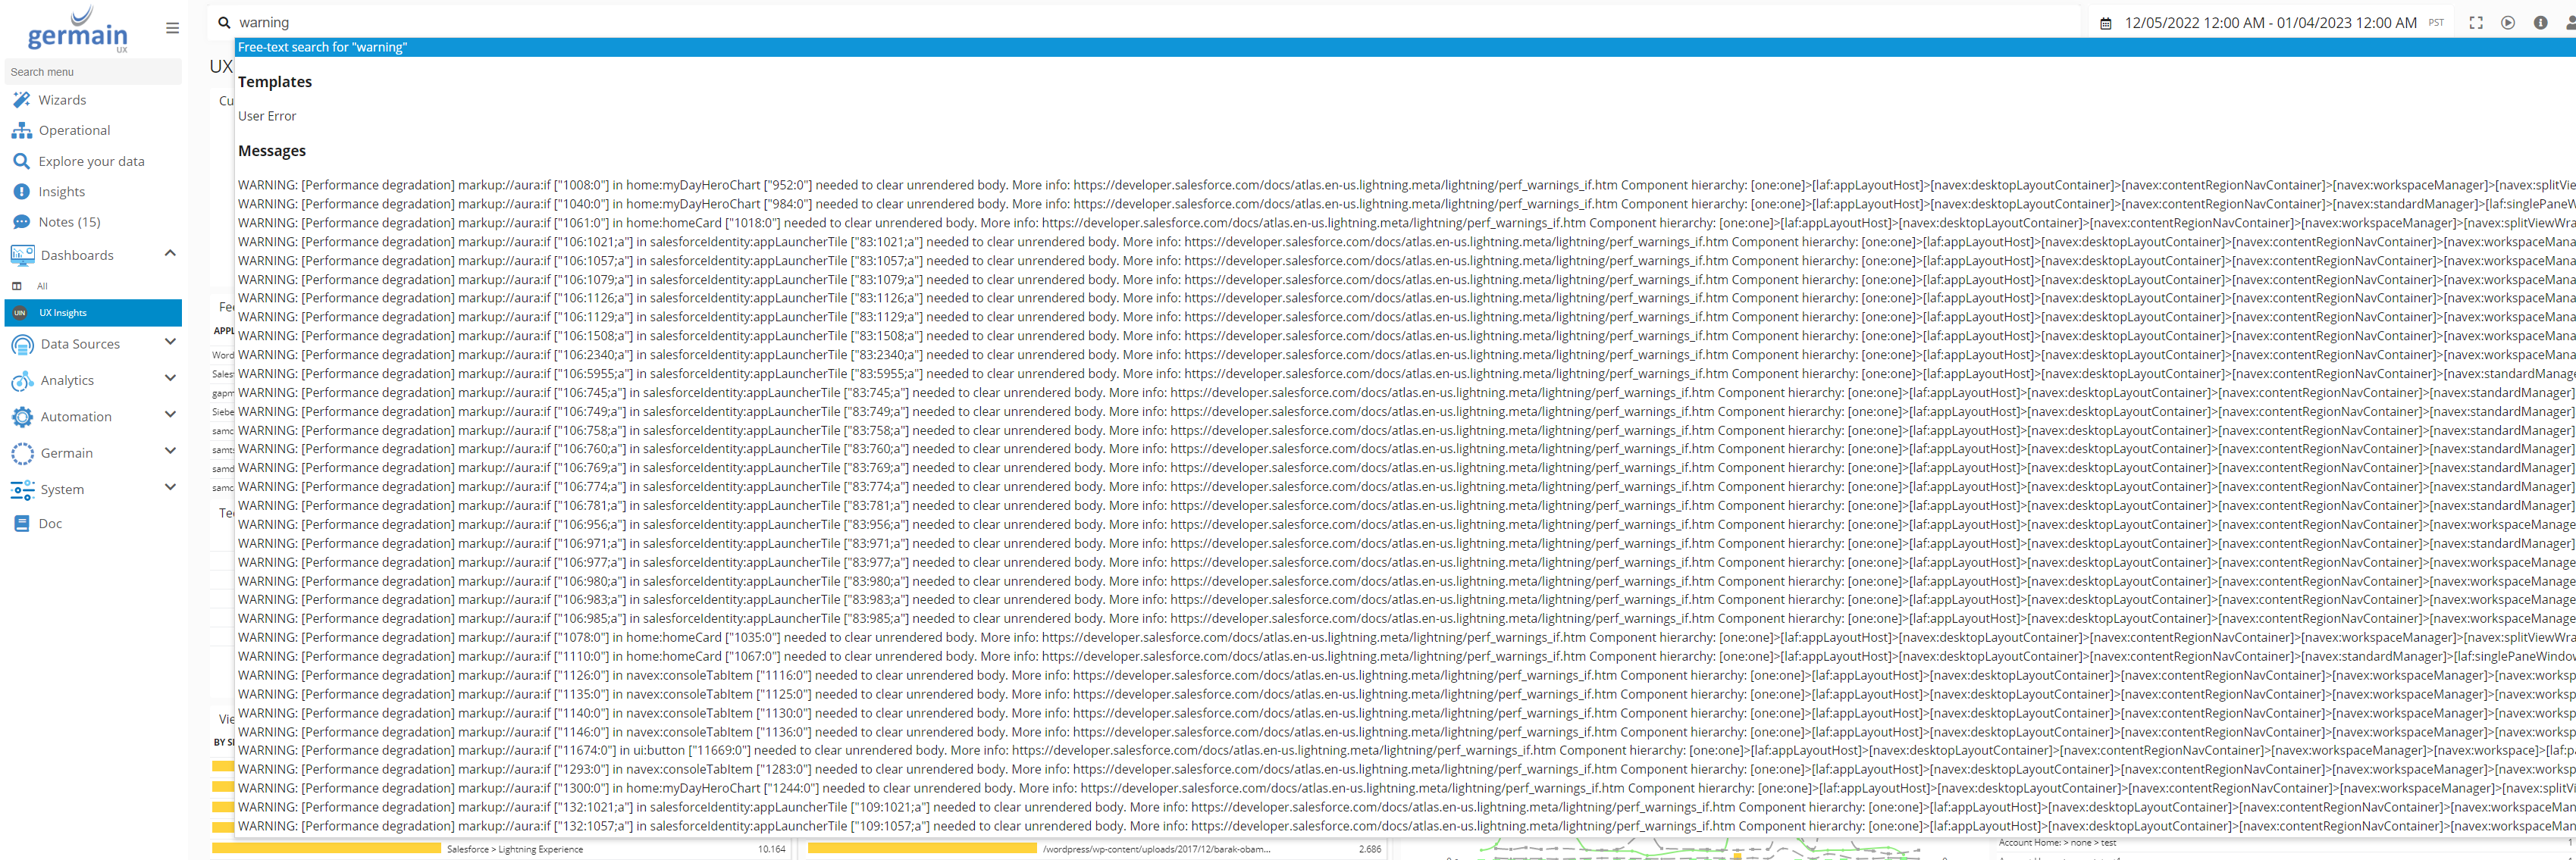
Full-Text Search allows users to enter words, phrases, identifiers, or values to find matching data.
Search can be used to find information such as:
|
Type |
|---|
|
Error messages |
|
Usernames |
|
Session IDs |
|
Correlation IDs |
|
Product names |
|
Page titles |
|
URLs |
|
Application names |
|
Server names |
|
Database names |
|
Component names |
|
Business-process values |
|
Any other collected text or metadata |
For example:
product abc
error 123
Salesforce
checkout failed
🔧 Search Values Containing Operators
GermainUX supports operators such as:
|
Operator |
Symbol |
|---|---|
|
Equals |
|
|
Not equals |
|
|
Less than |
|
|
Greater than |
|
|
Less than or equal |
|
|
Greater than or equal |
|
If the value being searched contains a colon or another search operator, enclose the complete value in single or double quotation marks.
Examples:
'Error: checkout failed'
"duration >= 5"
Quoting the value ensures that GermainUX treats it as text instead of interpreting part of it as a search operator.
🔎 Recursive Search
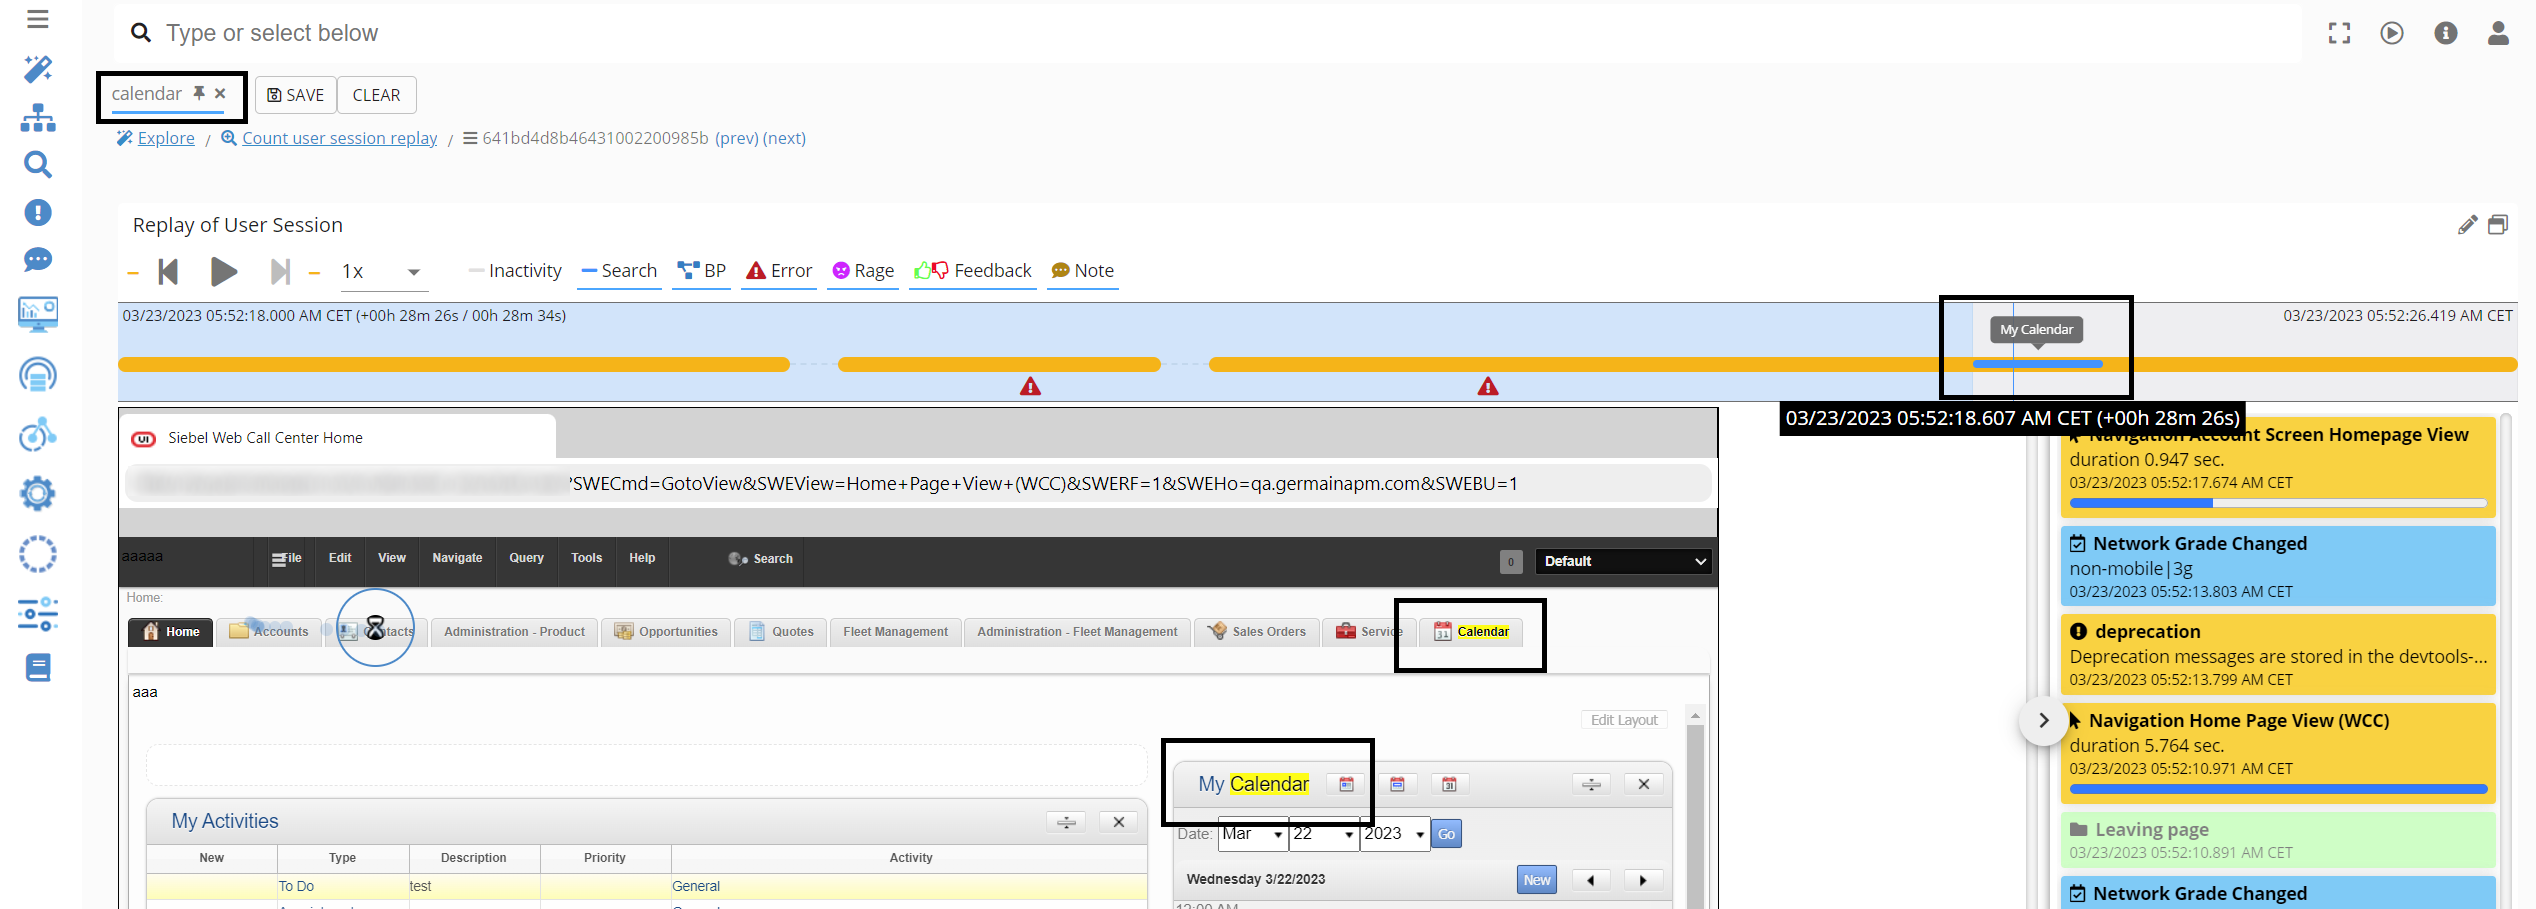
Recursive Search searches not only the selected data but also its related parent and child data.
This is particularly useful when the value being searched is contained in a related event rather than directly in the primary KPI displayed on the dashboard.
For example, Recursive Search can help answer:
|
Question |
|---|
|
How many users ordered |
|
Which sessions encountered |
|
Which user actions generated a particular HTTP request? |
|
Which transactions were associated with a specific backend error? |
|
How many users were affected by a particular technology issue? |
|
Which sessions included a specific page, popup, message, or workflow step? |
📁 Example: Find Users Who Ordered a Product
To find users who ordered product abc:
-
Open the relevant Drill-through Dashboard.
-
Search for
product abc. -
Enable or use Recursive Search to search related parent and child data.
-
Review the matching transactions, users, and sessions.
-
Open the associated Session Replays to watch the users complete the order.
🐛 Example: Find Sessions Affected by an Error
To find sessions containing error 123:
-
Open the relevant Drill-through Dashboard.
-
Search for
error 123. -
Search recursively across related events.
-
Review the matching users, sessions, and transactions.
-
Open Session Replay to see when the error appeared and how the user responded.
Recursive Search connects technical, business, workflow, and user-experience data, making it easier to assess the full impact of an issue.
Example of a R
ecursive Search from Drillthrough Dashboard to Session Replay - GermainUX
📅 Date and Time Filter
Use the Time filter to define the period displayed on a dashboard.
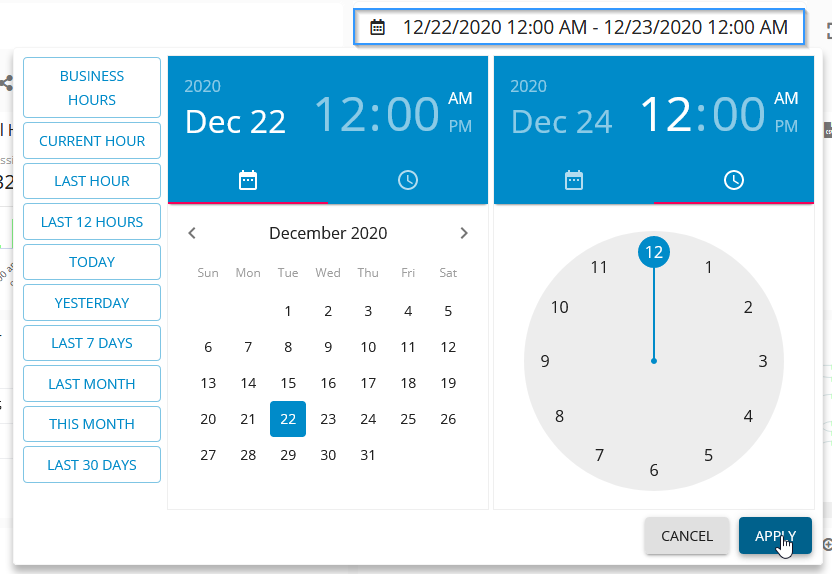
When applied at the dashboard level, the selected time range applies globally to all portlets on that dashboard.
Time ranges can be used to:
|
Use |
|---|
|
Investigate a specific incident |
|
Compare recent performance with a prior period |
|
Analyze a release or deployment window |
|
Review daily, weekly, monthly, or longer-term trends |
|
Limit an investigation to the period surrounding a user action |
|
Exclude irrelevant historical data |
Preconfigured and custom time ranges can be managed under:
Settings > System > Time Ranges
🌐 Time Zone
The selected time zone determines how dates and times are displayed and interpreted throughout GermainUX.
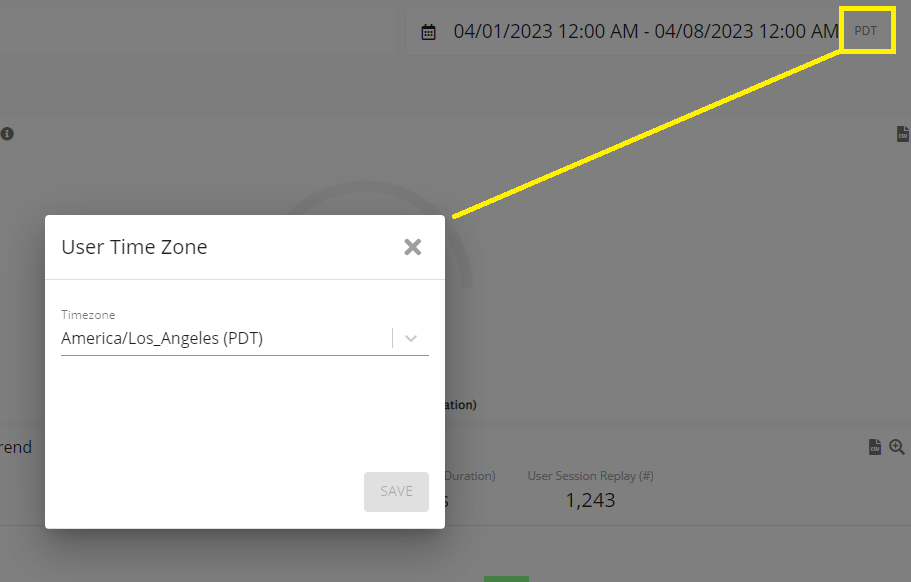
Using the correct time zone is important when:
|
Scenario |
|---|
|
Investigating an incident |
|
Comparing data with application or server logs |
|
Reviewing a Session Replay |
|
Correlating user activity with backend transactions |
|
Sharing findings with teams in different locations |
Confirm the applicable time zone before comparing GermainUX data with external systems.
🔬 Data and Metadata Filters
GermainUX can filter on data and metadata collected from monitored applications, users, transactions, infrastructure, and business processes.
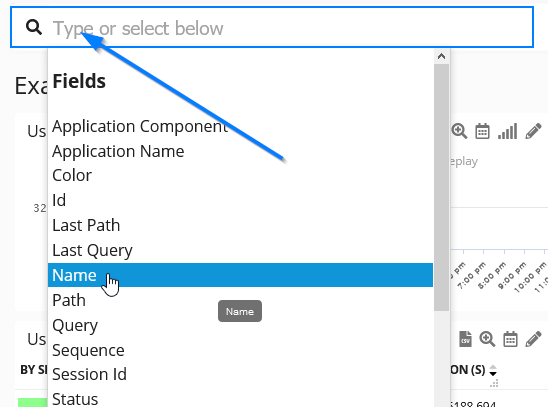
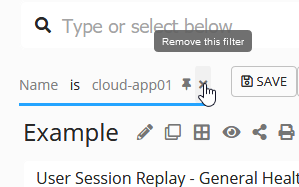
Available fields depend on the selected KPI and collected data. Examples include:
|
Field |
|---|
|
Application |
|
Environment |
|
Server |
|
Host |
|
User |
|
Team |
|
Session |
|
Component |
|
Database |
|
Page |
|
Screen |
|
URL |
|
Product |
|
Process |
|
Transaction |
|
Error |
|
Device |
|
Browser |
|
Version |
|
Region |
|
Any other collected attribute |
Filters can include or exclude values to focus an investigation on the relevant population.
For example, users can filter data to:
|
Filter |
|---|
|
Display only production activity |
|
Exclude known or irrelevant errors |
|
Analyze a specific application version |
|
Focus on one user group |
|
Compare activity across regions |
|
Isolate a product or checkout step |
|
Review one server or application component |
|
Identify sessions affected by a specific error |
🔢 Count and Percentage per KPI
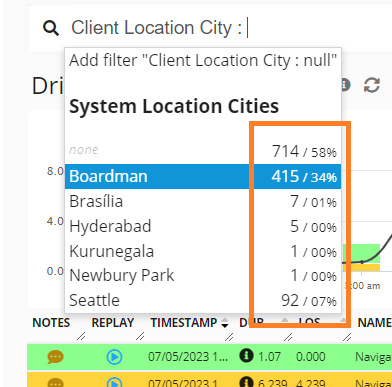
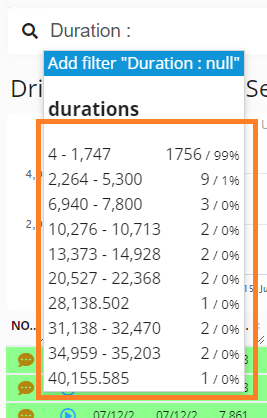
Filter values display their count and percentage for the selected KPI whenever available.
These indicators show:
|
Indicator |
|---|
|
How many matching instances contain the value |
|
What percentage of the selected KPI data the value represents |
Count and percentage help users understand the reach of a value before applying it as a filter.
For example, they can help determine whether:
|
Question |
|---|
|
An error affects most transactions or only a small subset |
|
A browser version represents a significant portion of users |
|
A page accounts for most slow actions |
|
A product contributes heavily to conversion loss |
|
A problem is isolated or widespread |
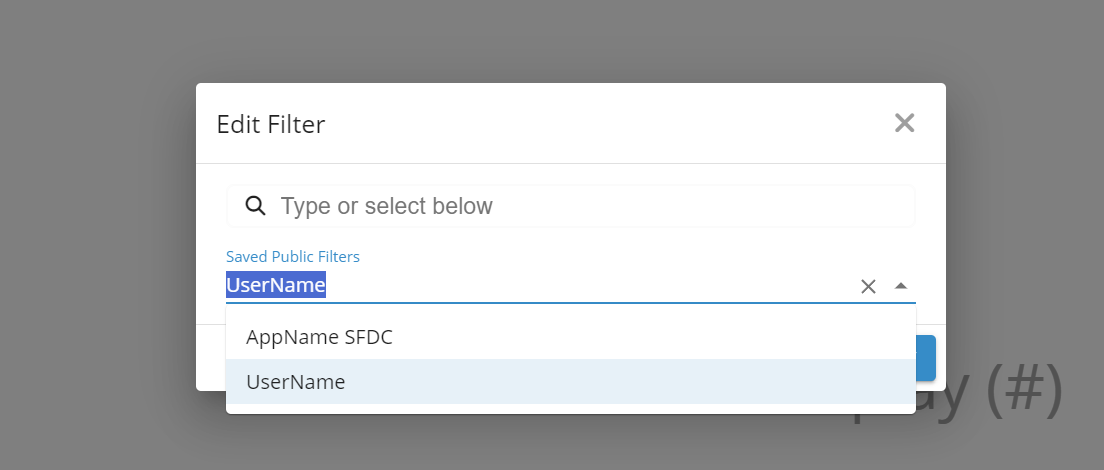
💾 Save a Filter
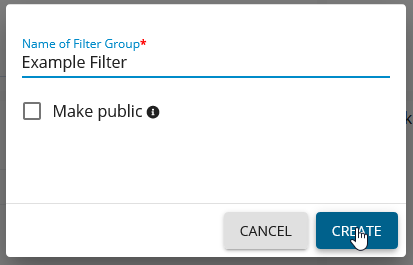
Frequently used filter combinations can be saved as Filter Groups.
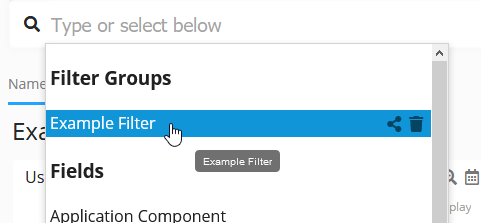
A saved filter can be:
|
Type |
|---|
|
Private: Available only to the user who created it |
|
Public: Available to other authorized users or teams |
Saved filters are useful for recurring investigations, operational views, application-specific analysis, and standardized team workflows.
Examples include:
|
Saved Filter |
|---|
|
Production users only |
|
Critical Salesforce errors |
|
Shopify checkout sessions |
|
One business unit or region |
|
Exclusion of known non-actionable errors |
|
A specific application and version |
|
High-impact user sessions |
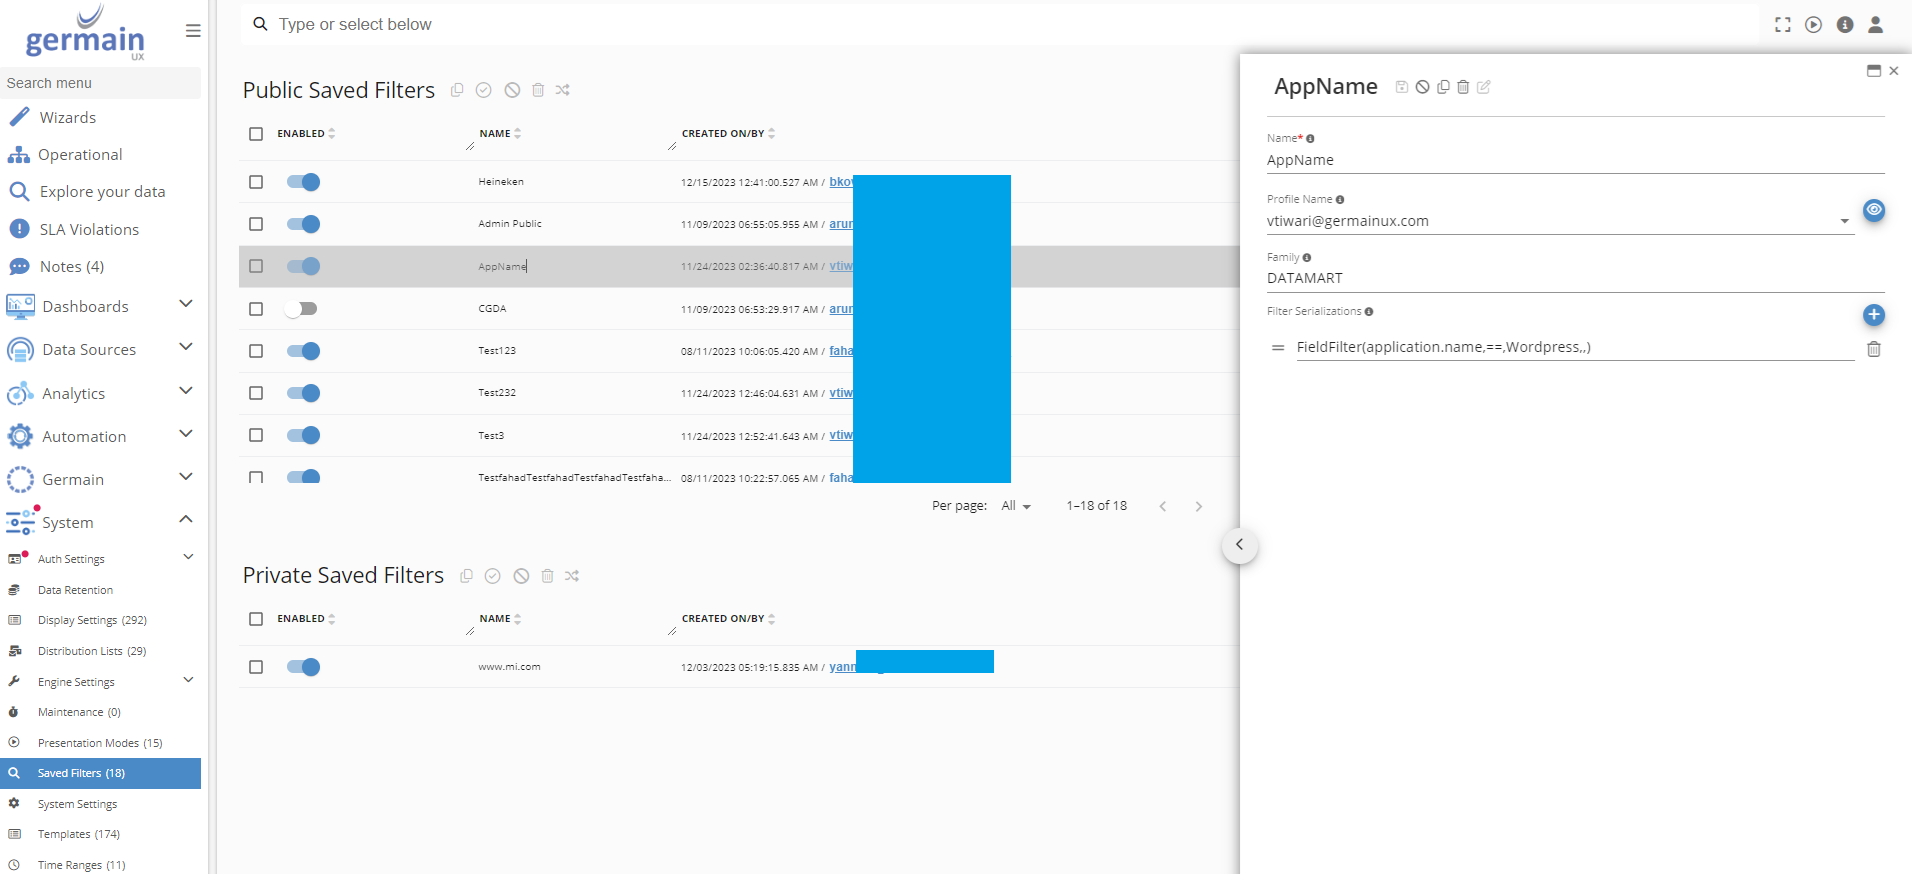
⚙️ Filter Management
The Filter Management screen allows authorized GermainUX administrators to centrally manage saved filters.
Go to:
Settings > System > Filters
Administrators can use this screen to:
|
Action |
|---|
|
Review private and public filters |
|
Update filter definitions |
|
Enable or disable filters |
|
Change filter availability |
|
Maintain filters used by different teams |
|
Remove filters that are no longer required |
Only users with the appropriate UI Admin or Config Admin permissions can edit public filters. Regular users can edit only the filters they own.
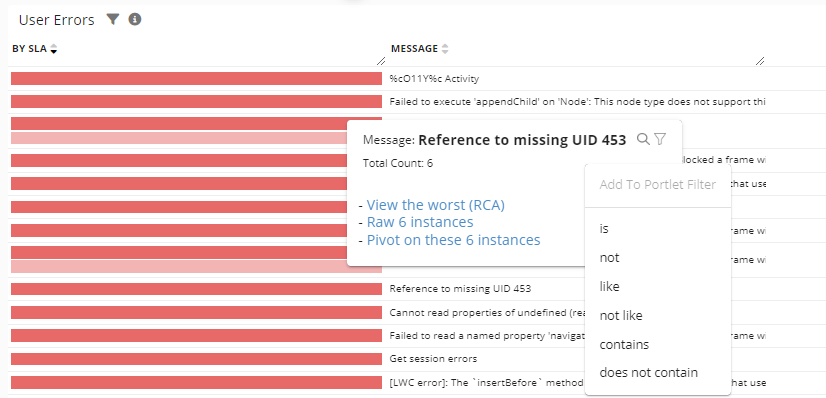
📊 Dashboard and Portlet Filters
Filters can be configured at two levels.
🗂 Dashboard-Level Filter
A dashboard-level filter applies to all portlets on the dashboard.
Use a dashboard-level filter when every visualization should analyze the same population or conditions.
For example, a dashboard-level filter can restrict the entire dashboard to:
-
One application
-
One environment
-
One customer segment
-
One region
-
One business process
-
One period or deployment version
Dashboard-level filters are generally easier to manage when the same criteria should apply throughout the dashboard.
🔧 Portlet-Level Filter
A portlet-level filter applies only to one visualization.
Use a portlet-level filter when a specific portlet requires different inclusion or exclusion criteria from the rest of the dashboard.
For example, a portlet-level filter can:
-
Include only critical errors
-
Exclude hundreds of known or irrelevant error types
-
Focus on one transaction
-
Display only abandoned sessions
-
Analyze one product category
-
Isolate a specific user action
Portlet-level filters allow individual visualizations to remain focused without changing the other portlets on the dashboard.
Feature Availability: 8.6.0 or later