
HTML and jQuery Monitoring
GermainUX monitors HTML and jQuery applications across the user experience, business workflows, browser, JavaScript, network, and supporting backend services.
It combines real-user telemetry, Session Replay, automated analytics, JavaScript profiling, synthetic transactions, and backend monitoring to show what users experienced, which issues affected them, why those issues occurred, and their business impact.
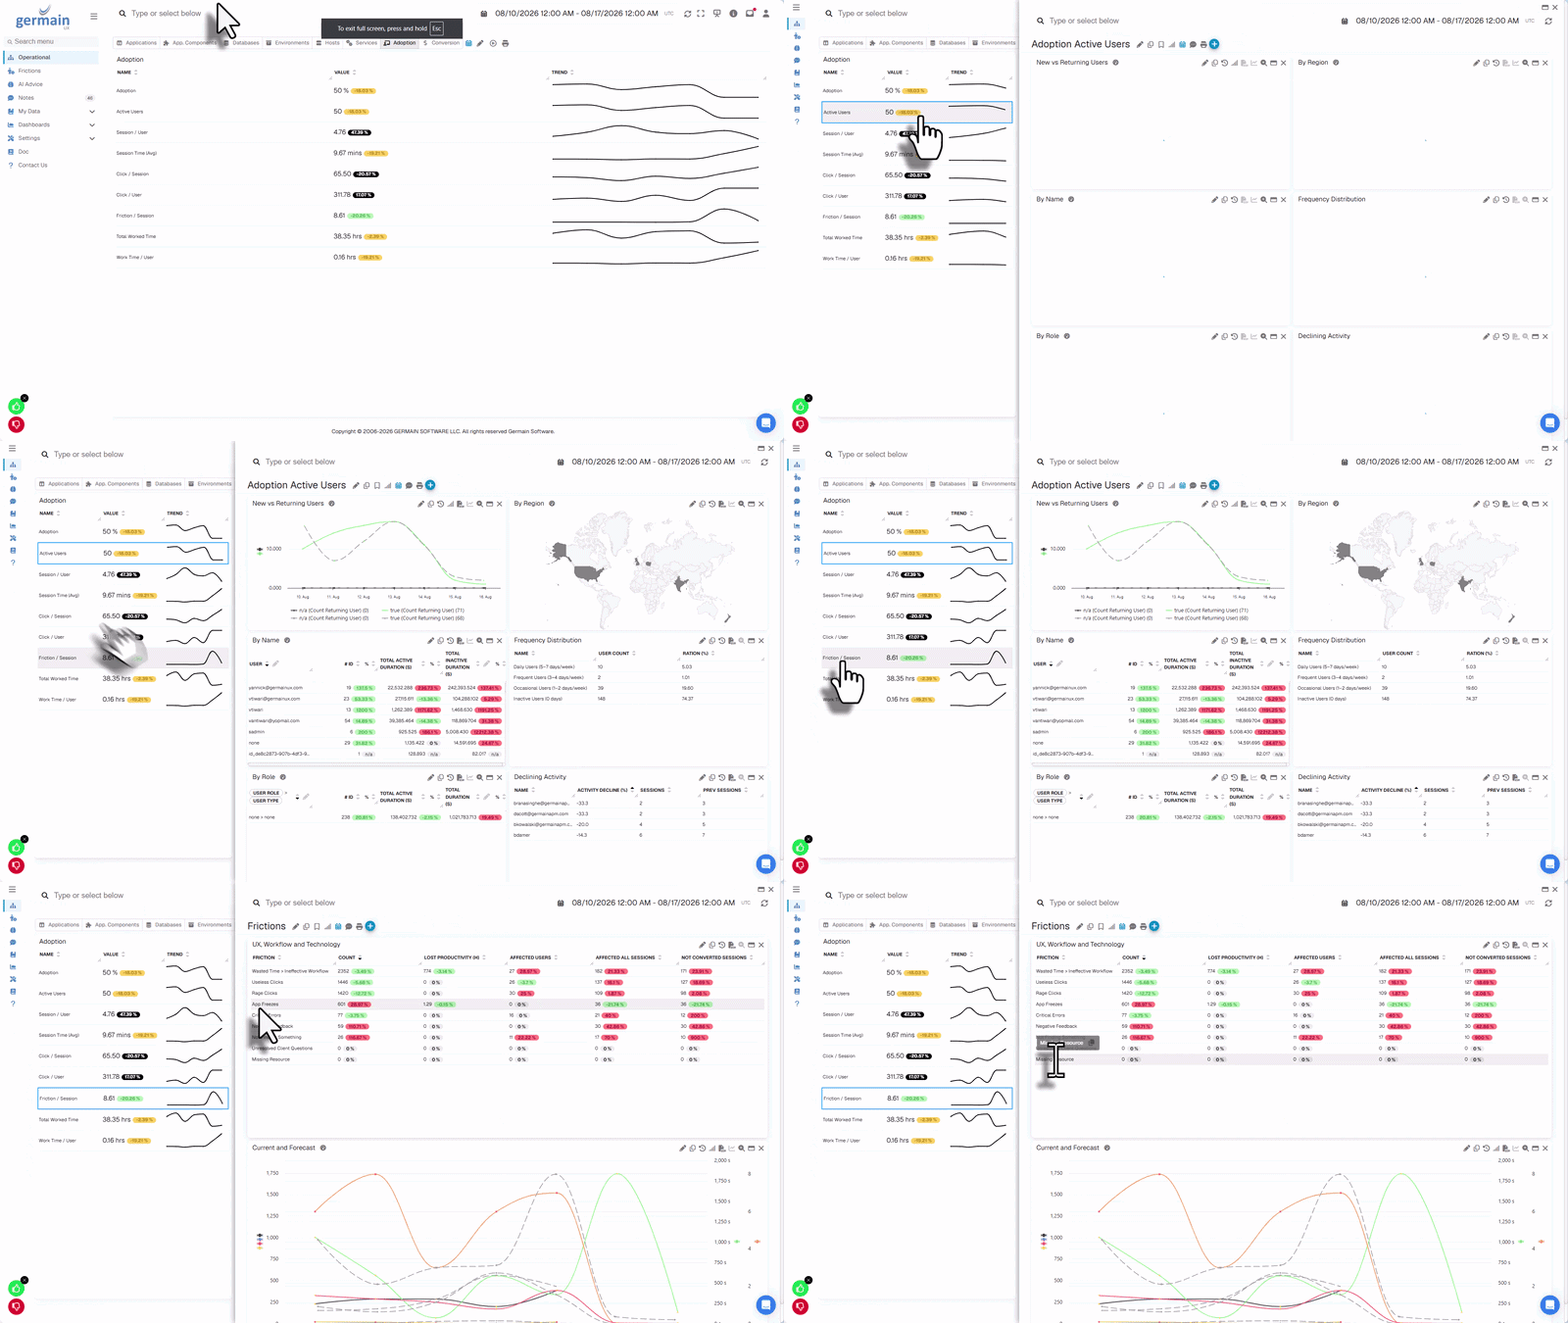
Business outcomes
GermainUX helps organizations:
-
Identify the UX, workflow, and technology issues affecting users.
-
Reproduce reported issues using searchable, millisecond-precise Session Replay.
-
Improve conversion, adoption, and employee productivity.
-
Detect errors, slowdowns, browser freezes, and failed requests in real time.
-
Quantify affected users, sessions, transactions, and business processes.
-
Prioritize improvements according to their actual user and business impact.
-
Reduce the time required to investigate and resolve application issues.
-
Detect critical failures proactively with synthetic user scenarios.
-
Trigger notifications or approved automated actions when defined conditions occur.
Real User Monitoring and Session Replay
GermainUX records and analyzes authorized user activity within the HTML or jQuery application.
Depending on the monitoring and privacy configuration, GermainUX can capture:
-
Pages, navigation, and application states
-
Clicks, mouse movements, scrolling, and keyboard activity
-
Form interactions and selections
-
User-visible messages and validation events
-
Business-process milestones
-
JavaScript console events and errors
-
HTTP requests and responses
-
Page and resource performance
-
Browser freezes and JavaScript long tasks
-
Popups and browser dialogs
-
Application, browser, operating-system, and device metadata
Every captured event remains timed, structured, and searchable. Investigators can move directly from an insight or error to the relevant moment in the user’s Session Replay.
Automated friction detection
GermainUX automatically detects browser and user-experience conditions that may affect an HTML or jQuery application.
|
Area |
Examples |
|---|---|
|
UX friction |
Rage clicks, dead clicks, error clicks, repeated actions, confusing navigation, and ineffective interactions |
|
Workflow friction |
Repeated steps, excessive duration, abandonment, incomplete processes, and lost productivity |
|
Errors |
JavaScript errors, unhandled promise rejections, console errors, user-visible failures, and failed network requests |
|
Performance |
Slow pages, slow resources, long tasks, browser freezes, excessive memory usage, and slow services |
|
Network |
Failed requests, slow requests, HTTP errors, unavailable endpoints, and dependency latency |
|
Compatibility |
Issues associated with a browser, browser version, device, operating system, or application release |
Standard insights are available after deployment. Custom KPIs, business processes, events, and analytical rules can be added when application-specific analysis is required.
HTML and jQuery usage analysis
GermainUX can analyze how users interact with HTML elements and jQuery-driven functionality, including:
-
Pages, menus, buttons, links, tabs, and dialogs
-
Forms, fields, dropdowns, and validation messages
-
Search, filtering, and navigation behavior
-
Feature and component adoption
-
User journeys and workflow progression
-
Time spent on individual steps
-
Successful, failed, and abandoned outcomes
-
Differences by user, role, browser, device, release, or another captured attribute
Custom application events can be sent to GermainUX when a business action cannot be identified reliably from standard browser activity.
JavaScript errors and console monitoring
GermainUX can capture and analyze:
-
Uncaught JavaScript exceptions
-
Handled errors explicitly reported by the application
-
Unhandled promise rejections
-
Console errors, warnings, and selected messages
-
Script and resource-loading failures
-
Error messages visible in the HTML interface
-
Errors associated with a user action or network request
See JavaScript Console and Error Monitoring and Unhandled Promise Rejection Monitoring.
Errors can be categorized and correlated with the affected user, session, page, workflow, browser, release, request, or supporting service.
JavaScript performance and profiling
The GermainUX JS Profiler provides deeper browser-side analysis for troubleshooting JavaScript execution and application behavior.
Depending on the application and deployed instrumentation, it can help identify:
-
Slow JavaScript execution
-
Long-running functions and call paths
-
Browser-main-thread blocking
-
JavaScript long tasks
-
Expensive event handlers
-
Excessive or repeated function execution
-
Memory growth and browser resource pressure
-
Slow application operations
-
JavaScript activity associated with an error or freeze
See JavaScript Long Task Monitoring and JavaScript and Page Memory Monitoring.
Detailed function-level profiling and jQuery component timing require the JS Profiler or appropriate custom instrumentation; they should not be inferred solely from standard page timings.
Page, element, and resource performance
GermainUX measures browser and user-perceived performance, including:
-
Page navigation and load timing
-
Core Web Vitals
-
Resource-loading performance
-
Element and custom performance marks
-
Server Timing values
-
JavaScript long tasks
-
Browser freezes
-
Network and service-response times
Related documentation:
Network and integration monitoring
GermainUX captures supported browser requests and associates them with the relevant user session and application activity.
This can help teams identify:
-
Slow or failed XHR and Fetch requests
-
HTTP status failures
-
Unavailable APIs
-
Dependency latency
-
Requests associated with an error or abandoned process
-
Differences between client-side and server-side duration
-
Integration failures visible through browser or backend telemetry
Request and response bodies should be captured only when required and authorized. Sensitive headers, authentication tokens, personal data, and payment information must be excluded or masked.
Backend API and integration visibility depends on the telemetry available from the corresponding services, logs, infrastructure, or databases.
Business-process monitoring
GermainUX can monitor configured journeys and workflows implemented by an HTML or jQuery application.
Examples include:
-
Registration and login
-
Search and product discovery
-
Form submission
-
Checkout and payment
-
Case or service-request creation
-
Approval workflows
-
Order or transaction completion
-
Employee operational processes
For each process, GermainUX can measure completion, duration, individual steps, repetition, abandonment, errors, and the number of affected users. Process events can also appear on the Session Replay timeline.
See Business Process and Workflow Mining.
Synthetic monitoring
The GermainUX RPA Bot Recorder can record critical HTML and jQuery user scenarios. The GermainUX Engine can then run those scenarios on a schedule to validate availability and performance before real users report a problem.
Synthetic scenarios can cover:
-
Application availability
-
Login
-
Search and navigation
-
Form submission
-
Critical business workflows
-
Checkout or transaction completion
-
Regression validation after a release
Synthetic monitoring verifies the configured scenario from the bot’s execution environment. It complements—but does not replace—Real User Monitoring across actual users, browsers, devices, locations, and workflows.
Backend and infrastructure monitoring
The GermainUX Engine can collect relevant backend telemetry when access is available, including:
-
Application and web-server logs
-
REST and SOAP APIs
-
Databases and queries
-
Integration services
-
Server, container, and cloud infrastructure
-
Scheduled jobs and background processes
-
Application-health endpoints
GermainUX can correlate this telemetry with browser activity when compatible timestamps, identifiers, and attributes are available.
The backend technologies supporting the HTML or jQuery application must be monitored through their corresponding GermainUX integrations. HTML and jQuery alone do not expose server CPU, memory, database, or application-log data.
Analytics and business impact
GermainUX can analyze HTML and jQuery telemetry across individual instances and the complete monitored population.
Teams can determine:
-
How many users and sessions were affected
-
Which browsers, devices, pages, releases, or user groups are most affected
-
Whether an issue is new, recurring, or increasing
-
Which errors or performance conditions correlate with abandonment
-
How much productivity, conversion, or processing time was lost
-
Whether a release improved or degraded the experience
-
Which issue should be addressed first
Relevant analytics include:
-
Conversion Insights
-
Error Analysis
-
Outlier and Anomaly Detection
-
Impact at Scale
-
KPIs, Pivots, and Measures
Alerts and automated actions
Detected conditions can trigger:
-
Email or SMS alerts
-
Watches for users interested in a specific existing insight
-
Scheduled reports
-
Webhooks or approved HTTP actions
-
Incident creation or enrichment
-
Diagnostic scripts
-
Authorized remediation workflows
See Automation.
Automated changes to a production application or service should use appropriate permissions, safeguards, validation, and operational approval.
Deployment options
|
Component |
Use |
|---|---|
|
Primary option when the monitoring script can be added to the HTML application |
|
|
Alternative when the application cannot be modified or monitoring must be centrally deployed through managed browsers |
|
|
Deeper browser-side JavaScript execution and troubleshooting evidence |
|
|
Backend, log, API, database, infrastructure, synthetic-monitoring, and automation use cases |
|
|
Records synthetic user scenarios executed by the Engine |
Not every deployment requires every component. Select components according to the application architecture and desired monitoring depth.
Privacy and security
HTML applications may display credentials, personal information, payment data, health information, or confidential business content.
Before production deployment:
-
Define which applications, pages, and environments may be monitored.
-
Mask, anonymize, or exclude sensitive fields and content.
-
Exclude passwords, authentication tokens, and security secrets.
-
Review the capture of request headers, parameters, and bodies.
-
Restrict access to Session Replay and monitoring data.
-
Configure appropriate consent and retention policies.
-
Validate the privacy configuration in a non-production environment.
See Data Privacy.
Deployment and configuration
|
For your HTML or jQuery application |
|---|
|
Deploy GermainUX RUM JS when the application can include the monitoring script. |
|
Deploy the GermainUX RUM Extension when direct script deployment is unavailable. |
|
Deploy the GermainUX JS Profiler when deeper JavaScript analysis is required. |
|
Configure User Session Monitoring and Replay, including privacy and retention requirements. |
|
Configure application-specific business processes and workflows when required. |
|
Deploy the GermainUX Engine for backend monitoring, synthetic execution, integrations, and automation. |
|
Use the GermainUX RPA Bot Recorder to create synthetic user scenarios. |
|
Review the available Browser Monitoring KPIs. |
|
Review the Browser Monitoring APIs for custom application events and instrumentation. |
ℹ️ Get Help
The Germain Team can help you set this up. Contact GermainUX Support.
Component: Engine, JS Profiler, Mobile, RPA Bot Recorder, RUM JS, RUM Extension
Feature Availability: 2017.1 or later