
🚀 Deploy Monitoring for Kubernetes
Deploy Kubernetes monitoring with the GermainUX Engine to continuously monitor the health, availability, and performance of your Kubernetes environment.
The easiest way to configure Kubernetes monitoring is through the GermainUX Kubernetes Wizard.
✨ Deploy via GermainUX Wizard
From GermainUX Workspace, navigate to:
Left Menu → Settings → Wizards → Kubernetes
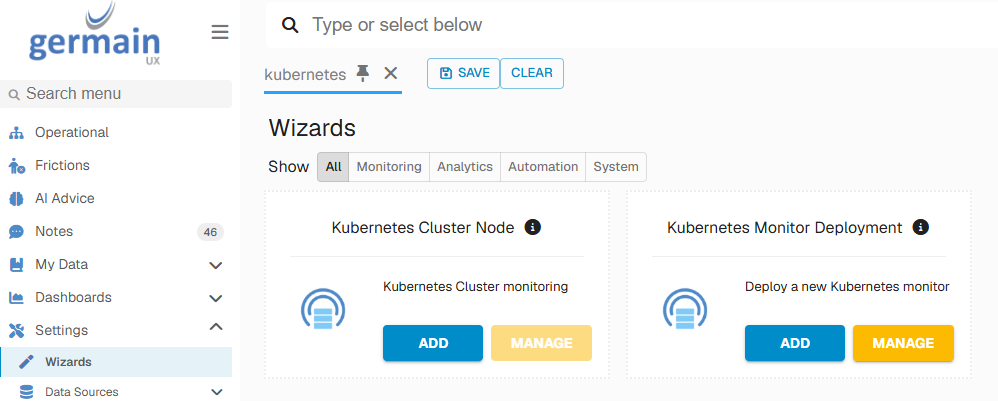
The wizard guides you through connecting GermainUX to your Kubernetes cluster and configuring the initial monitoring settings.
🖥️ 1. Select the Monitoring Server
Select the server that will be used by the GermainUX Engine to monitor the Kubernetes cluster.
The selected server's hostname is used to establish the connection to the Kubernetes cluster.
Make sure the server:
|
Requirement |
|
|---|---|
|
1 |
Has a GermainUX Engine available |
|
2 |
Can reach the Kubernetes cluster |
|
3 |
Has network access to the configured Kubernetes endpoint and port 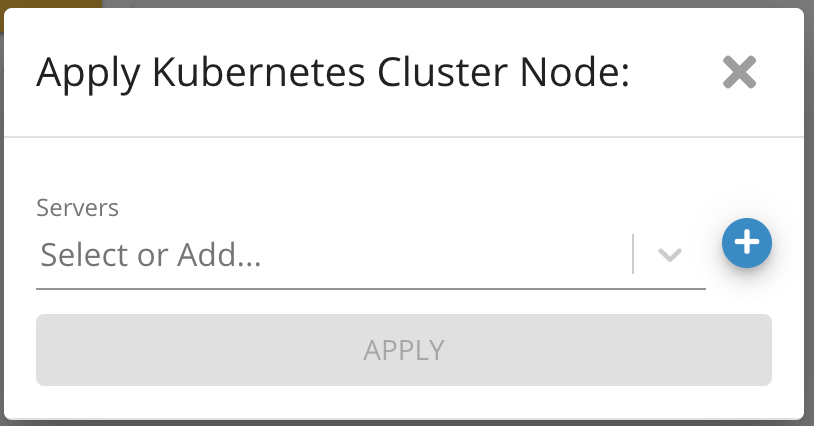
|
🏷️ 2. Select the Application
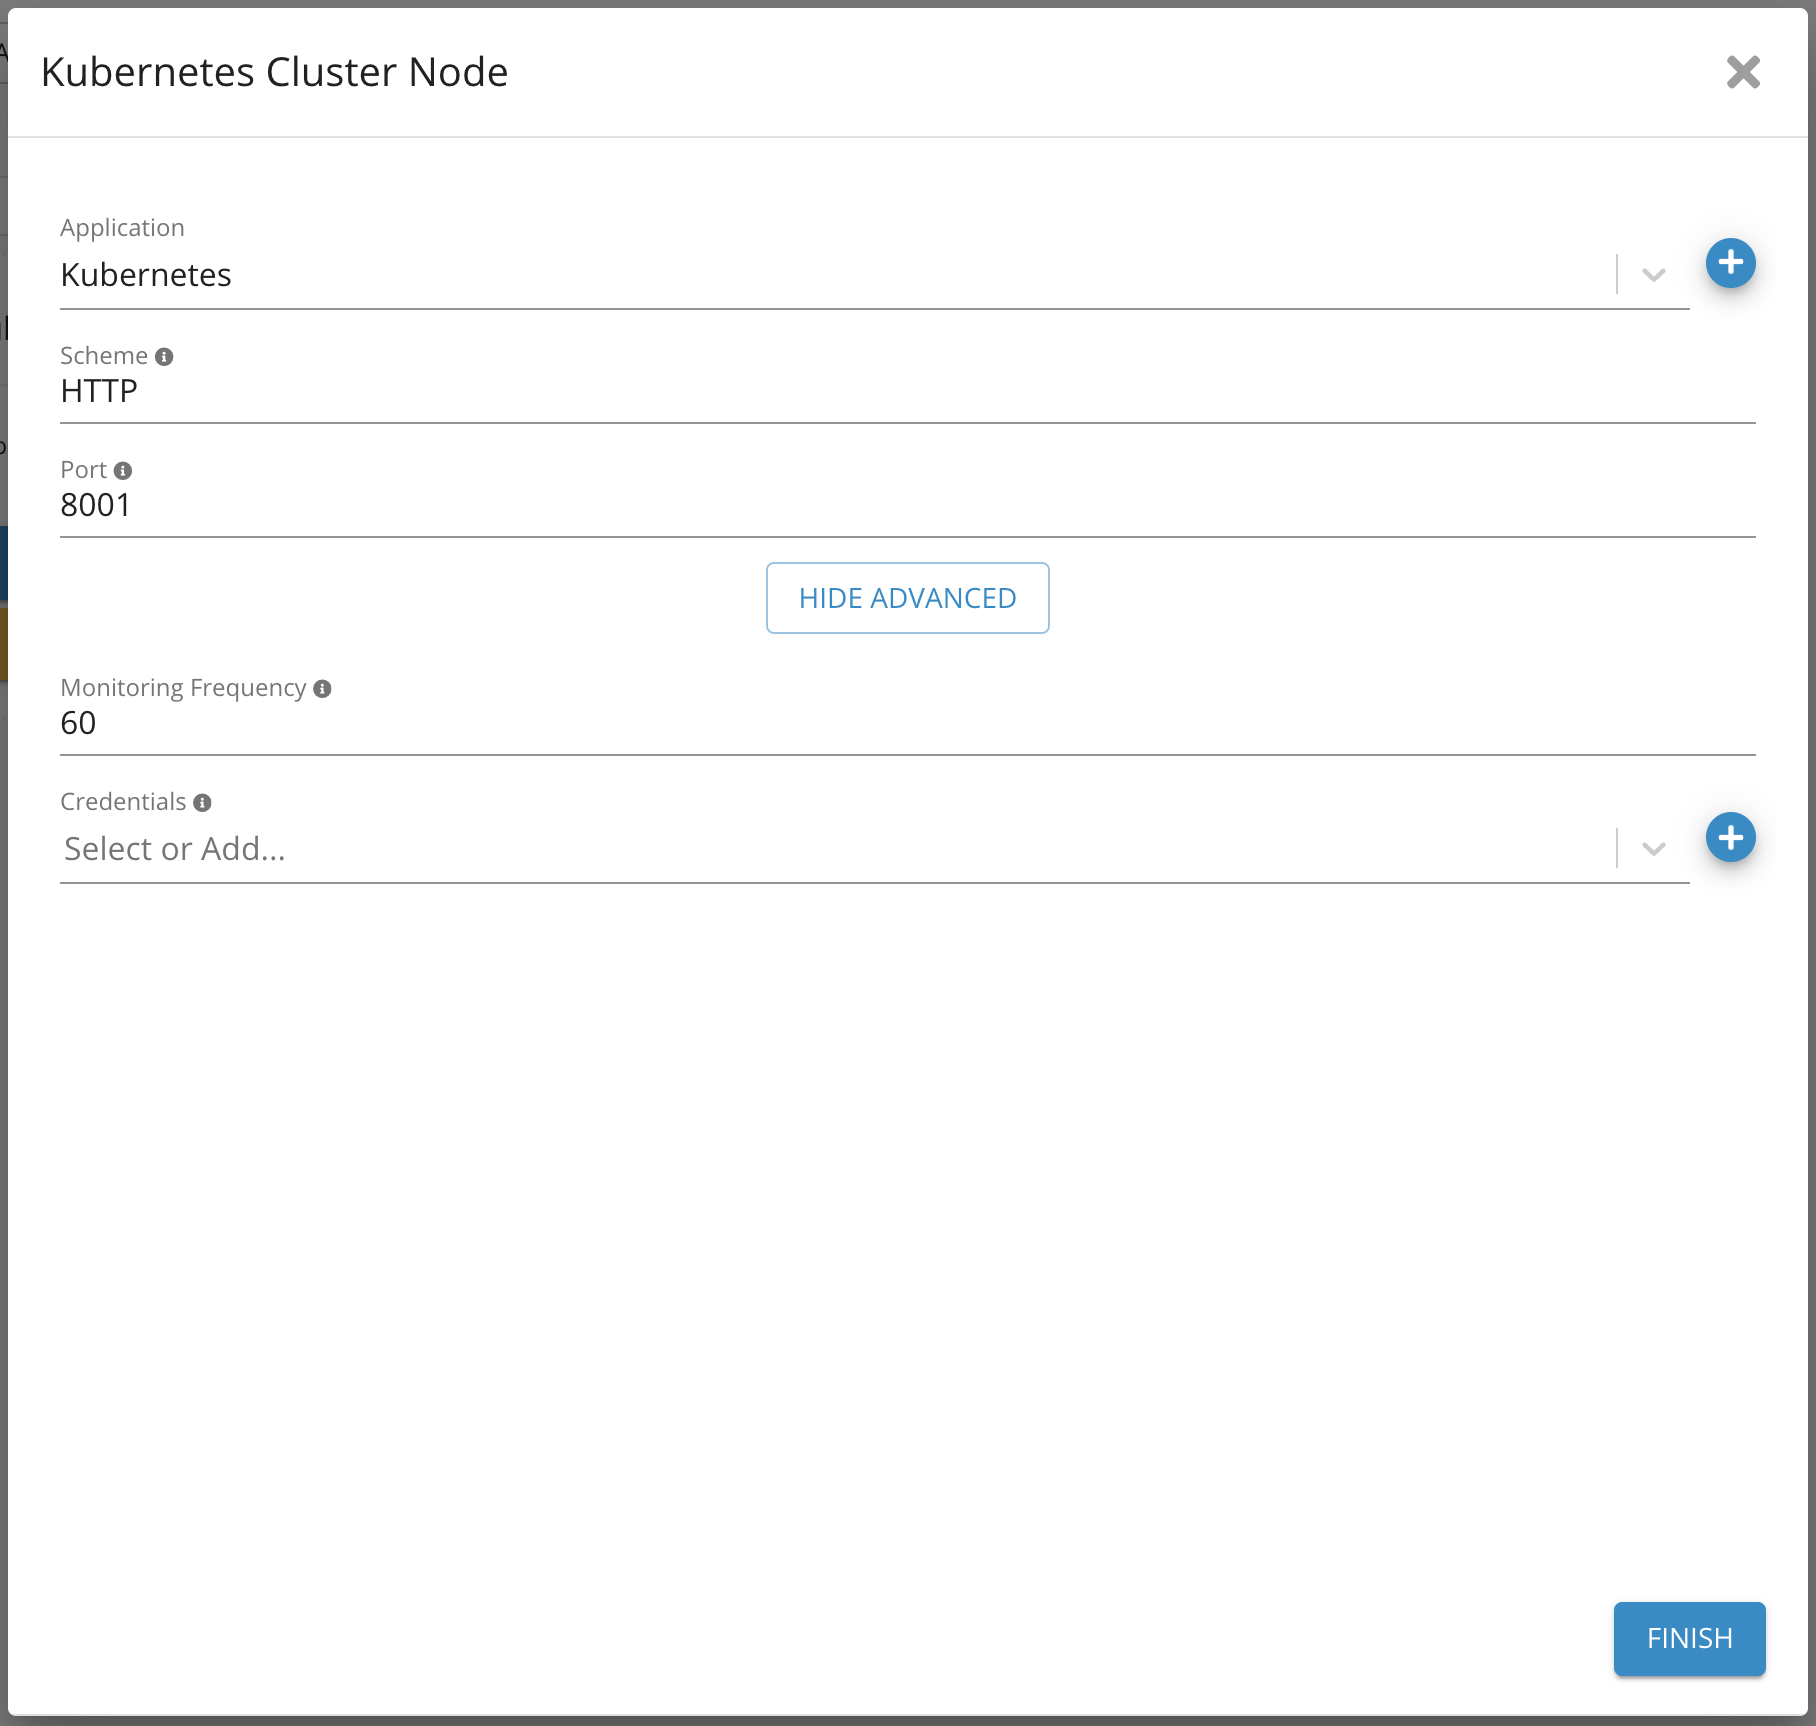
Select the Application that the Kubernetes environment should be associated with in GermainUX.
If an appropriate application does not already exist, click the + icon to create one.
The application label helps organize and correlate Kubernetes telemetry with other application, infrastructure, and user-experience data monitored by GermainUX.
🔗 3. Configure the Kubernetes Connection
Enter the connection information for the Kubernetes cluster.
🔑 Scheme
Select the protocol used to connect to the Kubernetes cluster:
HTTP or HTTPS
HTTPS should be used when required by your Kubernetes environment.
💿 Port
Enter the port used to connect to the Kubernetes cluster.
The selected GermainUX Engine must be able to reach the Kubernetes endpoint on this port.
🔒 Credentials
Provide the credentials required to connect to and monitor the Kubernetes cluster.
Use credentials with the appropriate permissions for the Kubernetes resources and metrics you want GermainUX to monitor.
⏱️ 4. Configure the Monitoring Frequency
Define how frequently GermainUX should collect Kubernetes monitoring data.
Default: 60 seconds
Adjust the monitoring frequency based on your operational requirements and environment.
A shorter interval provides more granular visibility, while a longer interval reduces monitoring frequency and data volume.
✅ 5. Apply the Configuration
Review the Kubernetes configuration and apply it.
Once configured, the GermainUX Engine begins collecting Kubernetes telemetry according to the selected monitoring frequency.
Verify that Kubernetes data is being received and that the expected clusters, nodes, pods, and containers are visible in GermainUX.
📊 6. Configure Analytics & Alerts
Once monitoring is active, configure the KPIs, dashboards, reports, and alerts appropriate for your Kubernetes environment.
For example, monitor and alert on:
|
Metric |
|---|
|
Kubernetes component availability |
|
Container health |
|
Container restarts |
|
Container CPU and memory |
|
Pod health and availability |
|
Node CPU and memory |
|
Kubernetes server health |
Alert thresholds, monitoring frequency, dashboards, and reports can be customized according to your operational requirements.
🤖 7. Configure Automation
GermainUX automation can be used to trigger actions when specific Kubernetes conditions are detected.
For example:
Detect Issue → Alert Team → Create Ticket → Trigger Action
Depending on the use case, actions can include notifications, ticket creation, scripts, programs, HTTP or SSH execution, and other operational workflows.
Automated remediation can also be configured for appropriate, well-understood conditions.
☸️ Deploy GermainUX within Kubernetes
GermainUX can also be configured to run within a Kubernetes container.
Contact the GermainUX team if you need assistance deploying GermainUX within your Kubernetes environment.
📦 Additional Resources
-
Deploy Monitoring or automation for Kubernetes.
-
AI Insights & Recommendations
-
More Analytics Features
-
More Automation Features
ℹ️ Get Help
The Germain Team can help you set this up. Contact GermainUX Support.
Component: Engine
Feature Availability: 2022.3 or later