Features
Germain UX offers various ways to analyze user behavior:
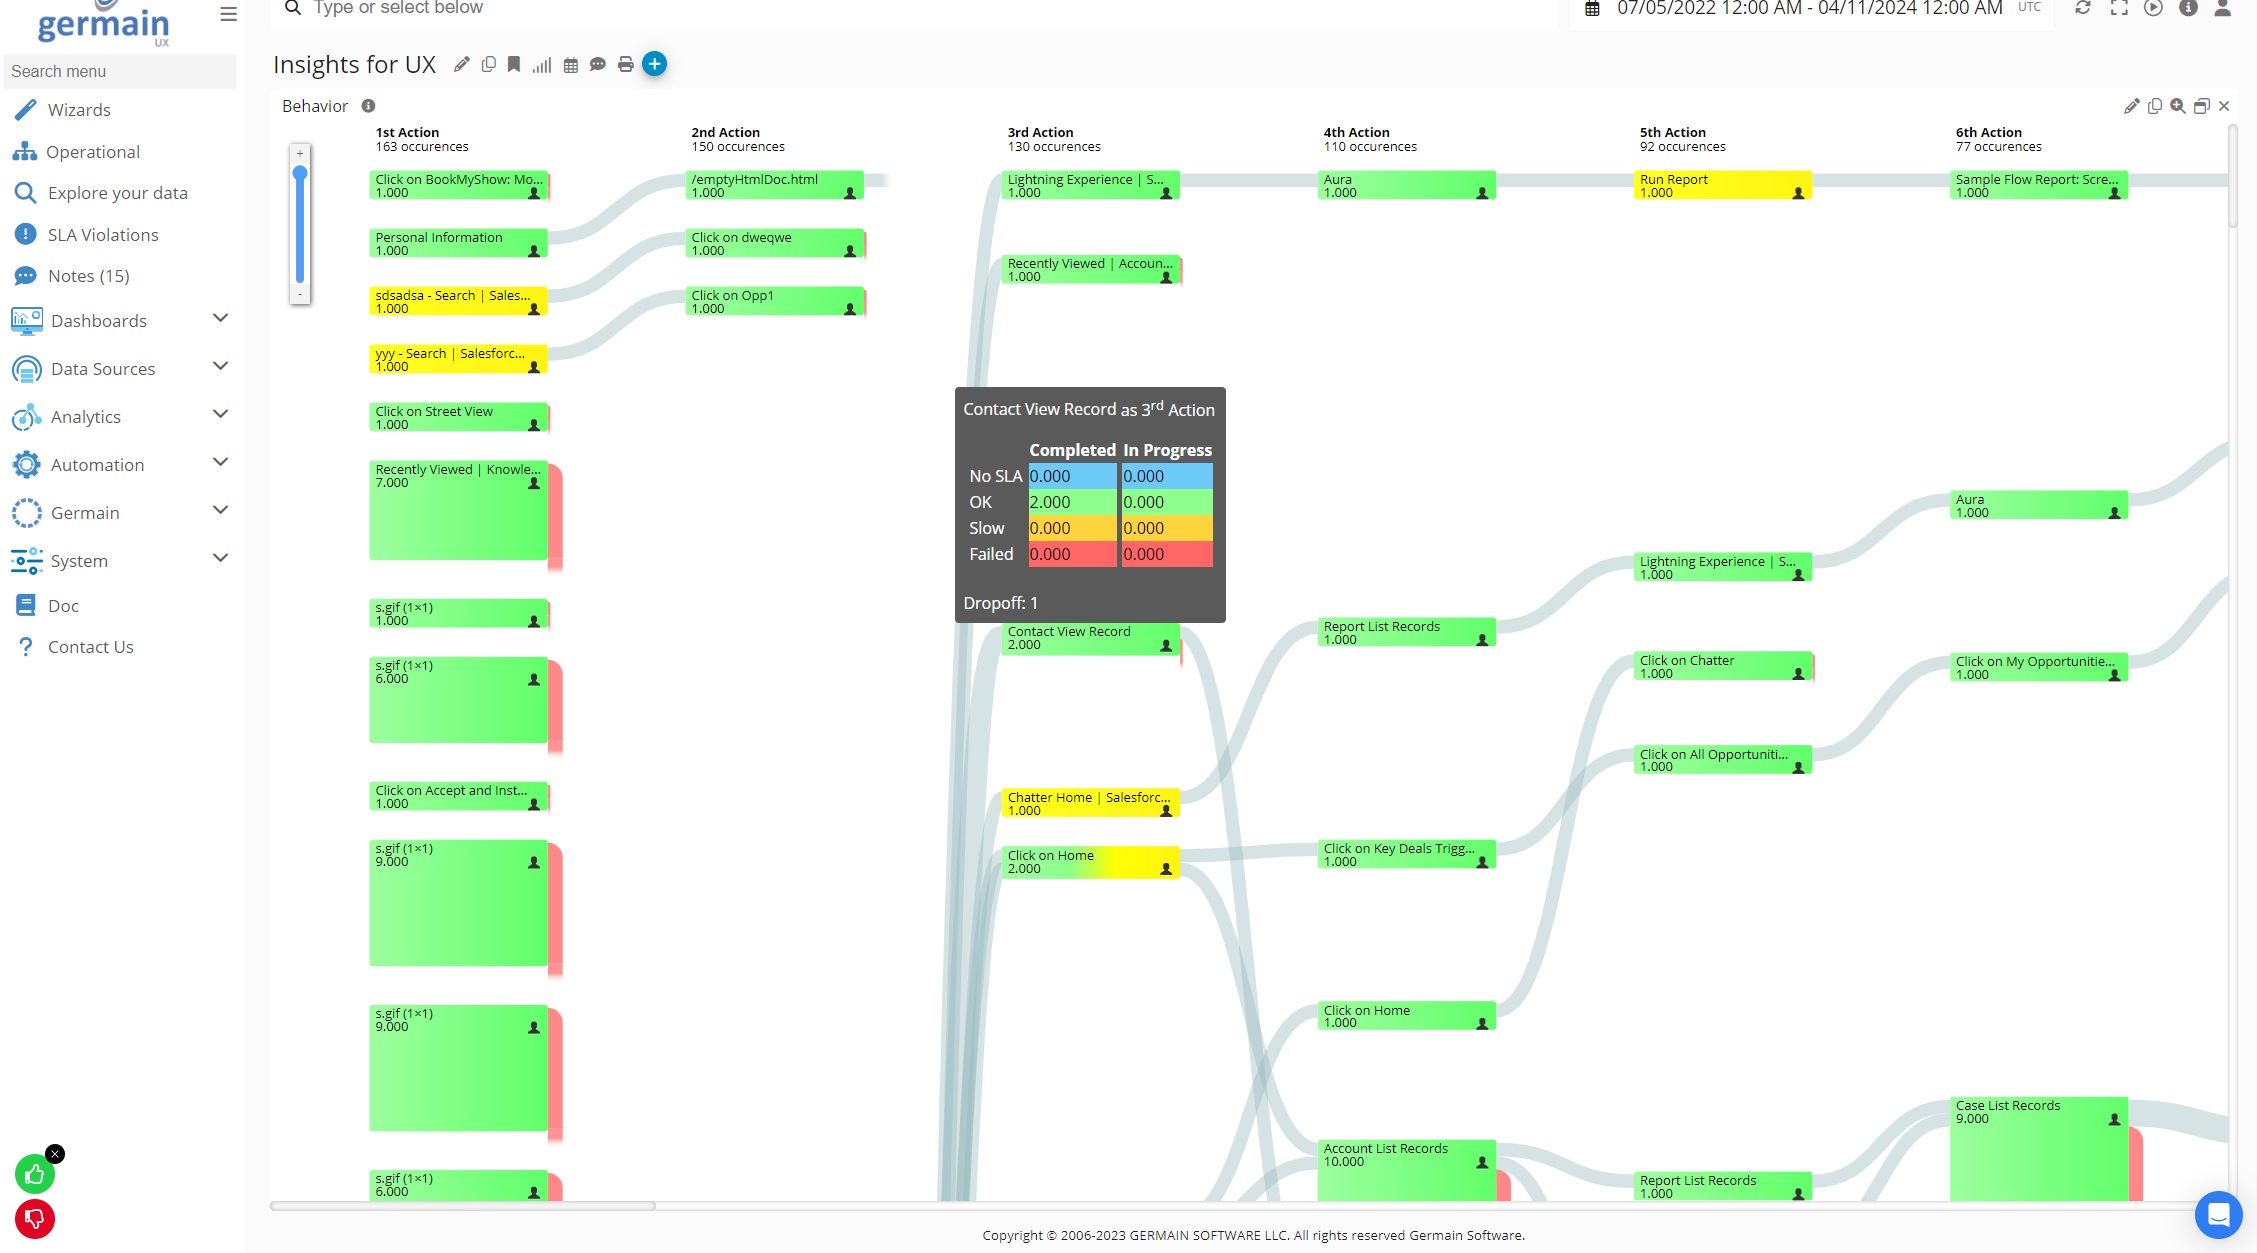
Click Analysis
The click-level view helps understand user actions from a click perspective.
Flow Analysis
Focused Flow diagnoses user behavior, identifies friction points, and breaks down journey milestones at scale.
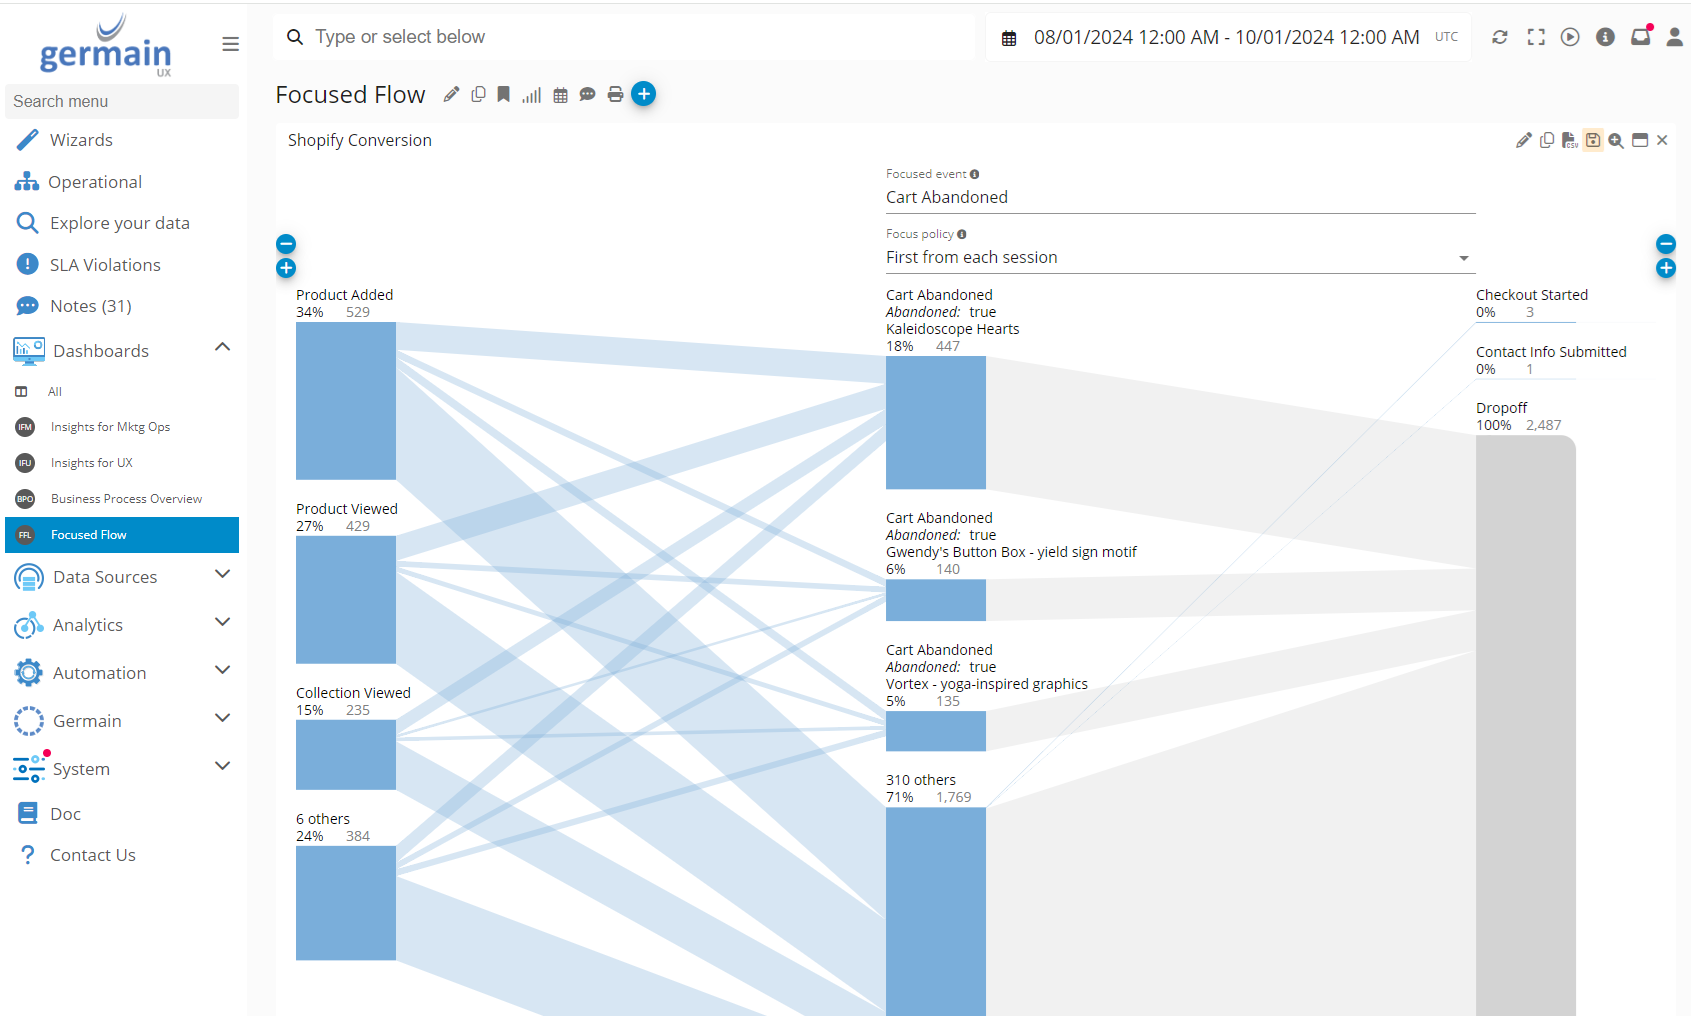
More details on Focused Flow portlet.
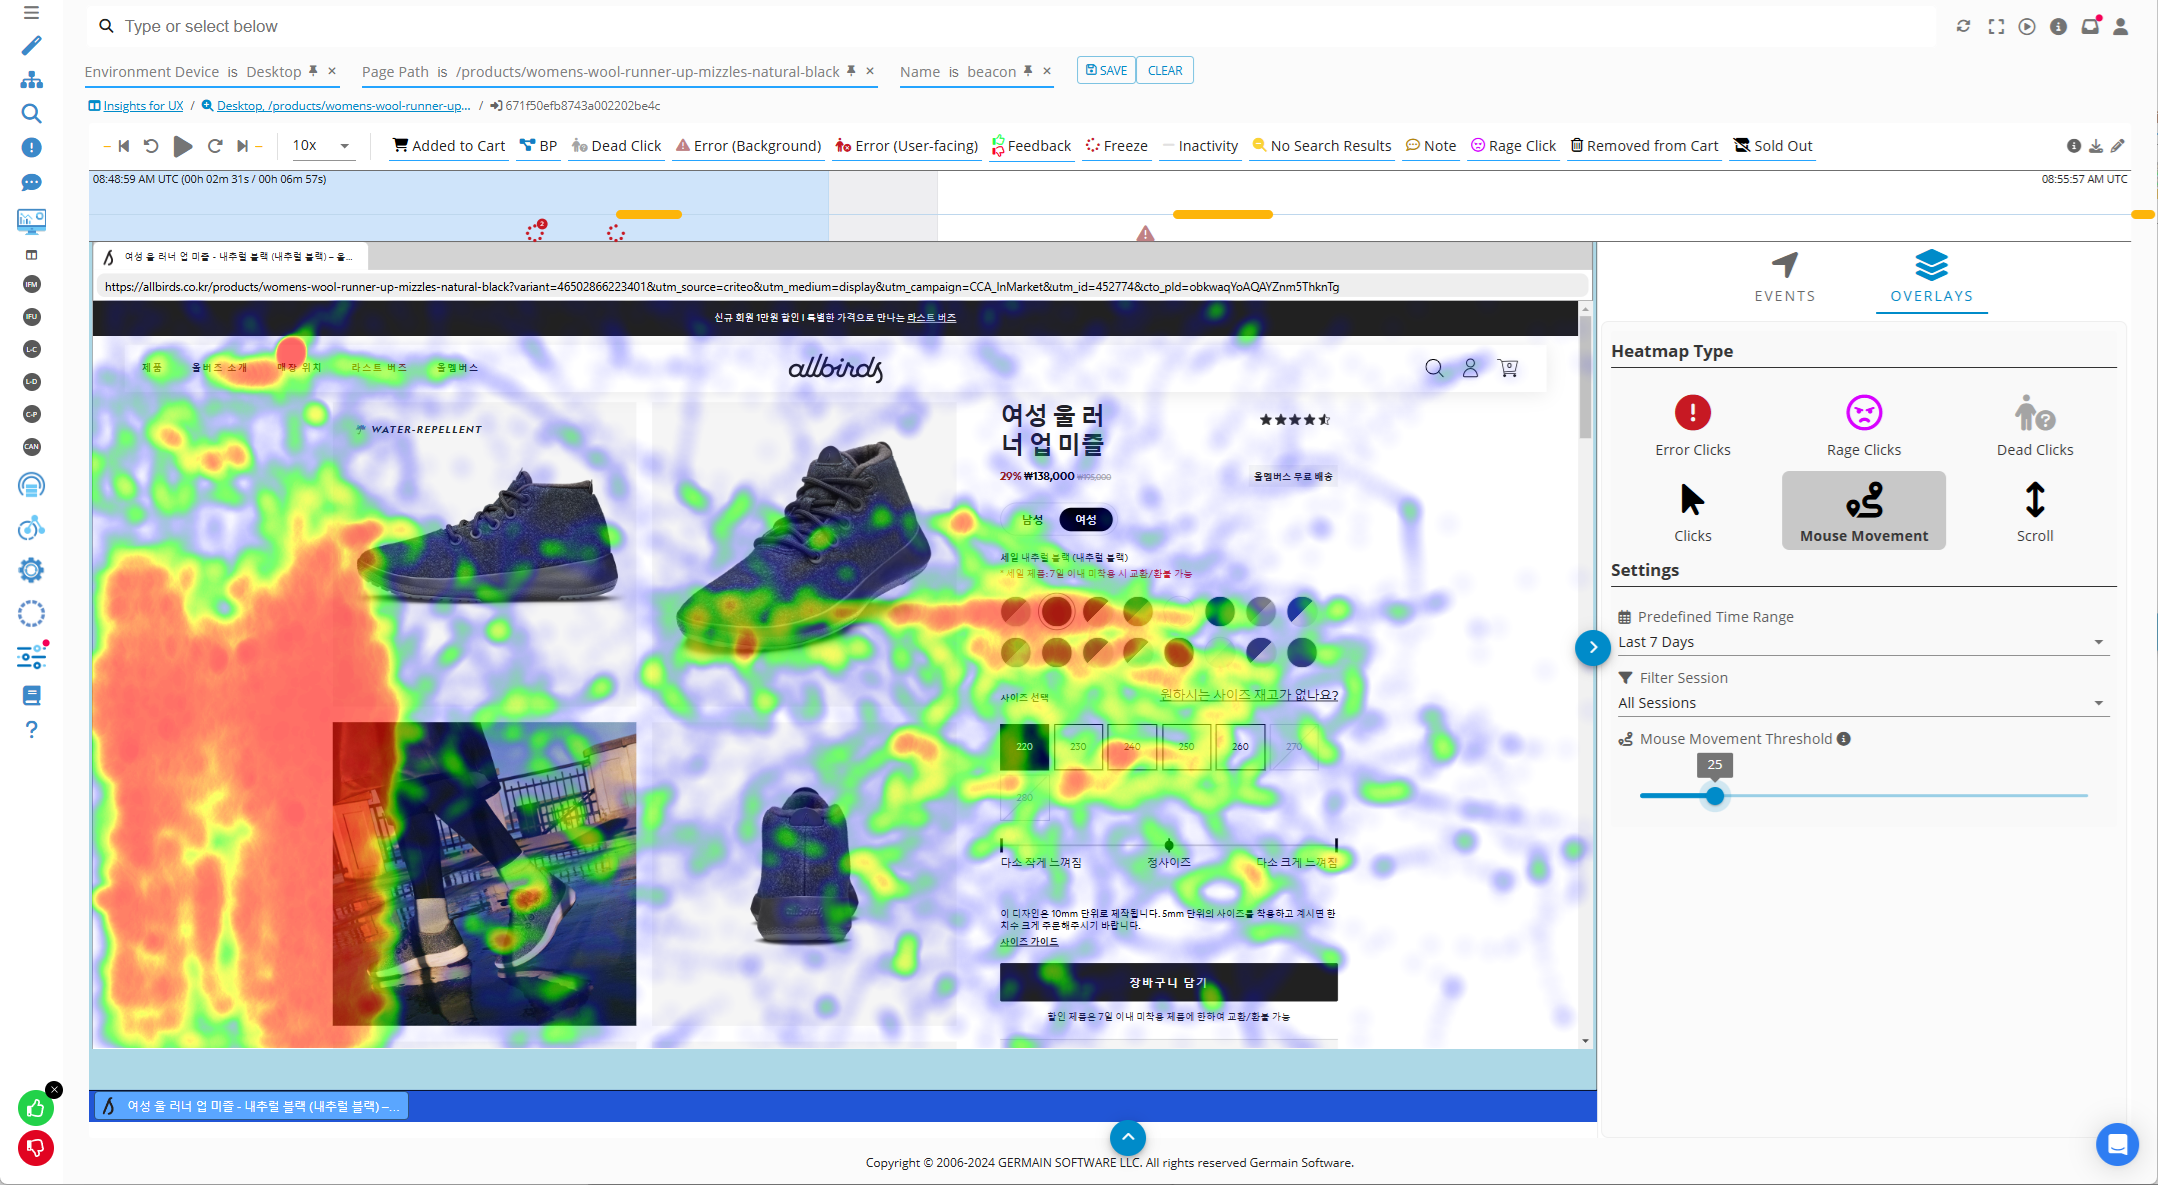
Page Insights via Heatmaps
Multiple heatmaps are available to show where visitors spend the most time or encounter the most issues on a page. Learn more about Heatmaps.
User Session Insights
Germain UX provides millisecond-precise, searchable playback of user interactions, similar to video recordings, capturing exactly what users see and do in an application.
More details Germain’s Real User Session Monitoring and Session Replay, in real-time.
Work Time Mining
Germain UX can track when users work on tasks and identify where they waste time, either individually or as a team.
Here are more details on Germain UX’s Business Process Monitoring and Mining.
Service: Analytics
Feature Availability: 8.6.0 or later