
Genesys CTI Monitoring
GermainUX monitors the availability, performance, user experience, integrations, and supporting infrastructure of Genesys contact-center environments.
It combines Genesys operational data with agent-workspace monitoring to help teams understand both what occurred during a customer interaction and which application, workflow, or technology problem affected the agent.
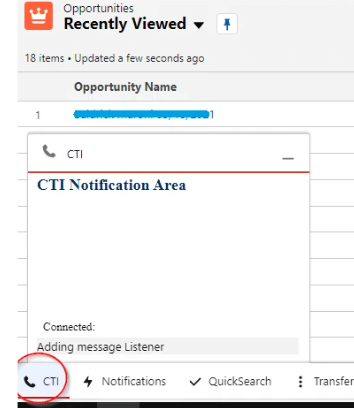
Supported Genesys environments
Depending on architecture and available interfaces, GermainUX can monitor:
-
Genesys Cloud.
-
Genesys Engage and supported on-premises components.
-
Browser-based Genesys agent interfaces.
-
Genesys Workspace Web Edition.
-
Supported Genesys native Windows clients.
-
Genesys Supervisor interfaces.
-
Genesys APIs and integrations.
-
CRM and other applications used alongside Genesys.
-
Supporting servers, databases, networks, and logs.
Monitoring coverage depends on Genesys licensing, API access, application architecture, permissions, and the GermainUX components deployed.
Monitoring components
|
Component |
Role |
|---|---|
|
Monitors approved Genesys APIs, services, servers, logs, integrations, reports, and automated workflows. |
|
|
Monitors Genesys-hosted browser interfaces and applications where direct JavaScript deployment is unavailable. |
|
|
Monitors customer-controlled browser applications within the Genesys agent workspace. |
|
|
Provides deeper JavaScript, browser, network, DOM, and resource diagnostics. |
|
|
GermainUX RUM Windows |
Monitors supported native Windows applications used in the agent workspace. |
|
Profiles supported Java, .NET, Go, or Node.js services participating in Genesys integrations when instrumentation is available. |
|
|
Records approved synthetic scenarios for agent login and supporting application workflows. |
Genesys operational monitoring
The GermainUX Engine can collect approved Genesys operational data through available APIs, reports, logs, and other supported interfaces.
Depending on the Genesys environment, this can include:
-
Agent state and availability.
-
Interaction or conversation identifiers.
-
Call and digital-interaction events.
-
Queue activity.
-
Routing events.
-
Transfers and escalations.
-
Login and logout activity.
-
Wrap-up or disposition activity.
-
Response and handling durations.
-
Integration events and failures.
-
Service and component availability.
GermainUX can only collect the operational data exposed by the configured Genesys interface and permitted by the monitoring account.
Genesys Cloud monitoring
For Genesys Cloud, GermainUX can combine:
-
Genesys API and integration data collected through the Engine.
-
Browser-agent experience collected through the RUM Extension.
-
Customer-controlled CRM and portal monitoring through RUM JS or the RUM Extension.
-
Deeper browser diagnostics through the JS Profiler.
-
Workflow analysis across Genesys Cloud and surrounding applications.
See Genesys Cloud Desktop Monitoring.
On-premises Genesys monitoring
For supported Genesys Engage or on-premises environments, the GermainUX Engine can monitor accessible:
-
Genesys services and processes.
-
Framework components.
-
Configuration Server.
-
Routing services.
-
Application and component logs.
-
Server and operating-system health.
-
Network endpoints.
-
Databases.
-
Integration services.
-
Custom application transactions.
Specific component monitoring depends on the Genesys version, operating system, data interfaces, and permissions.
System availability
GermainUX can monitor the availability of configured Genesys components and dependencies, including:
-
Genesys APIs.
-
Agent login endpoints.
-
Routing and configuration services.
-
Web applications.
-
Integration services.
-
Databases.
-
Authentication providers.
-
Supporting CRM and business applications.
Availability can be tested through API calls, HTTP requests, process or service checks, logs, queries, or approved synthetic scenarios.
Server and infrastructure performance
For on-premises or customer-managed Genesys components, GermainUX can monitor:
|
Area |
Examples |
|---|---|
|
CPU |
Usage, saturation, and queue length |
|
Memory |
Consumption, available memory, and pressure |
|
Disk |
Capacity, I/O, and latency when available |
|
Network |
Connectivity, throughput, and latency |
|
Processes and services |
Availability, restarts, failures, and resource consumption |
|
Logs |
Errors, warnings, routing failures, and component activity |
|
Database |
Availability, connections, query performance, capacity, and locks |
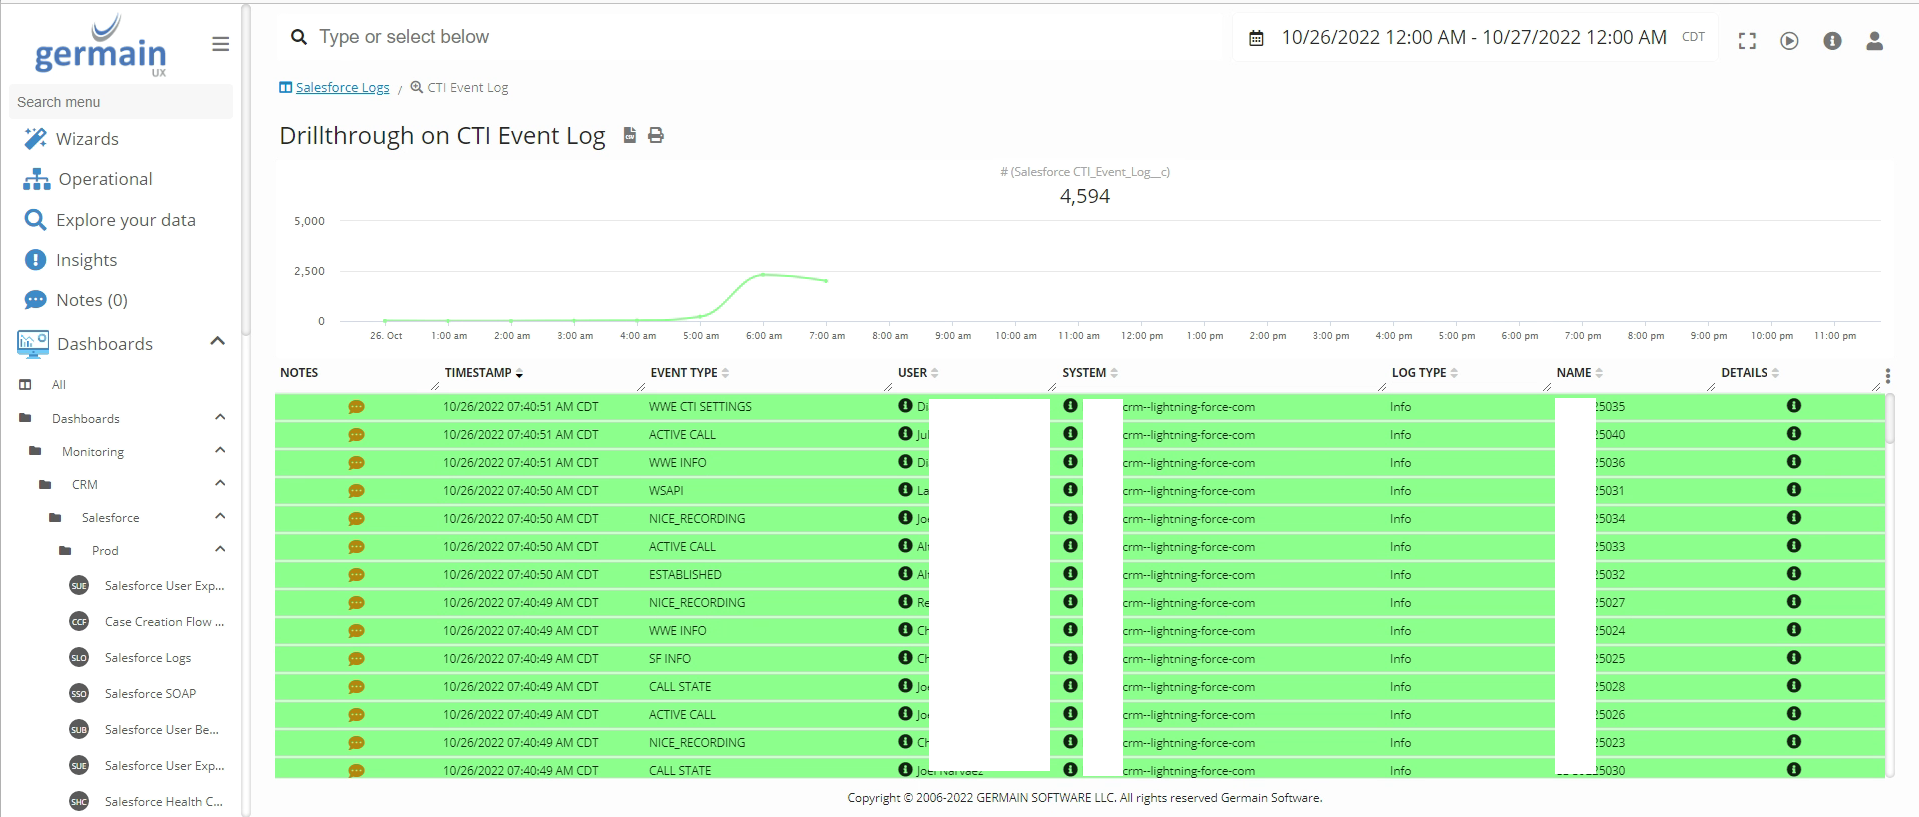
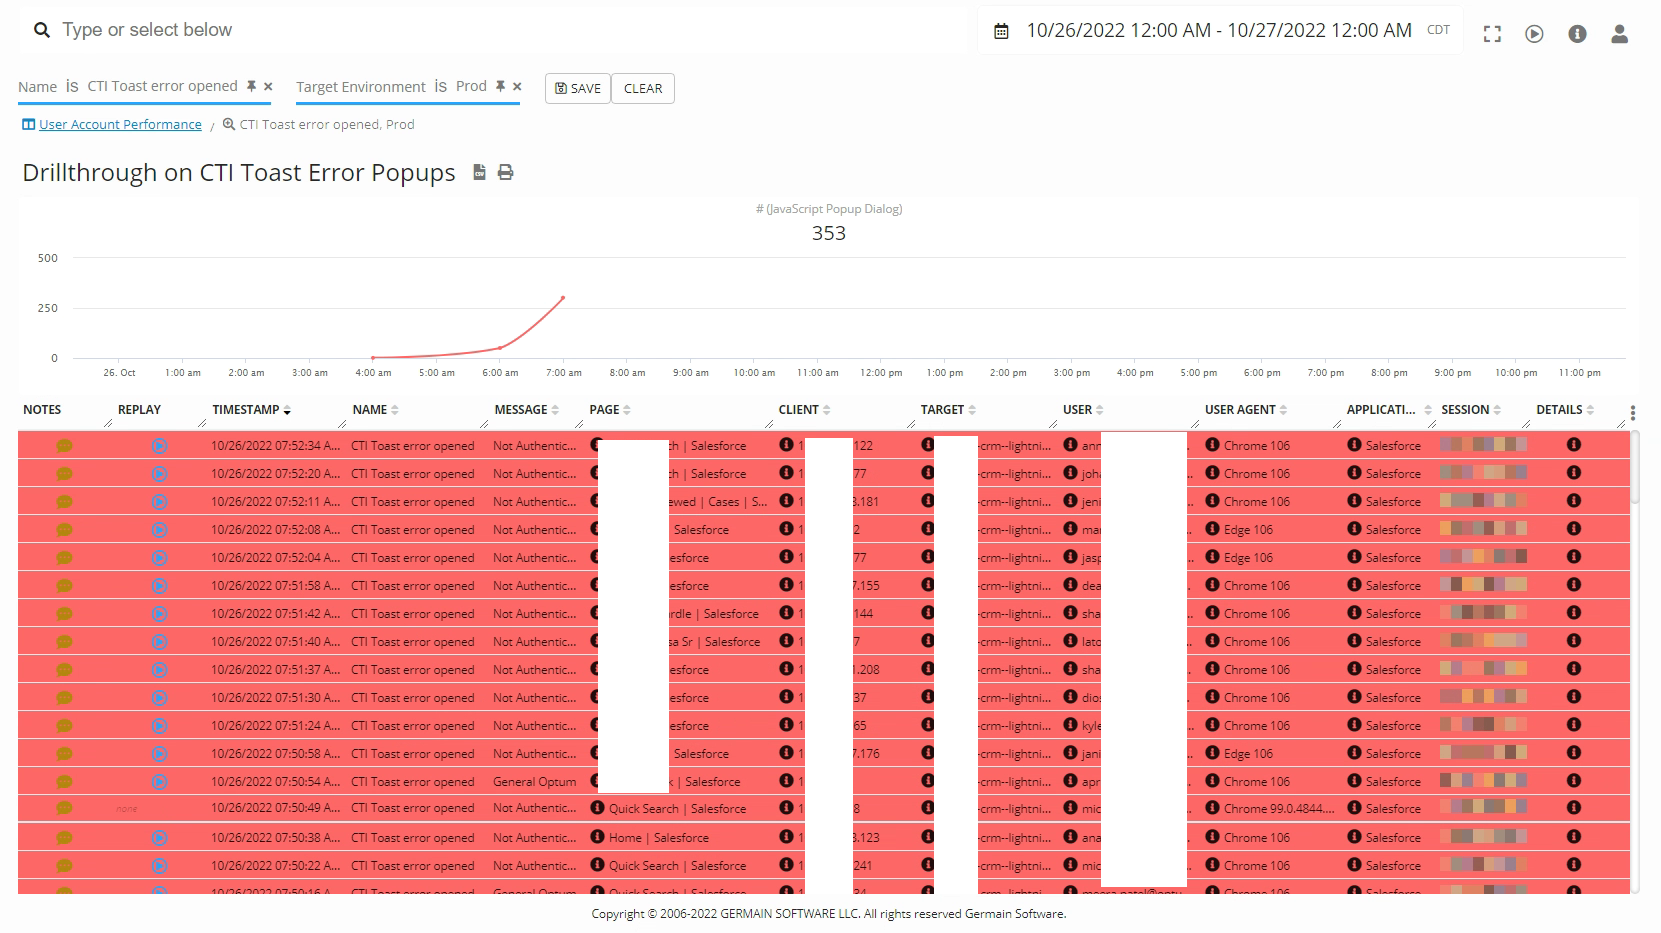
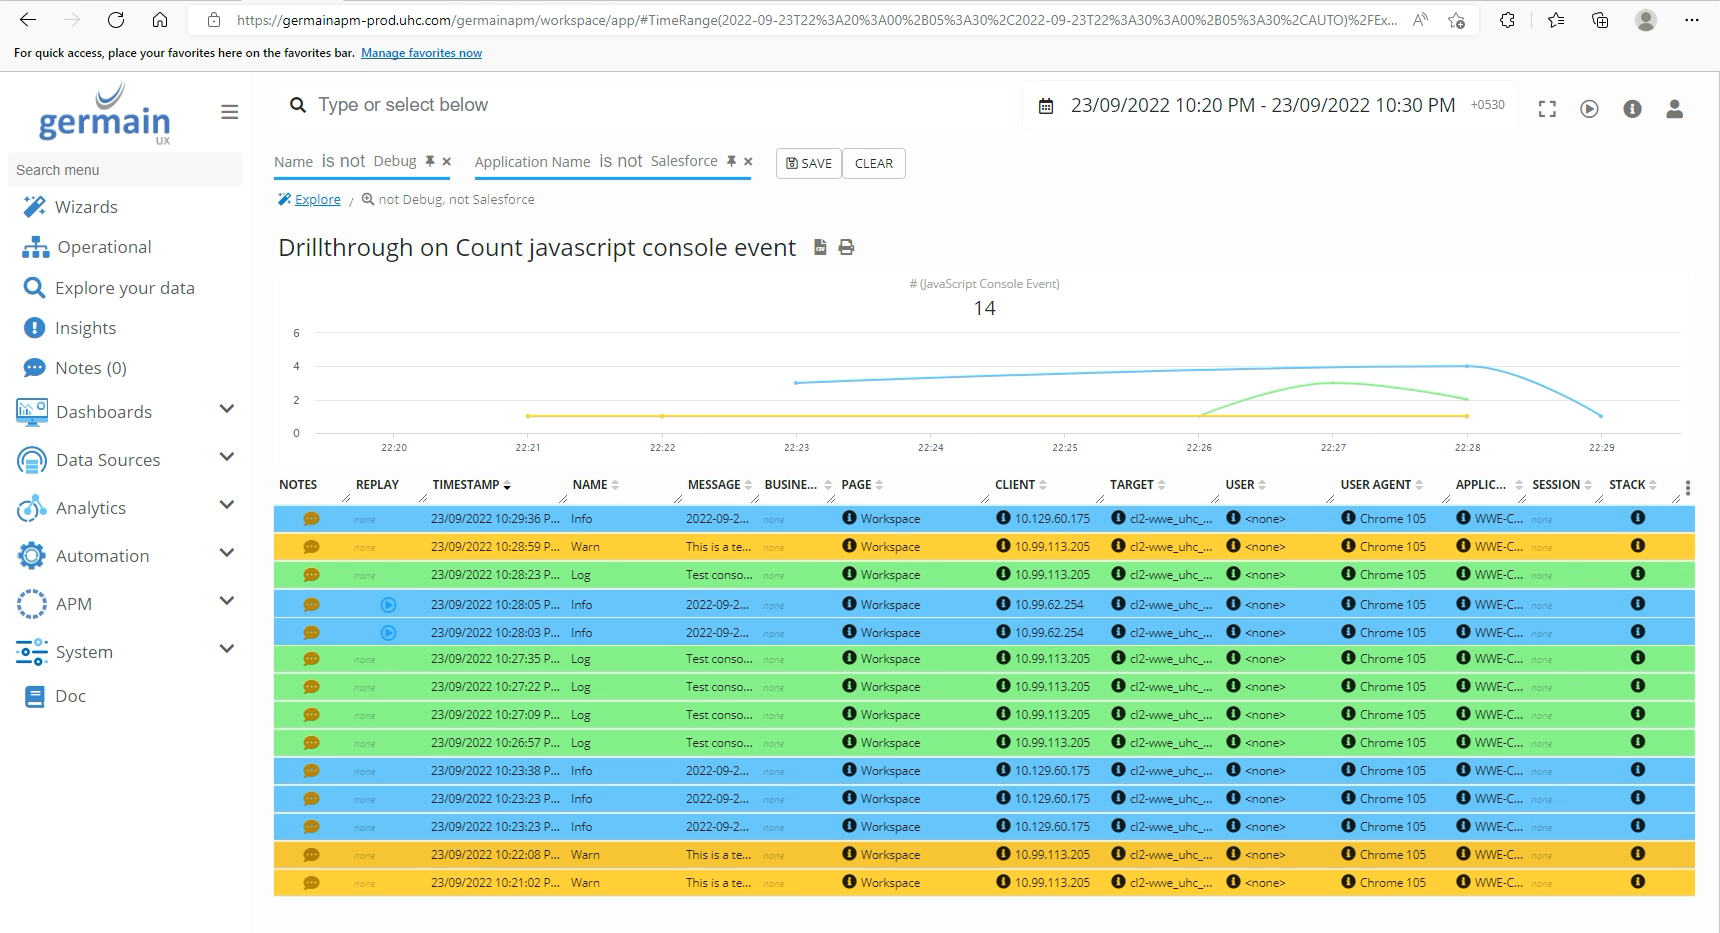
Infrastructure monitoring requires the GermainUX Engine and access to the relevant servers or monitoring interfaces.
Agent experience monitoring
GermainUX can monitor supported browser and Windows applications agents use while serving customers.
Depending on the application and deployed component, this can include:
-
Agent clicks and navigation.
-
Page and screen response time.
-
JavaScript errors.
-
Network failures.
-
Browser freezes and crashes.
-
Native application freezes and crashes.
-
Repeated, dead, and error clicks.
-
Workflow activity.
-
Application switching.
-
User sessions and Session Replay.
-
Application-specific events and transactions.
The RUM Extension is generally appropriate for Genesys-hosted browser interfaces. RUM JS is appropriate for applications the customer controls.
Agent-workspace monitoring
Agents commonly work across:
-
Genesys.
-
CRM applications.
-
Order-management systems.
-
Billing and payment applications.
-
Knowledge bases.
-
Customer portals.
-
Identity-verification tools.
-
Native Windows applications.
-
Custom web applications.
GermainUX can analyze workflows spanning these supported applications to identify:
-
Slow workflow steps.
-
Repeated searches and retries.
-
Application errors.
-
Failed integrations.
-
Excessive navigation.
-
Manual workarounds.
-
Long waiting periods.
-
Process deviations.
-
Training and adoption issues.
-
Lost productivity.
Session Replay
For supported applications, GermainUX Session Replay reconstructs the agent’s digital experience using structured telemetry.
Authorized teams can use it to understand:
-
What the agent did before an issue.
-
Which application or screen failed.
-
Whether the interface responded correctly.
-
Which errors or slow requests occurred.
-
Whether the agent repeated or abandoned a step.
-
How the problem affected the broader customer interaction.
GermainUX Session Replay complements Genesys voice, interaction, screen-recording, quality-management, and compliance capabilities. It does not replace them.
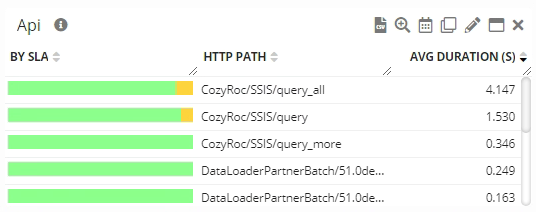
Integration monitoring
GermainUX can monitor integrations between Genesys and:
-
CRM systems.
-
Identity providers.
-
Customer-data platforms.
-
Order and billing systems.
-
Knowledge systems.
-
Workforce applications.
-
Web services and APIs.
-
Databases.
-
Third-party contact-center services.
Monitoring can include:
-
Availability.
-
Response time.
-
Errors.
-
Request volume.
-
Failed or delayed data exchanges.
-
Correlation with affected agents and interactions.
-
Server-side transaction or code evidence when supported.
Call routing and handling
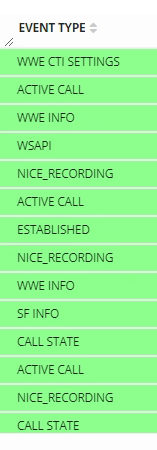
When the required Genesys data is available, GermainUX can analyze:
-
Queue activity.
-
Agent availability.
-
Routing events.
-
Transfers.
-
Escalations.
-
Response duration.
-
Interaction duration.
-
Wrap-up activity.
-
Failed or incomplete processing.
Genesys remains the authoritative source for telephony and contact-center metrics. GermainUX imports or correlates those metrics with user-experience and technical evidence.
Operational KPI correlation
Genesys or another approved system may provide metrics such as:
-
Average Handle Time.
-
First Contact Resolution.
-
Transfer rate.
-
Service level.
-
Agent occupancy.
-
Abandonment.
-
After-call work.
-
Customer satisfaction.
GermainUX can correlate imported operational metrics with:
-
Application performance.
-
Workflow duration.
-
Errors.
-
Integration failures.
-
Agent behavior.
-
Session Replay.
-
Infrastructure conditions.
GermainUX should not be described as independently calculating a Genesys KPI unless the required source data and formula have been configured.
Business-process monitoring
GermainUX can analyze supported Genesys and agent-workspace processes such as:
-
Agent login.
-
Customer identification.
-
Account verification.
-
Case creation.
-
Call transfer.
-
Escalation.
-
Order or billing assistance.
-
Knowledge search.
-
Disposition.
-
Wrap-up.
-
After-call work.
For each configured process, GermainUX can analyze:
-
Completion time.
-
Active and waiting time.
-
Repeated steps.
-
Drop-off.
-
Deviations.
-
Errors.
-
Affected agents and interactions.
-
Supporting application performance.
Business outcomes
Genesys CTI Monitoring helps organizations:
-
Detect Genesys and integration problems earlier.
-
Determine why contact-center operational metrics changed.
-
Identify application issues affecting agents.
-
Reduce time spent reproducing intermittent failures.
-
Improve agent productivity and application adoption.
-
Reduce unnecessary navigation and repeated work.
-
Identify workflow contributors to handling and wrap-up time.
-
Correlate technical failures with customer interactions.
-
Validate Genesys, CRM, workflow, and infrastructure changes.
-
Prioritize issues according to affected agents and business operations.
GermainUX supplies evidence for improving contact-center outcomes; it does not independently guarantee improvements to service level, AHT, FCR, transfer rate, or customer satisfaction.
Analytics
GermainUX can analyze Genesys data through KPIs, measures, pivots, trends, drill-through views, Session Replay, correlations, and outlier detection.
|
Analysis area |
Examples |
|---|---|
|
Availability |
Genesys services, APIs, applications, integrations, and dependencies |
|
Operations |
Agent, interaction, queue, routing, transfer, and wrap-up activity |
|
User experience |
Clicks, errors, frustration, freezes, and Session Replay |
|
Workflow |
Steps, duration, repetition, waiting, and deviations |
|
Performance |
Browser, API, application, server, database, and integration response |
|
Reliability |
Errors, crashes, disconnections, and failed transactions |
|
Impact |
Affected agents, interactions, applications, queues, and workflows |
|
Technical cause |
Browser, JavaScript, network, server, database, code, or infrastructure evidence |
Automated analysis
GermainUX can automatically:
-
Detect technology and performance anomalies.
-
Categorize recurring Genesys and application errors.
-
Identify newly observed failures.
-
Quantify affected agents and interactions.
-
Correlate operational changes with technical conditions.
-
Identify process inefficiency and drop-off.
-
Compare performance across agents, applications, releases, and environments.
-
Detect configured phrases or application messages.
Notifications and automation
GermainUX users can create Watches to receive notifications when existing Genesys insights meet conditions of interest.
Detected conditions can trigger approved actions such as:
-
Email or other configured notifications.
-
Reports.
-
HTTP requests or webhooks.
-
Incident-management integrations.
-
Diagnostic scripts.
-
API queries.
-
Service diagnostics.
-
Approved recovery workflows.
Actions that change Genesys configuration, routing, agent state, CRM data, services, or customer interactions require explicit authorization and appropriate safeguards.
Privacy and security
Genesys environments process customer and employee information that may be sensitive or regulated.
Before deployment:
-
Define the Genesys applications, users, and environments that may be monitored.
-
Use dedicated least-privilege API and server credentials.
-
Configure consent where required.
-
Mask sensitive fields and conversation content.
-
Exclude passwords, tokens, payment information, and authentication data.
-
Restrict access to Session Replay and interaction evidence.
-
Define retention.
-
Validate role-based access.
-
Confirm which Genesys identifiers may be stored.
-
Review API scopes and permissions.
-
Test masking and exclusions after application changes.
Voice or message content should only be collected when the relevant Genesys interface provides it and the organization has explicitly approved its use.
Deployment and configuration
|
For your Genesys environment |
|---|
|
Inventory the Genesys products, interfaces, servers, APIs, applications, integrations, and agent workflows. |
|
Deploy the GermainUX Engine for Genesys APIs, services, servers, logs, databases, integrations, reports, and automation. |
|
Deploy the GermainUX RUM Extension for Genesys-hosted browser interfaces. |
|
Deploy GermainUX RUM JS in customer-controlled web applications used by agents. |
|
Deploy the GermainUX JS Profiler for deeper JavaScript and browser diagnostics. |
|
Deploy GermainUX RUM Windows for supported native Windows applications. |
|
Deploy the GermainUX Code Profiler for supported integration services when code-level tracing is required. |
|
Deploy the GermainUX RPA Bot Recorder for approved synthetic login and workflow scenarios. |
|
Review Genesys Cloud Desktop Monitoring when monitoring Genesys Cloud agent environments. |
|
Configure common interaction, agent, user, application, and session identifiers for correlation. |
|
Configure Genesys and agent-workspace workflows, KPIs, SLAs, Watches, reports, and approved actions. |
|
Validate permissions, privacy, correlation, data accuracy, and monitoring overhead before production rollout. |
ℹ️ Get Help
The Germain Team can help you set this up. Contact GermainUX Support.
Component: Engine, JS Profiler, Mobile, RPA Bot Recorder, RUM JS, RUM Extension
Feature Availability: 2017.1 or later