
📊 Dashboards and Reports
GermainUX Dashboards and Reports provide real-time, role-appropriate access to monitored data, business and technical KPIs, operational status, investigation evidence, notes, tickets, and manually generated reports.
Users can move from an aggregated business or technical metric to its underlying dimensions, individual records, and root-cause evidence without leaving the GermainUX Workspace.
🎯 Business outcomes
|
Area |
Business outcome |
|---|---|
|
Application adoption |
Understand feature usage, user behavior, workflow completion, and the issues affecting CRM and application adoption. |
|
Employee productivity |
Identify slow, repetitive, ineffective, or failed workflows and quantify the resulting lost time. |
|
eCommerce conversion |
Track customer journeys, funnels, abandonment, product activity, checkout, and the issues affecting conversion and revenue. |
|
User and customer experience |
Visualize performance, errors, behavior, feedback, and friction across users, sessions, applications, and journeys. |
|
Application reliability |
Monitor availability, errors, performance, capacity, services, infrastructure, and integrations. |
|
Issue investigation |
Move from a high-level KPI to its dimensions, raw instances, relationships, traces, and supporting evidence. |
|
Operational communication |
Export, print, save, annotate, assign, and share relevant information with business and technical teams. |
|
Platform administration |
Review the health, configuration, usage, capacity, and operating state of GermainUX. |
🔎 Analytics dashboards
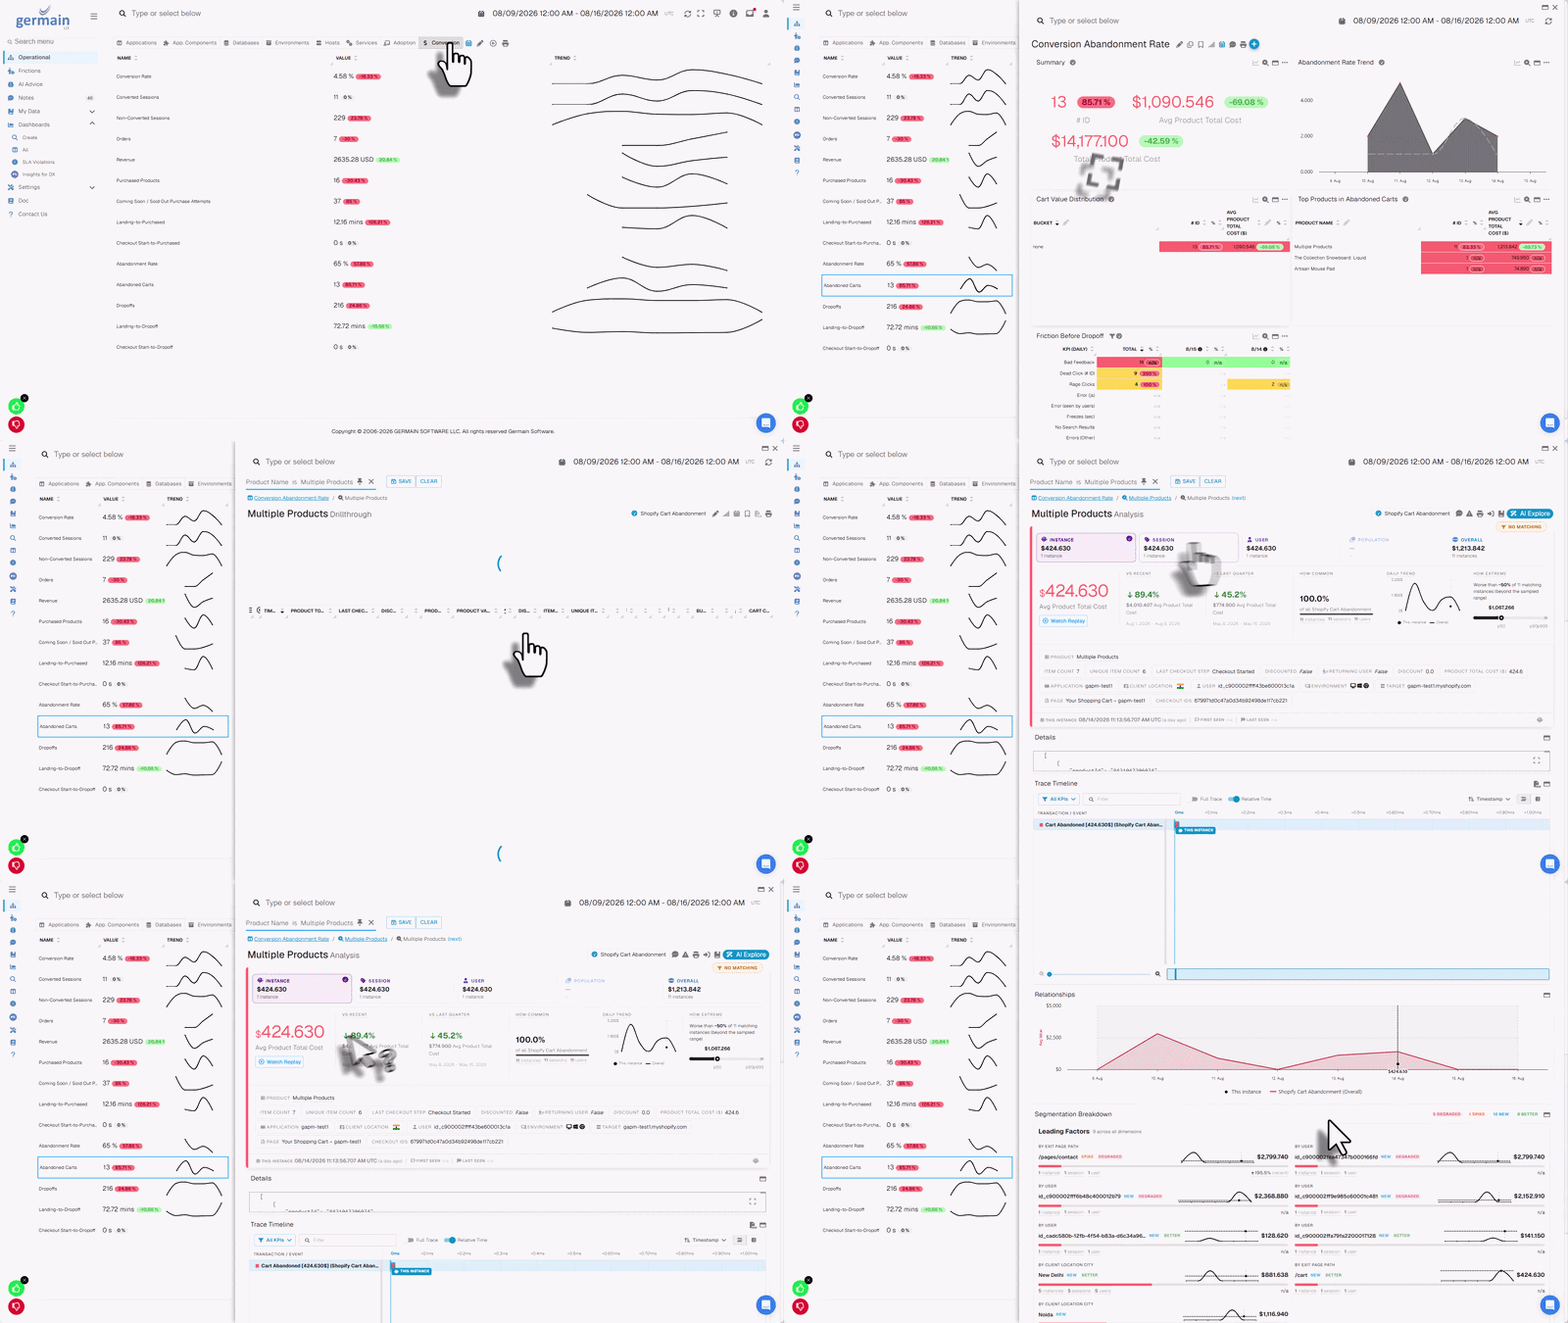
Analytics Dashboards provide four connected levels of visualization.
|
Dashboard level |
Purpose |
|---|---|
|
Aggregate |
Presents summarized business or technical KPIs, trends, scores, maps, flows, funnels, tables, gauges, and counters. |
|
Pivot |
Breaks an aggregated metric down by dimensions such as application, user, page, workflow, product, region, version, system, or error type. |
|
Drill-through |
Displays the individual records underlying an aggregate or pivot result. |
|
Analysis |
Combines baselines, trends, relationships, segmentation, individual instances, and traces to support evidence-based root-cause investigation. |
Filters and context are carried through the investigation path, allowing users to move from an aggregate result to the supporting evidence.
📈 Dashboard visualizations
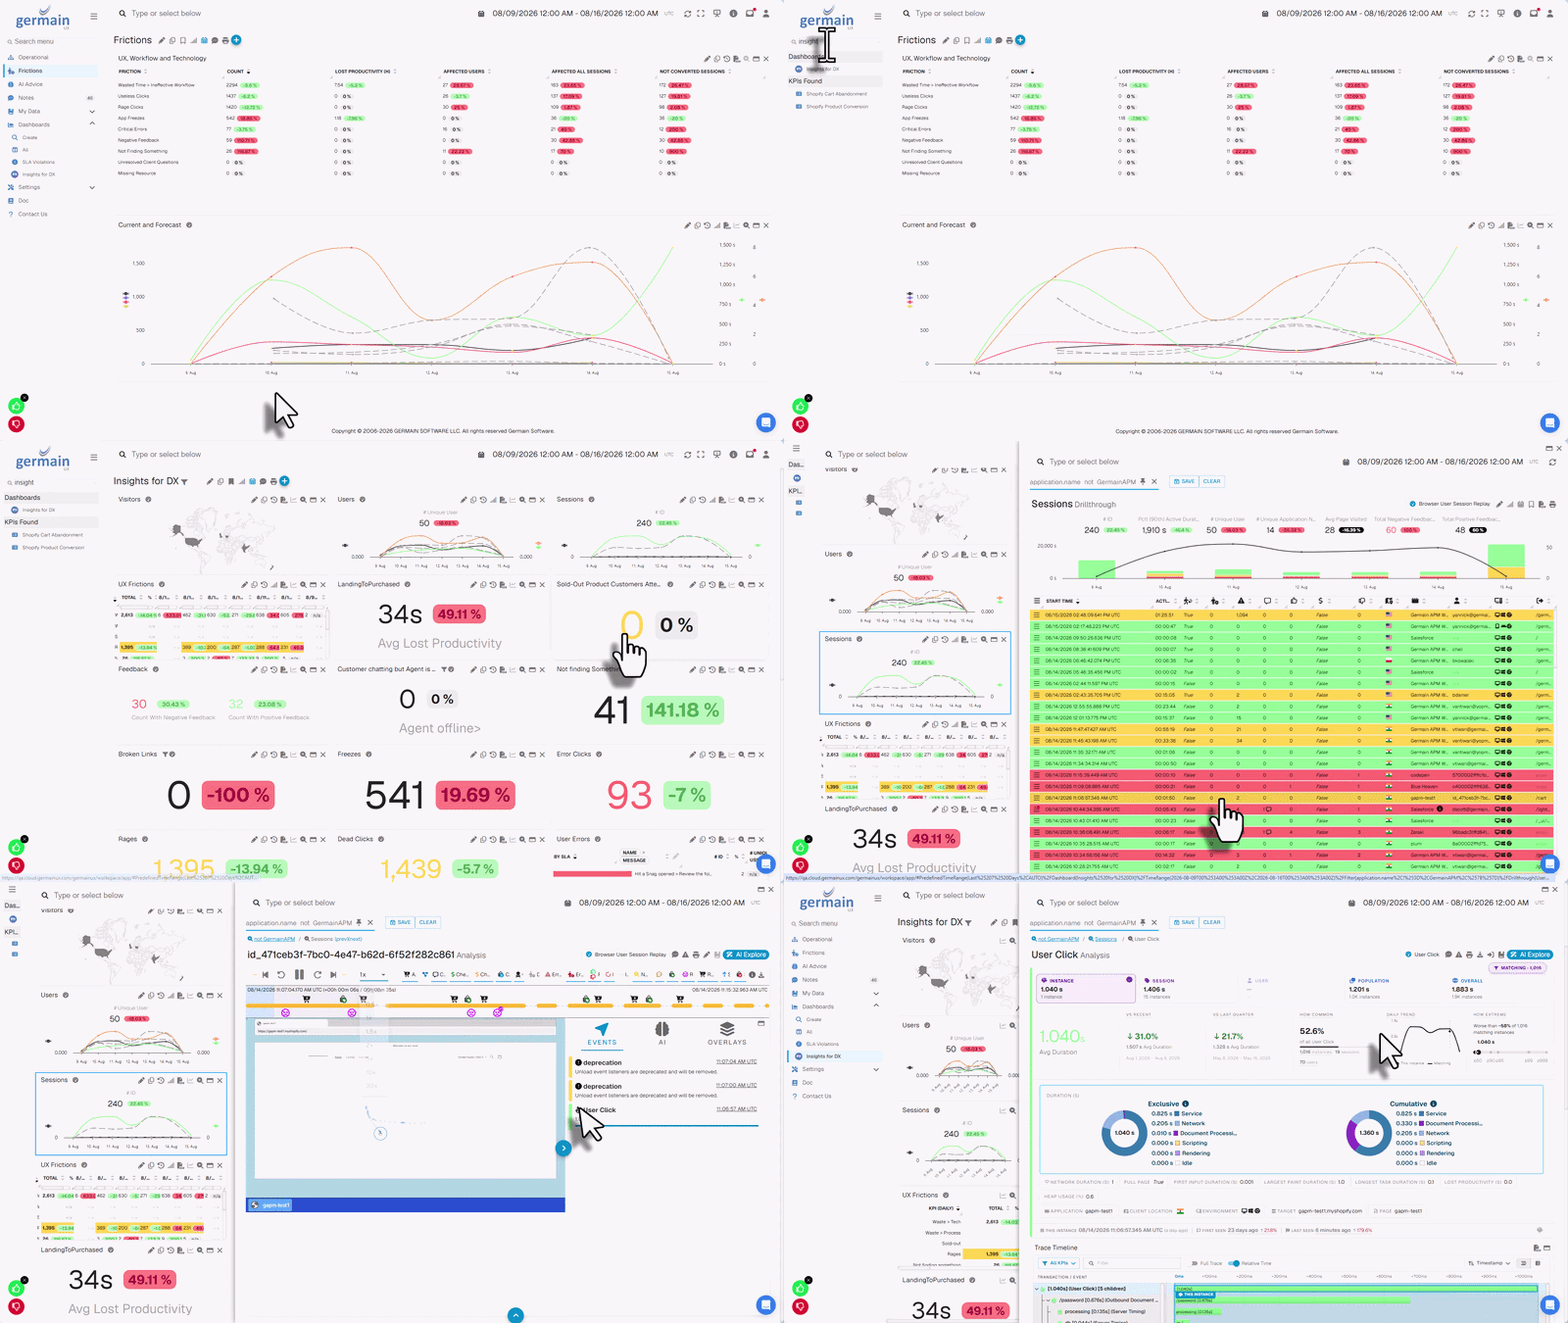
Depending on the selected KPI and configuration, an Aggregate dashboard can contain:
|
Visualization |
Typical use |
|---|---|
|
General Health |
Display trends and aggregated measures over time. |
|
Tabular |
Break down a measure by one or more pivots. |
|
N-Tabular |
Display several related KPIs in one table. |
|
Map |
Visualize geographically related data. |
|
Flow |
Display user journeys, navigation, or workflow paths. |
|
Focused Flow |
Analyze selected journeys or populations to identify friction. |
|
Funnel |
Visualize progression and abandonment across business-process stages. |
|
Gauge |
Show a measure relative to its expected or configured range. |
|
Counter |
Present a headline measure or count. |
🔧 Dashboard creation and customization
GermainUX provides preconfigured dashboards that can be used as delivered, cloned, or customized. Authorized users can also create their own dashboards.
|
Capability |
Description |
|---|---|
|
Create |
Build a dashboard using selected KPIs, measures, pivots, filters, and visualizations. |
|
Explore Your Data |
Select relevant keywords and data to create an initial dashboard more quickly. |
|
Clone |
Copy an existing dashboard and adapt it to another application, team, workflow, or use case. |
|
Edit |
Add, remove, configure, or rearrange portlets and metrics. |
|
Filter |
Apply filters at the dashboard or individual-portlet level. |
|
Compare |
Compare the selected period with another period and display the corresponding change. |
|
Pin |
Add frequently used dashboards to the Workspace menu. |
|
Control access |
Define which users or teams can view or manage the dashboard. |
|
Print or export |
Produce a shareable representation of the displayed information. |
Pivot, Drill-through, and Analysis dashboards can be generated from the selected data and customized where supported.
💡 Analysis dashboards
The Analysis dashboard helps users move from a KPI symptom to evidence-backed root cause.
It can help answer:
-
Is the selected result abnormal compared with recent or historical behavior?
-
Which related KPIs changed during the same period?
-
Which users, applications, pages, workflows, products, systems, versions, or other segments are most affected?
-
Is the issue isolated to one instance or widespread across sessions, users, or the monitored population?
-
Which transaction, request, service, query, code execution, error, or infrastructure condition contributed to the issue?
Depending on the monitored technology and available data, users can examine baselines, trends, percentiles, related KPIs, leading segments, individual attributes, correlation identifiers, duration breakdowns, traces, and Session Replay evidence.
See Analytics Dashboards for the complete dashboard and investigation model.
⚙️ Management dashboards
Management Dashboards provide administrators with visibility into GermainUX itself.
Depending on permissions and deployment architecture, management dashboards can help administrators review:
-
GermainUX services and runtime status
-
Nodes, Engines, agents, and deployed components
-
Processing queues and ingestion activity
-
Monitoring and automation operating states
-
Configuration and deployment status
-
License and AA Unit consumption
-
Data-source and platform health
-
Operational warnings or failures
Detailed administrative capabilities are documented under Management.
📝 Notes and tickets
The Notes and Tickets Dashboard centralizes investigation notes and tickets created from GermainUX data.
Users can:
-
Create a note or ticket from relevant dashboard data.
-
Record investigation findings and supporting context.
-
Assign an item to another user.
-
Track status, ownership, priority, and progress.
-
Search and filter existing notes and tickets.
-
Return to the associated data or investigation context.
This helps business, support, operations, development, and product teams collaborate on issues identified through GermainUX.
📁 Reports
Manual Reports allow users to generate and export dashboard information for offline review or distribution.
Depending on the dashboard and available options, reports can include:
|
Format or action |
Purpose |
|---|---|
|
PDF or Print |
Create a formatted representation of the selected dashboard or investigation. |
|
CSV |
Export underlying or tabular data for additional processing. |
|
XLS or spreadsheet export |
Export supported data for spreadsheet-based review. |
|
Image or clipboard copy |
Reuse selected visualizations or results in another document or communication. |
The report reflects the selected time range, dashboard, filters, data visibility, and user permissions.
Automatically scheduled report generation and delivery are configured separately under Automation.
🔍 Search and filters
Search and Filters help users locate relevant dashboards and narrow the displayed data.
|
Capability |
Purpose |
|---|---|
|
Global search |
Find dashboards, metrics, issues, configuration areas, or documentation. |
|
Dashboard filters |
Apply a condition to all compatible portlets on a dashboard. |
|
Portlet filters |
Restrict only the data displayed by a selected visualization. |
|
Time-range filters |
Select the period to analyze or report. |
|
Attribute filters |
Filter by available fields such as application, user, page, transaction, system, product, workflow, or error. |
|
Saved context |
Preserve relevant data or an investigation for later review where supported. |
Available search fields, pivots, measures, and filters depend on the underlying KPI and the monitored data.
🔑 Accessing GermainUX
Users who do not yet have a Workspace account can follow Requesting Access to Germain.
Access requests are reviewed by the organization’s GermainUX administrators. Once approved, the user receives instructions for setting up access.
Dashboard and data visibility depend on:
-
Assigned roles
-
Team membership
-
Dashboard permissions
-
Data-security rules
-
Application and data-type access
-
Available monitored data
-
Data-retention settings
Roles determine what a user can do. Teams and data-security rules help determine which dashboards, facts, and Session Replays the user can access.
ℹ️ Get Help
The Germain Team can help you set this up. Contact GermainUX Support.
Component: Enterprise-onPremise, Enterprise-onCloud
Supported Version: 2026.2 or later