Features for IMAP
Germain monitors an IMAP (Internet Message Access Protocol) server according to the following criteria:
Server Availability
Germain monitors the availability and responsiveness of the IMAP server, ensuring that it is up and running and capable of accepting client connections.
Connection and Authentication
Germain monitors the successful establishment of IMAP connections and tracks authentication attempts. It identifies any connection failures or authentication issues that may prevent users from accessing their mailboxes.
Mailbox Status
Germain monitors the status of individual mailboxes on the IMAP server. It keeps track of the mailbox size, message count, and any mailbox-specific issues, such as quota limits or folder permissions.
Message Retrieval
Germain monitors the retrieval of messages from mailboxes. It tracks the response times for fetching emails, especially when dealing with large mailboxes or attachments. It identifies any delays or bottlenecks in the message retrieval process.
Mailbox Synchronization
Germain monitors the synchronization of mailboxes across different IMAP clients or devices. It ensures that changes made on one client, such as read/unread status, flags, or folder structure, are correctly reflected on other clients.
Message Search
Germain monitors the search functionality of the IMAP server. It tests and tracks the response times for various search operations, such as searching by sender, subject, or keywords. It identifies any performance issues or delays in message search.
Error Detection and Analysis
Germain monitors and analyzes any error messages or exceptions that occur during IMAP operations. It keeps track of IMAP-specific error codes and messages to identify and troubleshoot issues promptly.
Performance Metrics
Germain utilizes IMAP server performance metrics to monitor resource utilization, such as CPU usage, memory consumption, and network bandwidth. These metrics help identify any performance bottlenecks or resource constraints that may affect the overall performance of the server.
By monitoring these aspects of the IMAP server, Germain provides insights into its availability, performance, and health. This enables proactive monitoring, timely issue detection, and efficient troubleshooting, ensuring smooth and reliable access to email services."
Configuration
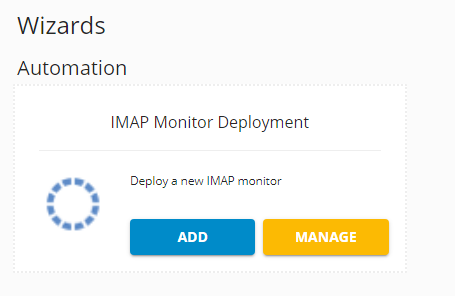
Go to Germain Workspace > Left Menu > Wizards > IMAP
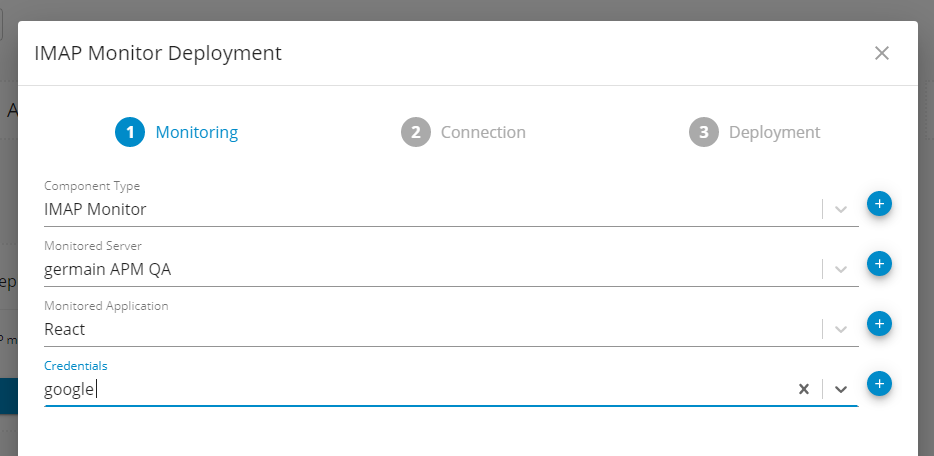
Enter monitoring details
Select “IMAP Monitor” for “Component Type” or Create your own (See below '(Optional): Creating a custom “IMAP Monitor Component”')
Select or create then select entries for “Monitored Server”, “Monitored Application”, and “Credentials”
Click Next
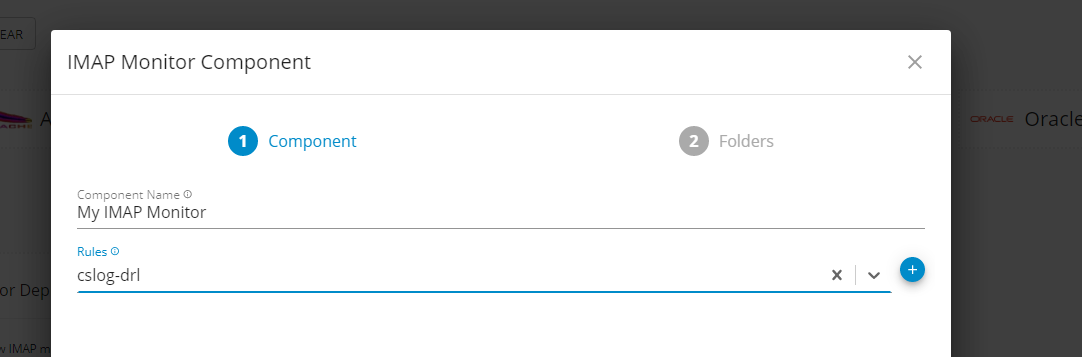
(Optional) Creating a custom “IMAP Monitor Component”
Click the + button to the right of “Component Type” on the screen above
Name the new Component then Click + to create a new rule.
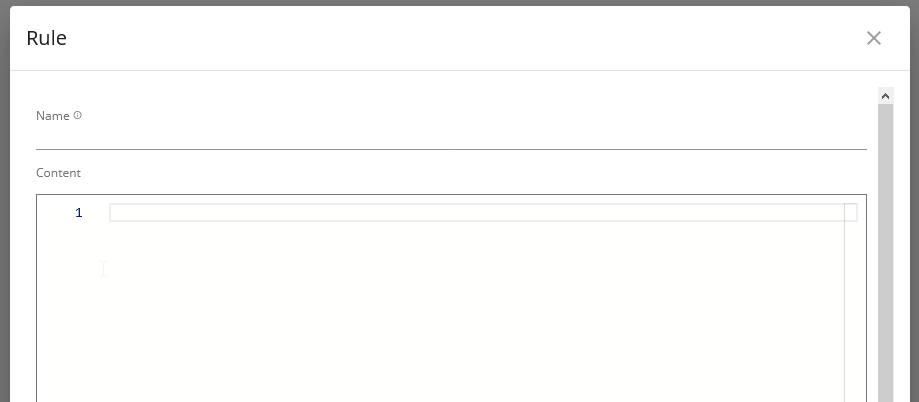
If you have not already: You will need to create a rule that is specific to your needs. You can base this off this sample code.
Once you have written your rule, hit validate. If it passes validation, hit “Finish”.
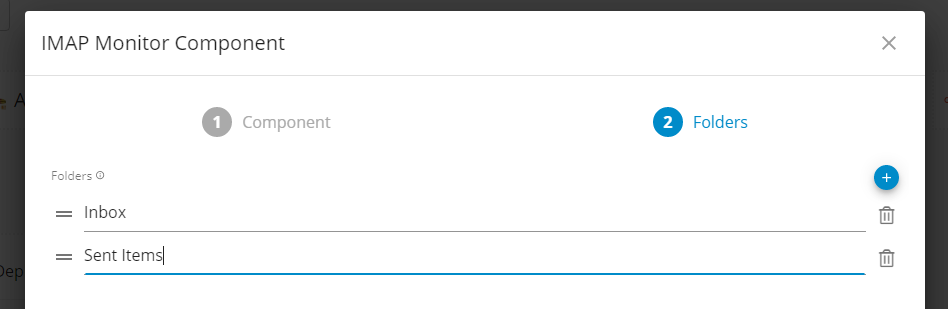
You will be back at “IMAP Monitor Component Step” 1. Hit Next
Add all folders you would like to be checked to the list. Add entries to the list by hitting +
Hit Finish
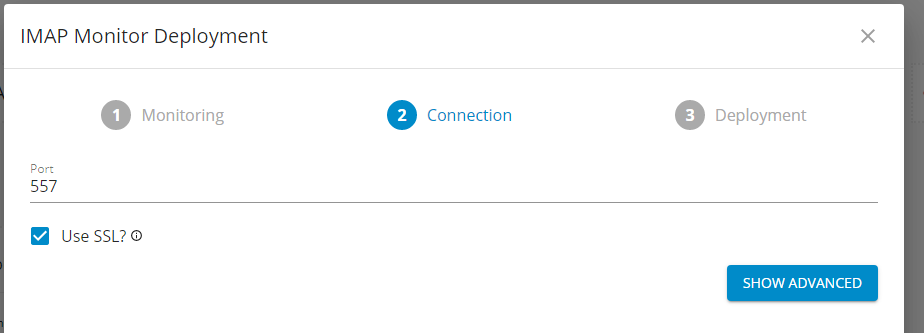
Enter Port Number
Choose “Use SSL” setting
Click Next
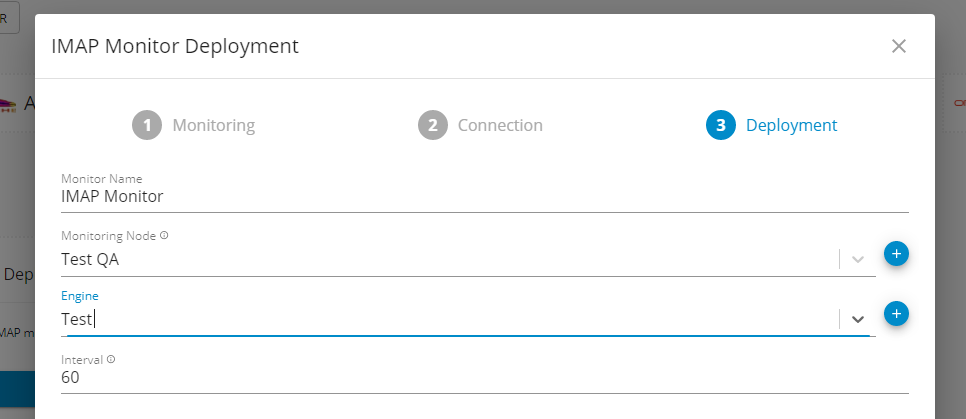
Deploy
Enter a name in “Monitor Name”
Choose the “Monitoring Node”
Choose the “Engine”
Set your monitoring “Interval”
Click Finish
For more detailed information, please reaching out to us. We will provide you with further guidance and assistance tailored to your needs.
Component: Engine
Feature Availability: 8.6.0 or later