Customer(s)
eBay, Largest US-Based Healthcare
Description
Re-designed and enhanced germain Germain's Java & JVM monitoring feature. Customers can now monitor the execution duration of any java method / service through code injection. Our past/old Java monitoring capability was just doing sampling CPU profiling (i.e., check every N milliseconds to see which function is currently active and accumulate that over time). Code injection provides a significantly better accuracy and greater depth when it comes to identifying slow or inefficient java methods.
Features:
-
Call(s) per Service
-
Events monitoring
-
Inbound & outbound HTTP monitoring
-
Inbound & outbound JMS monitoring
-
Session ID self-populate on inbound HTTP requests
-
Support for generating metrics collection
-
SQL execution
-
Transactions monitoring
Benefits
Greater depth of insights to help identify bottlenecks that prevent a Java application to be available or be fast
Performance Impact
Small/negligible performance impact on the monitored application. Here are some details about the load tests we performed on our labs, to understand how much of an impact this newly enhanced java monitoring mechanism may cause on a monitored application
Test scenario & result: 50 concurrent users browsing germain Germain dashboard and config console + 300 users using a CRM web application and being monitored by germain Germain engines & js scripts)
CPU Increase: 0.5% increase in CPU
Memory increase: < 50 MB
Response time (average overhead / request)
HTTP requests: +0.26ms
Generic Java method: +0.35ms
SQL statements: +0.37ms
SQL Prepared statement: +1.5ms
Configuration
Example
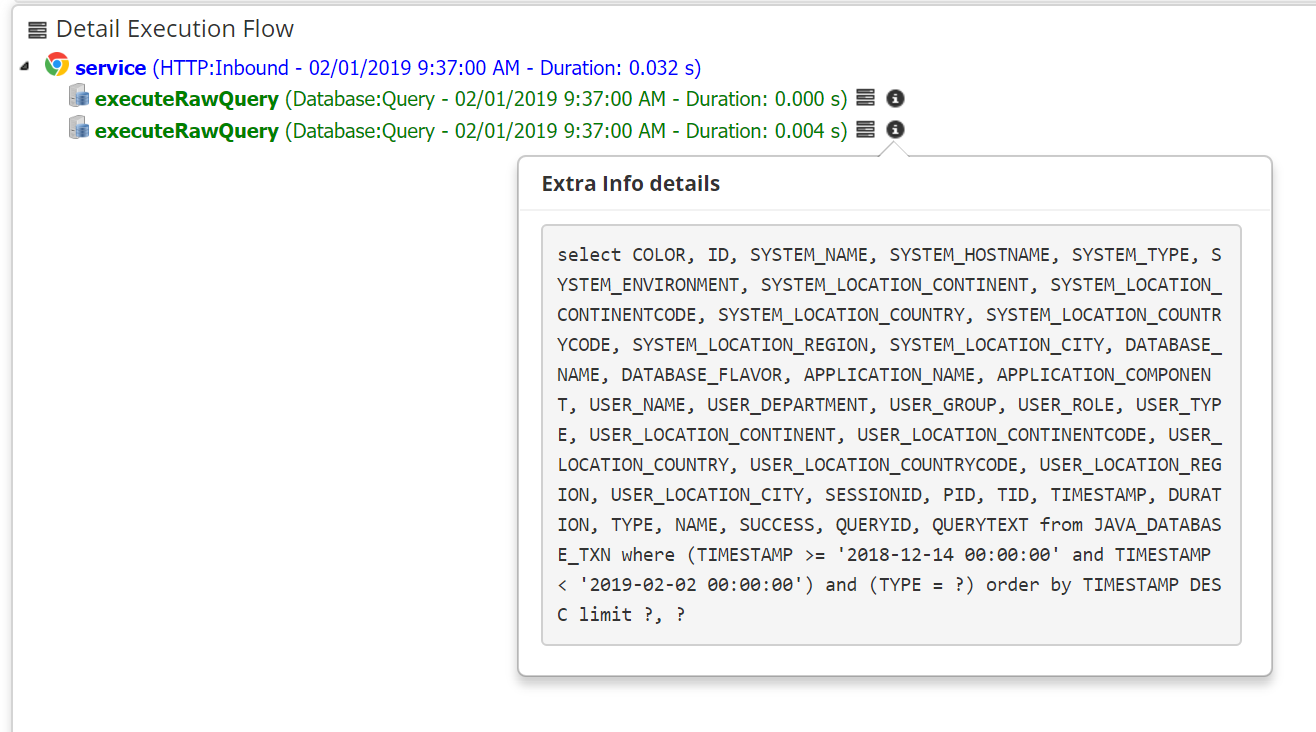
RCA for Inbound Java request > custom java method call > SQL query execution
Unknown Attachment
-
and all these other benefits and visualizations are still available: Monitoring & Analytics - Java & Weblogic
-
and there is more to come in February and March of 2019 - stay tuned...🙂