Features
Workflow, also known as a Business Process, can be monitored and analyzed in real-time by Germain UX. Lost productivity and overrun are automatically identified. By leveraging Germain's capabilities, you can gain valuable insights into the performance of your business operations and take proactive steps to optimize them. In Germain, a business operation or workflow is the parent entity. A 'Step' is a milestone or phase of a business process. Business processes are monitored in two separate ways: Traditional or Collaborative.
Across Tech Stack
Germain features a built-in engine that enables you to monitor the performance of business operations across your tech stack. A holistic view allows you to identify performance bottlenecks or inefficiencies that may span multiple layers of your technology stack.
The key aspects of Germain UX’s Business Process Monitoring and Mining include:
Traditional Business Process
Configured with a fixed step definition in advance and driven by data collected from Germain RUM or Engines (e.g., user clicks, error events, log transactions). Steps are expected to be accomplished in sequence, and the business process is completed when the last step is reached. This type has a fixed number of steps that are expected to be accomplished in sequence. The business process is completed when the last step is reached. It is driven by data collected by Germain, such as user clicks, error events, log entries, etc.
Collaborative Business Process
Steps do not need to be configured in advance. The steps are automatically discovered from data and driven by user activity data. Steps are not executed in sequence, and users can generate activity on any prior step at any time. This mechanism accumulates durations into existing facts, allowing multiple users across multiple sessions to contribute to the same business process step facts. This type allows for an unlimited number of steps, and the steps are discovered from the collected data. The process is data-driven, iterative, incremental, collaborative, accumulative, and out of order. Steps are not expected to be accomplished in sequence, and the business process is completed when any activity is flagged as completed. It is driven by user activity data collected by Germain RUM (Extension or JS).
Overrun and Lost Productivity
In the realm of real-time business process monitoring, Germain UX employs a general calculation referred to as 'overrun.' However, for technical KPIs, this measure might be termed 'Lost Productivity' as it represents technical time that can be assumed to be impeding user time. This distinction does not apply to user-activity related KPIs, as their duration signifies Productive Time.
Duration that user waited - SLA threshold = lost productivity (technology time)
Duration that user worked - SLA threshold = overrun (user time or active duration)
Duration that process took - SLA threshold = overrun (process time or duration)
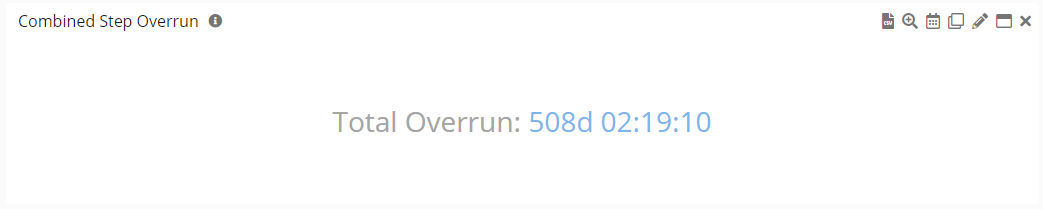
Lost Productivity Assessment at Scale.
These portlets allow you to quantify inefficiencies at scale, across your organization, teams, processes.

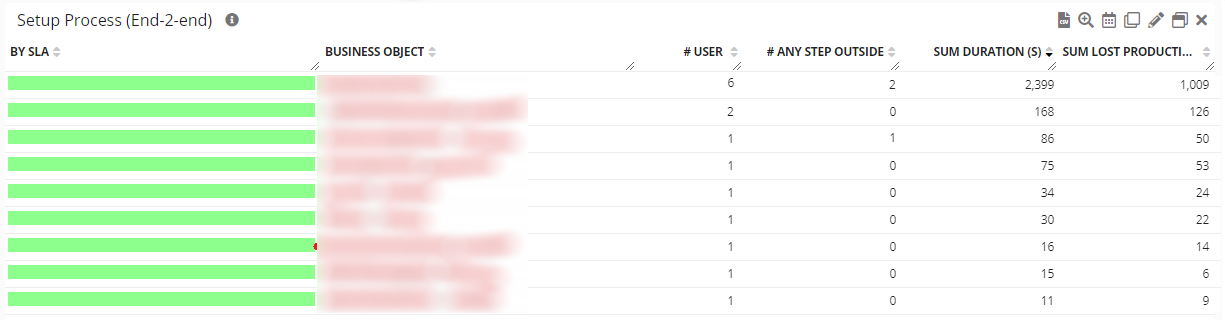
Lost Productivity Assessment by Milestones.
That portlet helps you identify what portion of a Business Process that is the least efficient.
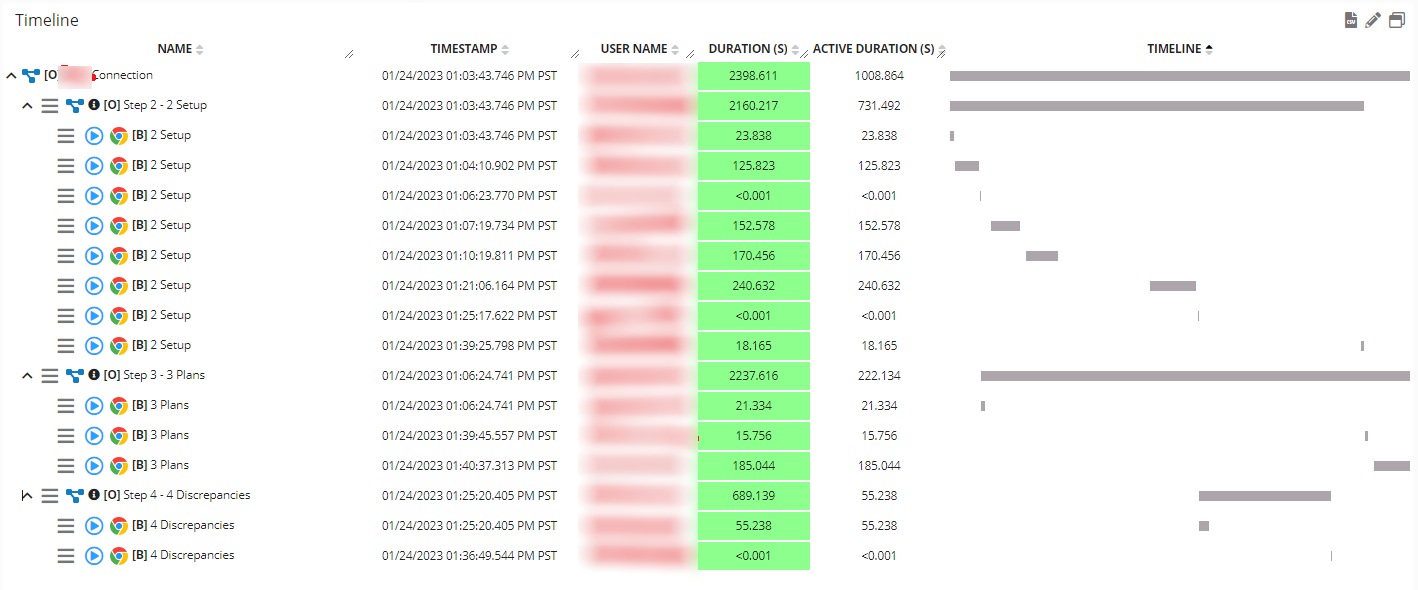
Lost Productivity Time Analysis
That below portlet on an RCA dashboard helps you delve into an inefficiency to better understand where time is being spent by breaking it down by User. From that RCA dashboard, you can then replay the inefficiency you want to further understand by clicking the blue replay icon and this is how the inefficiency is identified on the Session Replay dashboard.

Timeline per process step and per user:
Interval
The interval represents user activity that spans some time and may include various interactions (scrolling, text input, mouse clicks, etc.). It represents the progress of a business process step, such as a user working on a service request and updating fields in an application. Germain UX can operate on any data it collects.
KPIs
Default KPIs and Business Processes are configured to provide example, but most likely you (or we) will need to create a custom BP for your use case(s). More details on the default KPIs: Business Process/Workflow KPIs, Pivots & Measures
Alerting and Notification
Germain provides real-time monitoring of your business operations, ensuring that you have up-to-date information on their performance. It offers customizable alerts and notifications, allowing you to promptly respond to any issues or deviations from expected behavior. By receiving real-time alerts, you can take immediate action to resolve inefficiencies and minimize their impact on your business.
For more detailed information, please reach out to us. We will provide you with specific guidance and assistance tailored to your needs.
Use Cases
Germain UX's workflow monitoring capabilities enable organizations to gain insights into the progress and performance of their business processes, identify bottlenecks or areas of improvement, and optimize productivity and efficiency. By monitoring user activity and data, Germain UX provides valuable real-time information for analyzing and optimizing workflows across various technologies.
Component: Engine, RUM JS, RUM Extension
Feature Availability: 2022.1 or later