
📡 WebSocket Monitoring
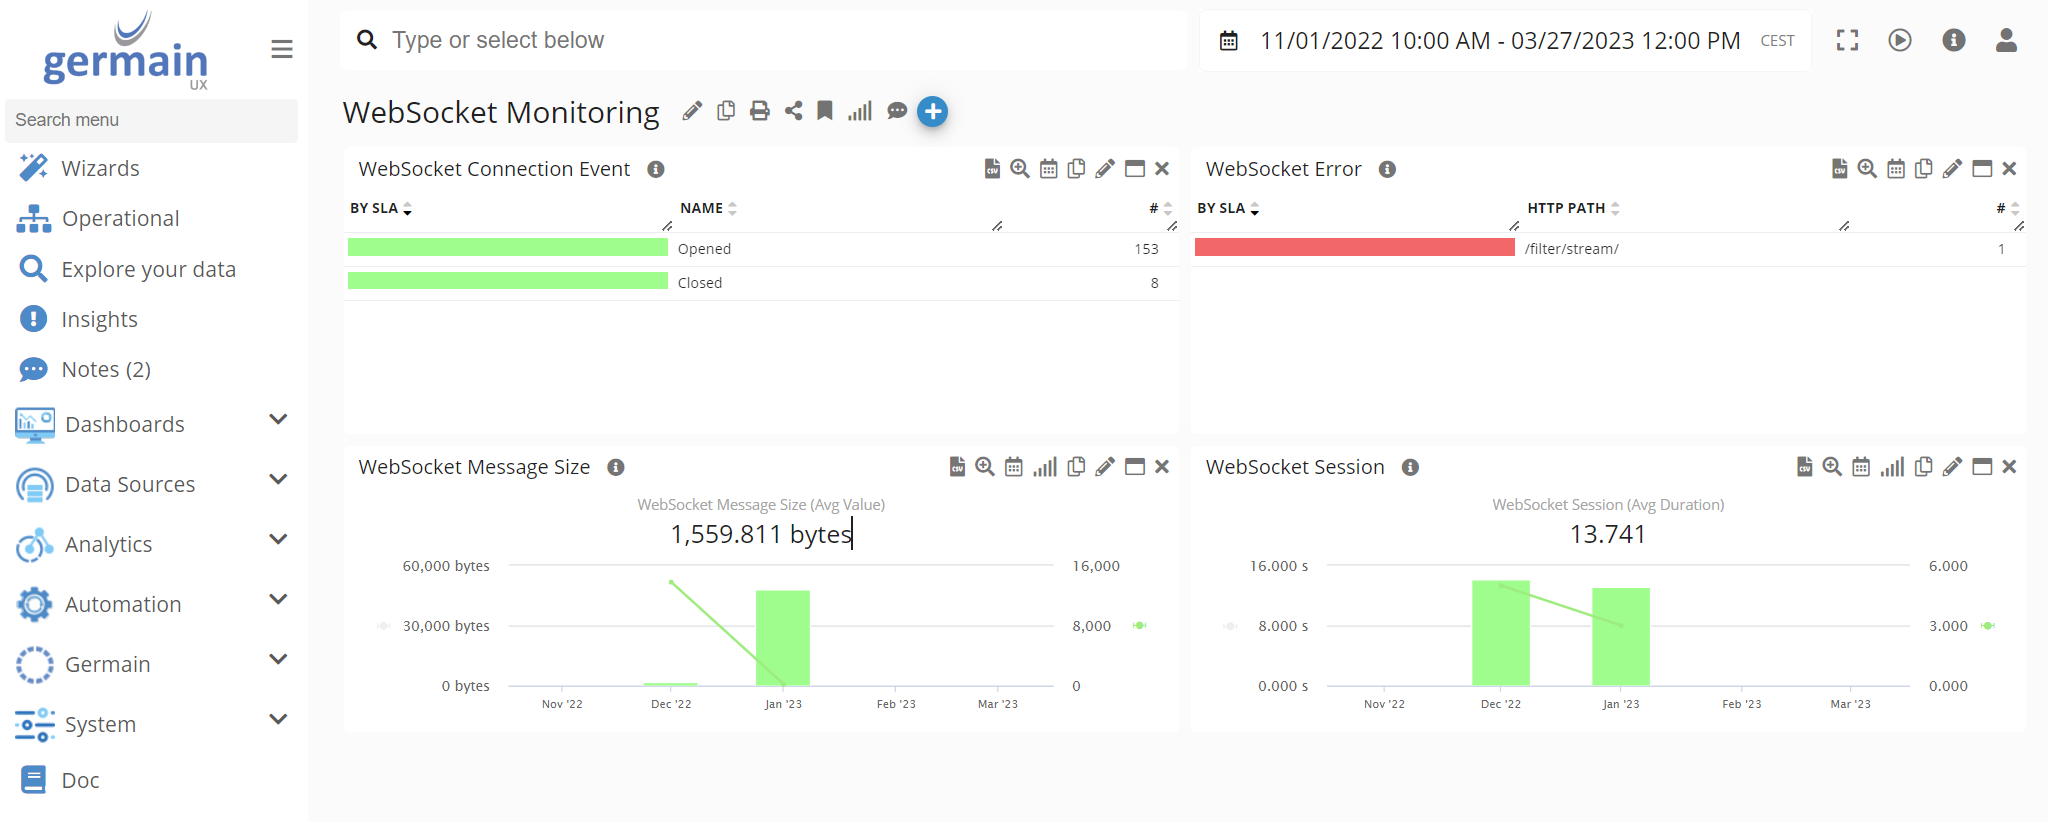
GermainUX monitors WebSocket communication between a user’s browser and a server. It captures connection activity, errors, message size, and connection duration, helping teams identify real-time communication problems affecting users.
WebSocket Monitoring is enabled by default for each User Monitoring Profile as part of Network Request Monitoring.
⚙️ Monitoring components
|
Component |
Role |
|---|---|
|
Continuously monitors WebSocket activity when the GermainUX monitoring script can be deployed in the application. |
|
|
Provides WebSocket monitoring when RUM JS cannot be deployed directly or access to the complete browser-page context requires an extension. |
|
|
Provides deeper JavaScript, browser, error, and network evidence when a WebSocket problem requires technical investigation. |
Collected data
GermainUX collects:
|
Data |
Description |
|---|---|
|
Connection opened |
A WebSocket connection was established. |
|
Connection closed |
A WebSocket connection ended. |
|
Error |
A WebSocket error occurred. |
|
Message size |
The size of messages transferred through the connection. |
|
Session duration |
The duration of the WebSocket connection. |
WebSocket Monitoring captures operational and performance information. Message content is not listed as part of the standard collected data.
Capabilities
GermainUX helps teams:
-
Detect WebSocket connection failures affecting real users.
-
Identify connections that open, close, or fail unexpectedly.
-
Measure WebSocket connection duration.
-
Analyze transferred message sizes.
-
Determine which users, sessions, pages, and workflows are affected.
-
Identify recurring errors and unstable connection patterns.
-
Correlate WebSocket activity with user interactions, JavaScript errors, page activity, and Session Replay.
-
Use the JS Profiler to investigate the JavaScript and browser activity surrounding a connection problem.
Common use cases
WebSocket Monitoring can support applications that use persistent browser connections for:
-
Chat and messaging.
-
Contact-center and CTI updates.
-
Real-time notifications.
-
Live dashboards.
-
Collaboration features.
-
Streaming status updates.
-
Order, delivery, or transaction status.
-
Financial or operational data feeds.
-
Real-time application synchronization.
Business benefits
WebSocket Monitoring helps organizations:
-
Detect real-time communication failures before they affect more users.
-
Identify unstable connections and unexpected disconnections.
-
Determine whether missing or delayed updates are associated with the browser connection.
-
Measure the users and business workflows affected by an outage.
-
Reduce the time required to reproduce intermittent connection problems.
-
Correlate a WebSocket failure with the user’s exact session and activity.
-
Prioritize issues according to frequency and actual user or business impact.
-
Validate whether an application, network, or server correction resolved the problem.
Continuous monitoring
GermainUX RUM JS or the GermainUX RUM Extension continuously monitors WebSocket activity during real user sessions.
Use:
-
RUM JS when the GermainUX monitoring script can be deployed directly in the application.
-
RUM Extension when direct script deployment is unavailable or the application’s security architecture prevents access to the required browser context.
Each collected event is associated with the available application, page, browser, user, and session context.
Technical investigation with JS Profiler
When continuous monitoring identifies a WebSocket error or unstable connection, the GermainUX JS Profiler can provide deeper evidence, including:
-
JavaScript function execution.
-
Function timing.
-
JavaScript errors and stack traces.
-
Browser events and user interactions.
-
Related network and resource activity.
-
Long-running browser tasks.
-
DOM activity.
-
Application, page, workflow, and session context.
The JS Profiler complements continuous WebSocket Monitoring. It provides surrounding JavaScript and browser evidence but does not replace server-side WebSocket logs or diagnostics.
Analytics
GermainUX can analyze WebSocket activity through KPIs, measures, pivots, trends, drill-through views, and session context.
|
Analysis area |
Examples |
|---|---|
|
Availability |
Opened, closed, or failed connections |
|
Reliability |
Errors, unexpected closures, and recurring failures |
|
Duration |
WebSocket connection or session duration |
|
Traffic |
Message size |
|
Impact |
Affected users, sessions, pages, and workflows |
|
Environment |
Application, release, browser, operating system, and device |
|
User context |
Clicks, navigation, page activity, and Session Replay |
|
Technical context |
JavaScript errors, long tasks, and related network activity |
GermainUX users can create watches to receive notifications when collected WebSocket insights meet conditions of interest.
Configuration
No configuration is required to use the default behavior.
Enable or disable with Network Request Monitoring
WebSocket Monitoring is enabled through Network Request Monitoring.
To change its status:
-
Go to Germain Workspace > Analytics > UX Monitoring Profiles.
-
Select the applicable profile.
-
Select or clear Network Requests Monitoring.
-
Save the profile.
Disabling Network Request Monitoring also disables the WebSocket Monitoring controlled by that profile.
Configure WebSocket monitoring independently
Use settings.plugins.network.monitorWebSocket when WebSocket collection must be enabled or disabled independently in the initialization script.
Enable WebSocket Monitoring:
const settings = germainApm.getDefaultSettings();

settings.plugins.network.monitorWebSocket = true;

germainApm.start(settings);
Disable WebSocket Monitoring:
const settings = germainApm.getDefaultSettings();

settings.plugins.network.monitorWebSocket = false;

germainApm.start(settings);
The default value is true.
Limitations
Browser-side WebSocket Monitoring provides the user-facing connection context. A complete technical investigation may also require:
-
WebSocket server logs.
-
Reverse-proxy or load-balancer logs.
-
Network and firewall information.
-
Authentication-service evidence.
-
Back-end application monitoring.
-
Server-side error and transaction data.
GermainUX can correlate the browser evidence with other monitored data when common application, session, user, or transaction identifiers are available.
Privacy and security
Although standard monitoring focuses on connection events, errors, duration, and message size, the surrounding page, URL, error, and session context may contain sensitive information.
Before deployment:
-
Confirm which applications and WebSocket endpoints should be monitored.
-
Avoid exposing authentication tokens or secrets in URLs.
-
Apply masking and exclusion requirements to Session Replay.
-
Restrict access to detailed user and technical evidence.
-
Apply appropriate retention and compliance requirements.
-
Review custom processing carefully if it accesses WebSocket message content.
Recommended investigation workflow
-
Use RUM JS or the RUM Extension to identify a WebSocket error or unexpected closure.
-
Determine the affected users, sessions, pages, workflows, and browsers.
-
Review connection events, duration, errors, and message sizes.
-
Examine the user’s activity through Session Replay when available.
-
Correlate the problem with JavaScript errors, long tasks, and other network activity.
-
Enable the JS Profiler for a controlled scope when deeper browser or JavaScript evidence is required.
-
Review related server, proxy, authentication, and network evidence.
-
Identify and correct the responsible client, server, or network condition.
-
Validate the correction through continuous WebSocket Monitoring.
Deployment and configuration
|
For your browser environment |
|---|
|
Review Browser Monitoring. |
|
Review the Browser Monitoring Deployment Overview. |
|
Deploy GermainUX RUM JS when the monitoring script can be added to the application. |
|
Deploy the GermainUX RUM Extension when direct script deployment is unavailable or access to the complete browser-page context requires an extension. |
|
Deploy the GermainUX JS Profiler for deeper JavaScript, browser, and network diagnostics. |
|
Review Network Request Monitoring. |
|
Review the available Browser Monitoring configuration. |
|
Review the KPIs for User Monitoring and Replay. |
|
Review the available Browser Monitoring KPIs. |
ℹ️ Get Help
The Germain Team can help you set this up. Contact GermainUX Support.
Component: JS Profiler, RUM JS, RUM Extension
Feature Availability: 2021.1 or later
Browser Support: only latest Chrome, Edge and Opera