
Configure Monitoring for Amazon EC2
🌐 Overview
GermainUX uses the GermainUX Engine to collect Amazon EC2 and EBS metrics from Amazon CloudWatch.
Monitoring can be extended with direct operating-system, process, service, log, endpoint, and synthetic-transaction monitoring.
This page covers:
|
Topic |
|
|---|---|
|
1 |
AWS access configuration |
|
2 |
EC2 and EBS metric collection |
|
3 |
EBS Burst Balance monitoring |
|
4 |
Optional host-level monitoring |
|
5 |
KPIs, alerts, and validation |
📋 Prerequisites
Before configuring monitoring:
-
Deploy and register a GermainUX Engine.
-
Install and configure the AWS CLI on the Engine host if the collection uses AWS CLI commands.
-
Confirm that the Engine can reach the required AWS API endpoints.
-
Identify the AWS accounts, regions, instances, and EBS volumes to monitor.
-
Create a dedicated least-privilege AWS identity or role.
-
Store the credentials using an approved credential mechanism.
-
Verify that the AWS identity can retrieve EC2 and CloudWatch information.
Prefer an IAM role with temporary credentials when the GermainUX Engine runs in AWS.
🔒 Required AWS Permissions
Grant only the permissions required by the selected monitoring configuration. Typical read operations include:
|
Operation |
|---|
|
Describing EC2 instances |
|
Describing EBS volumes |
|
Listing CloudWatch metrics |
|
Retrieving CloudWatch metric data |
|
Reading EC2 and EBS tags |
Example permissions may include:
ec2:DescribeInstances
ec2:DescribeVolumes
ec2:DescribeTags
cloudwatch:ListMetrics
cloudwatch:GetMetricData
cloudwatch:GetMetricStatistics
Additional permissions may be required for optional AWS services or monitoring methods.
Do not use the AWS root account or grant infrastructure-modification permissions for metric collection.
⚙️ Configure AWS Access
On the GermainUX Engine host:
-
Configure an approved IAM role, AWS profile, or temporary credential mechanism.
-
Set the AWS region explicitly.
-
Verify the identity used by the Engine.
-
Test access to EC2 and CloudWatch.
-
Confirm that the expected instances and volumes are returned.
When access keys must be used, protect and rotate them according to organizational policy. Do not place credentials directly in scripts.
📈 Configure EC2 Metric Collection
-
In GermainUX, create or select the AWS data source.
-
Select the GermainUX Engine that will collect the metrics.
-
Configure the AWS account and region.
-
Add the EC2 instances to the monitoring scope.
-
Select the required CloudWatch metrics.
-
Define the collection schedule and timeout.
-
Map each collected value to the appropriate GermainUX KPI.
-
Add identifiers such as account, region, Availability Zone, instance ID, instance name, application, and environment.
-
Save and enable the monitoring configuration.
Common EC2 metrics include:
|
Metric |
|---|
|
CPU utilization |
|
Network bytes and packets |
|
Status-check failures |
|
CPU credit balance for burstable instances |
|
CPU credit usage |
|
Disk operations for instance-store volumes, where available 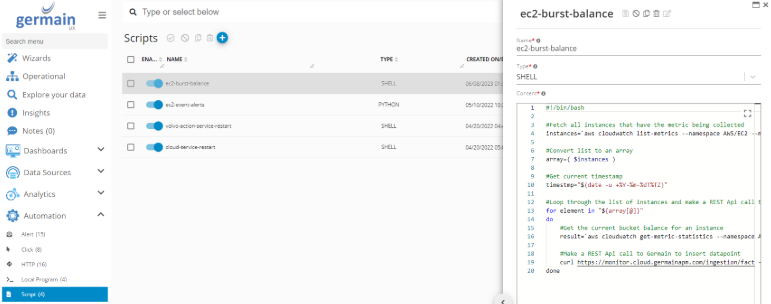
|
Memory and filesystem utilization are not standard EC2 metrics. Collect them through the CloudWatch Agent or direct operating-system monitoring.
💾 Configure EBS Monitoring
-
Retrieve the EBS volumes attached to the monitored EC2 instances.
-
Collect the required metrics from the
AWS/EBSCloudWatch namespace. -
Associate each metric with its volume ID and attached EC2 instance.
-
Map the values to GermainUX KPIs.
-
Configure the collection frequency.
-
Enable the configuration and verify the results.
Useful EBS metrics include:
|
Metric |
|---|
|
Read and write operations |
|
Read and write bytes |
|
Operation latency |
|
Queue length |
|
Idle time |
|
IOPS utilization |
|
Throughput utilization |
|
Burst Balance |
|
Volume status checks |
Metric availability depends on the EBS volume type and AWS configuration.
⚡ Configure EBS Burst Balance Monitoring
Burst Balance represents the percentage of remaining burst credits for EBS volume types that use a burst-credit model.
📄 Create the collection script
Configure an Engine-executed script or approved local program that:
-
Identifies the EBS volumes in scope.
-
Requests the
BurstBalancemetric from CloudWatch. -
Uses the
VolumeIdas the CloudWatch dimension. -
Specifies the correct AWS region.
-
Requests a period that matches the collection schedule.
-
Returns the volume ID, timestamp, and Burst Balance value in a consistent format.
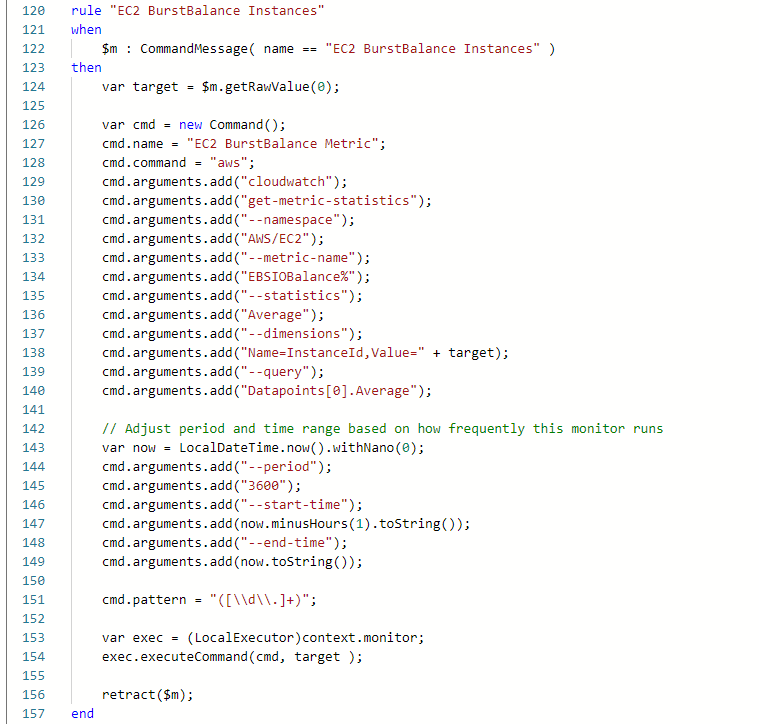
The request should use:
|
Setting |
Value |
|---|---|
|
Namespace |
|
|
Metric |
|
|
Dimension |
|
|
Unit |
Percent |
|
Statistic |
Typically |
Using the minimum value can help identify the lowest remaining balance during the evaluation period. Using the average provides the overall level for that period.
🚀 Configure execution
-
Assign the script or local program to the GermainUX Engine.
-
Configure the execution schedule.
-
Set the metric start and end times relative to each execution.
-
Configure an appropriate timeout.
-
Test the command and review its raw output.
-
Confirm that a result is returned for each applicable volume.
Do not assume that BurstBalance applies to every EBS volume. Volumes such as gp3 use provisioned IOPS and throughput rather than the gp2 burst-credit model.
📦 Parse and store the metric
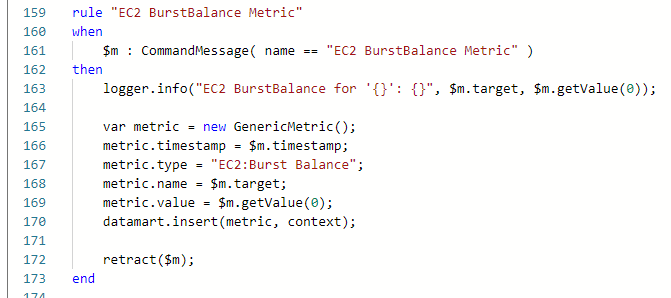
Create or update the GermainUX rule that processes the command output.
The rule must:
-
Identify each EBS volume.
-
Extract the metric timestamp.
-
Extract the numeric Burst Balance value.
-
Associate it with the correct AWS account, region, volume, instance, application, and environment.
-
Store it under the configured EBS Burst Balance KPI.
-
Ignore empty, invalid, or unsupported results.
-
Report collection failures separately from actual low metric values.
A missing value must not automatically be interpreted as zero. It may mean that the metric is unsupported, delayed, or unavailable.
🔔 Configure Alerts
Create an SLA and alert for low EBS Burst Balance.
Example severity levels can be adapted to the workload:
|
Condition |
Suggested severity |
|---|---|
|
Burst Balance below the warning threshold |
Warning |
|
Burst Balance below the critical threshold |
Critical |
|
Metric remains low for multiple collections |
Critical |
|
Metric collection fails repeatedly |
Monitoring failure |
Correlate a low Burst Balance with:
|
Related metric |
|---|
|
EBS latency |
|
Queue length |
|
IOPS and throughput |
|
Application response time |
|
Database performance |
|
User or business-transaction duration |
Avoid alerting on a single short-lived change unless the affected volume supports a critical workload.
🖥️ Configure Optional Host Monitoring
To collect operating-system metrics, configure one of the following:
|
Method |
|---|
|
CloudWatch Agent metrics retrieved through CloudWatch |
|
SSH monitoring for Linux |
|
Approved Windows host monitoring |
|
Log and file monitoring |
|
Process and service monitoring |
Guest-level measurements can include:
|
Measurement |
|---|
|
Memory utilization |
|
Swap or paging |
|
Filesystem utilization |
|
Process availability |
|
Process CPU and memory |
|
Service state |
|
System uptime |
|
Application and system errors |
Use a dedicated least-privilege operating-system account for direct host monitoring.
🧩 Configure Application Monitoring
Add application-level monitoring where required:
|
Monitor |
|---|
|
HTTP or HTTPS availability |
|
API response time and status |
|
Database queries |
|
Application logs |
|
Browser Real User Monitoring |
|
Code profiling for supported runtimes |
|
Synthetic user scenarios |
This allows EC2 and EBS conditions to be analyzed alongside application performance and business impact.
📊 Dashboards and Reports
Add the collected metrics to an EC2 dashboard, including:
|
Dashboard item |
|---|
|
Instance availability |
|
Status-check failures |
|
CPU utilization |
|
CPU credit balance |
|
Network traffic |
|
EBS latency |
|
EBS queue length |
|
EBS IOPS and throughput |
|
EBS Burst Balance |
|
Memory and filesystem utilization |
|
Process and service availability |
|
Application errors and response time |
Scheduled reports can include current values, trends, SLA violations, and changes compared with the previous period.
✅ Validation
After enabling monitoring:
-
Confirm that the GermainUX Engine can access AWS.
-
Verify the AWS account and region.
-
Confirm that expected instances and volumes are discovered.
-
Compare selected metric values with CloudWatch.
-
Verify that each EBS metric is associated with the correct volume.
-
Confirm that unsupported metrics remain empty rather than being stored as zero.
-
Test warning and critical thresholds safely.
-
Verify that alerts reach the intended recipients.
-
Confirm that dashboards use the correct application and environment context.
🔧 Troubleshooting
⛔ AWS access fails
Verify:
|
Item |
|---|
|
IAM role or credentials |
|
AWS region |
|
Required permissions |
|
Engine network access |
|
Proxy configuration |
|
AWS CLI configuration, when used |
|
System time synchronization |
🔍 No EBS Burst Balance is returned
Confirm that:
-
The volume type supports Burst Balance.
-
The correct region and volume ID are used.
-
The
AWS/EBSnamespace is selected. -
The requested time window contains data.
-
CloudWatch access is permitted.
-
The volume was active during the requested period.
🔗 Metrics are associated with the wrong instance
An EBS volume can be detached or reattached. Use the volume ID as the primary EBS identifier and refresh instance-to-volume relationships regularly.
⏳ Metrics appear late
CloudWatch data may not be available immediately. Ensure that the requested end time allows for normal publication delay and that the collection period matches the selected metric granularity.
ℹ️ Get Help
The Germain Team can help you set this up. Contact GermainUX Support.
Component: Engine
Feature Availability: 2014.1 or later