Features
Germain UX provides the ability to create a Query monitoring component, allowing you to track and monitor the performance of queries executed within your application. This feature enables you to gain insights into the efficiency, response times, and resource utilization of your queries.
Key features of the Query monitoring component in Germain UX include:
Query Execution Analysis
Germain UX captures and analyzes the execution of queries in real-time. It provides detailed information about query duration, execution plan, and resource consumption, helping you identify slow-running queries, potential bottlenecks, and areas for optimization.
Query Performance Metrics
Germain UX tracks various performance metrics associated with queries, such as execution time, CPU usage, memory consumption, and I/O operations. These metrics provide a comprehensive view of query performance and help you understand the impact of queries on overall application performance.
Alerting and Thresholds
Germain UX allows you to set custom thresholds and triggers for query performance. You can configure alerts to notify you when certain queries exceed defined thresholds or exhibit unusual behavior. This helps you proactively identify and address performance issues.
Historical Data and Trend Analysis
Germain UX maintains a historical record of query performance data, allowing you to analyze trends over time. By comparing query performance across different time periods, you can identify patterns, track improvements, and measure the impact of optimizations.
Query Segmentation and Filtering
Germain UX enables you to segment and filter queries based on various criteria, such as query type, user, application module, or database. This flexibility allows you to focus on specific subsets of queries for analysis and monitoring.
The Query monitoring component in Germain UX empowers you to effectively monitor and optimize the performance of queries in your application. It provides actionable insights that help improve application efficiency, optimize database interactions, and enhance the overall user experience.
For more detailed information, please reaching out to us: https://docs.germainux.com/main/support . We will provide you with further guidance and assistance tailored to your needs.
Configuration
Create a New Query Monitor Component
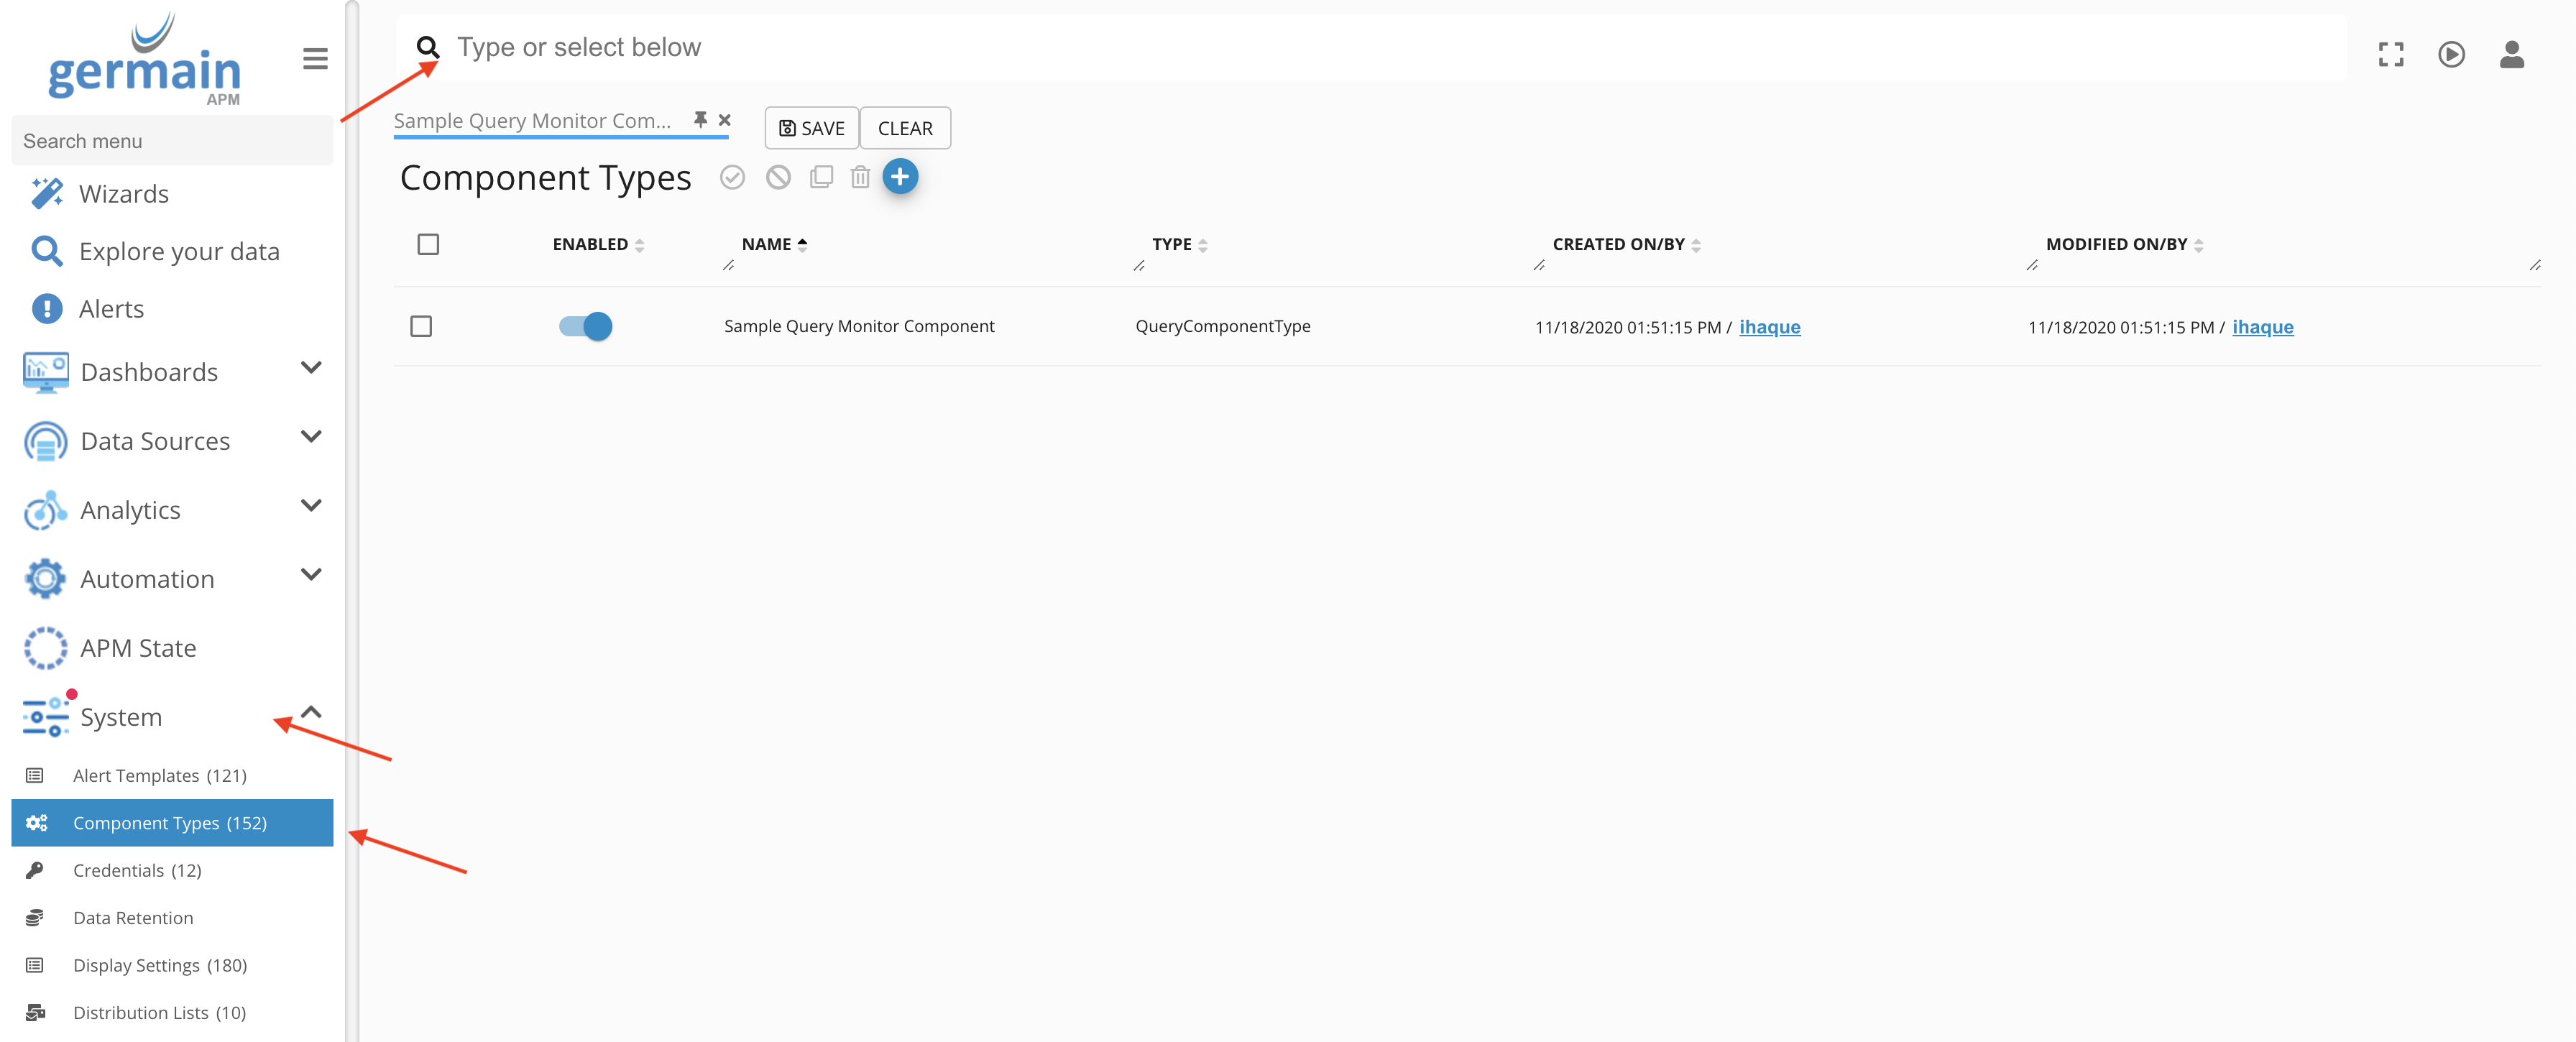
1. Log on to Germain Workspace > left menu > System > Component Types
2. Add and select Database Query Monitor Component
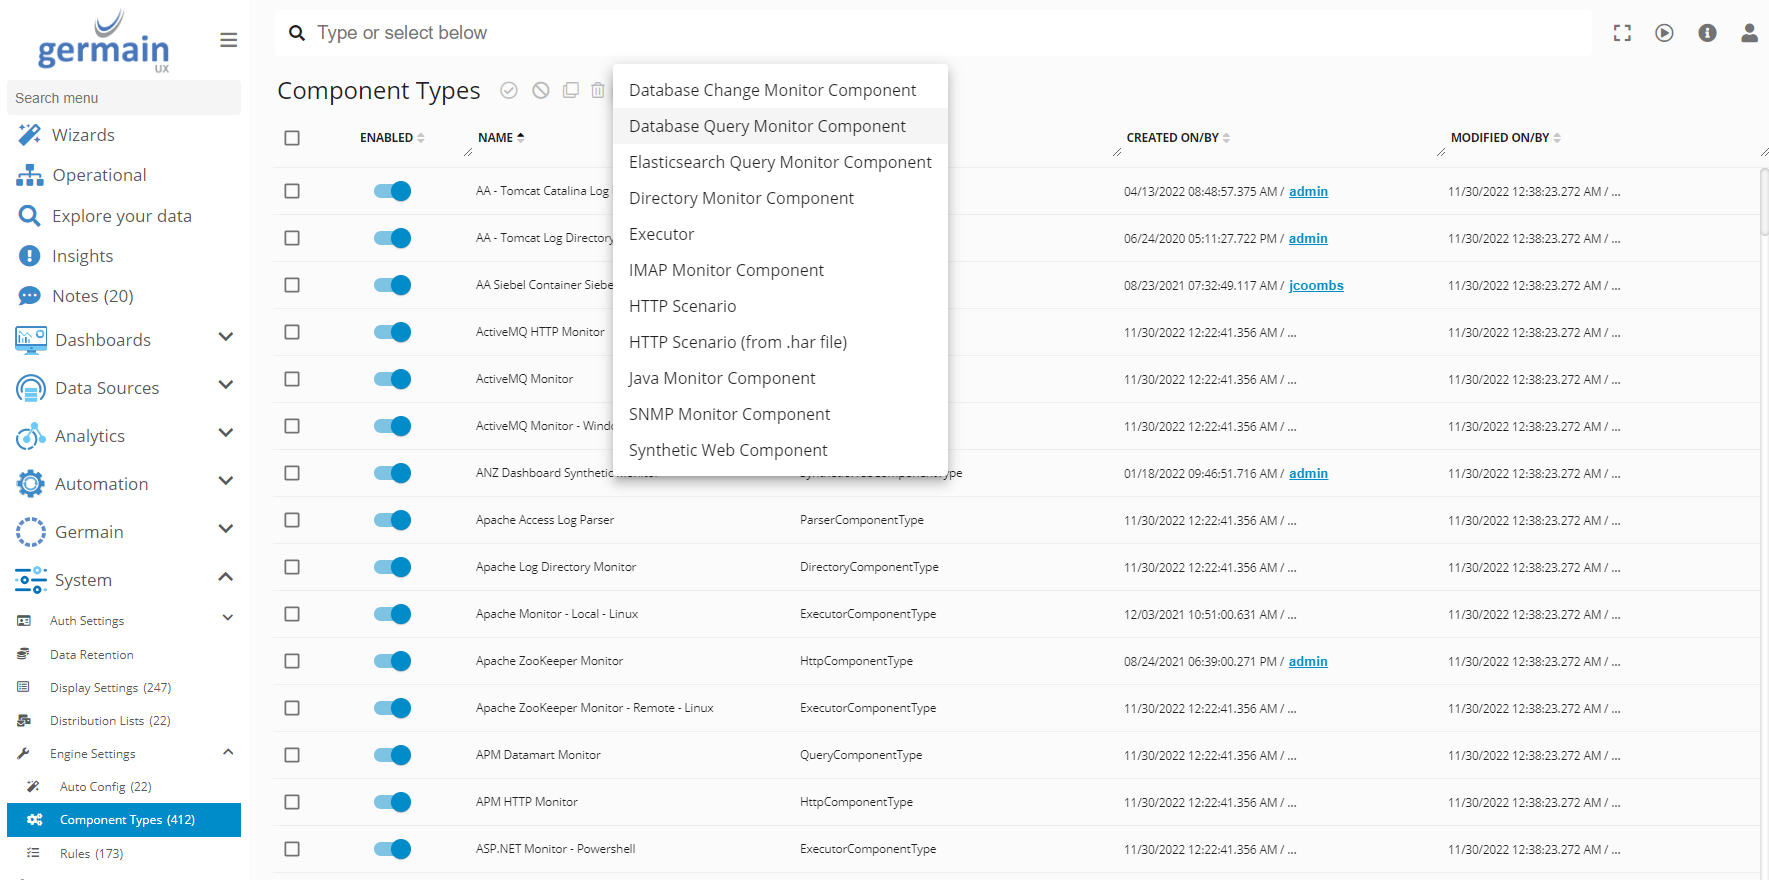
3. Provide Name for component
4. Click Next
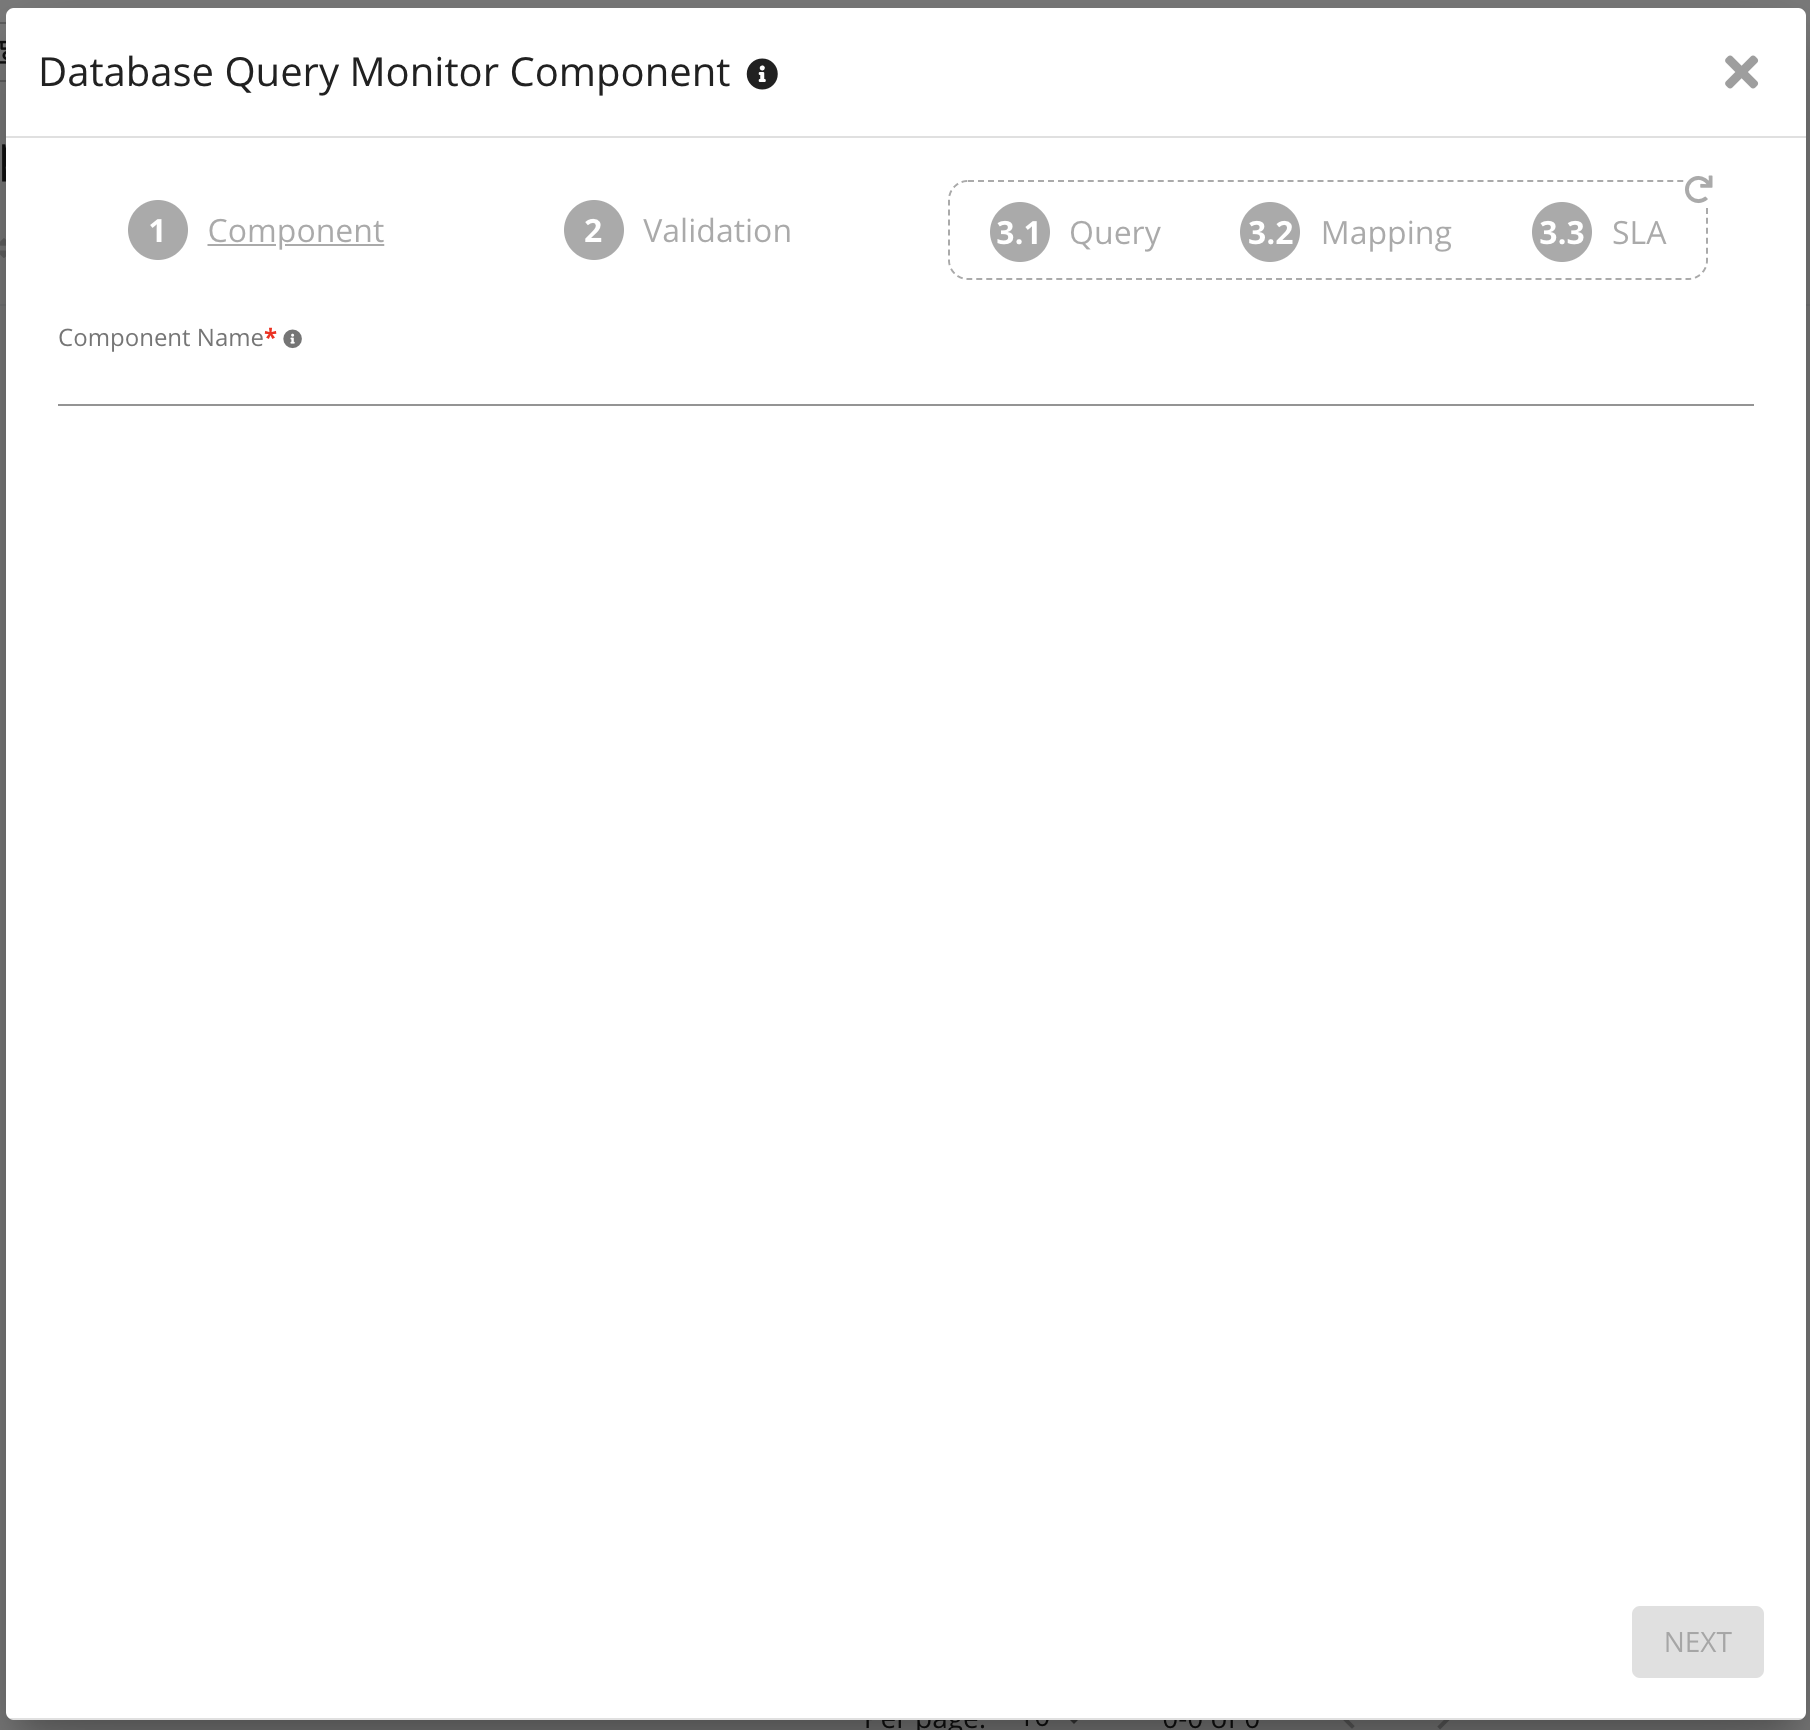
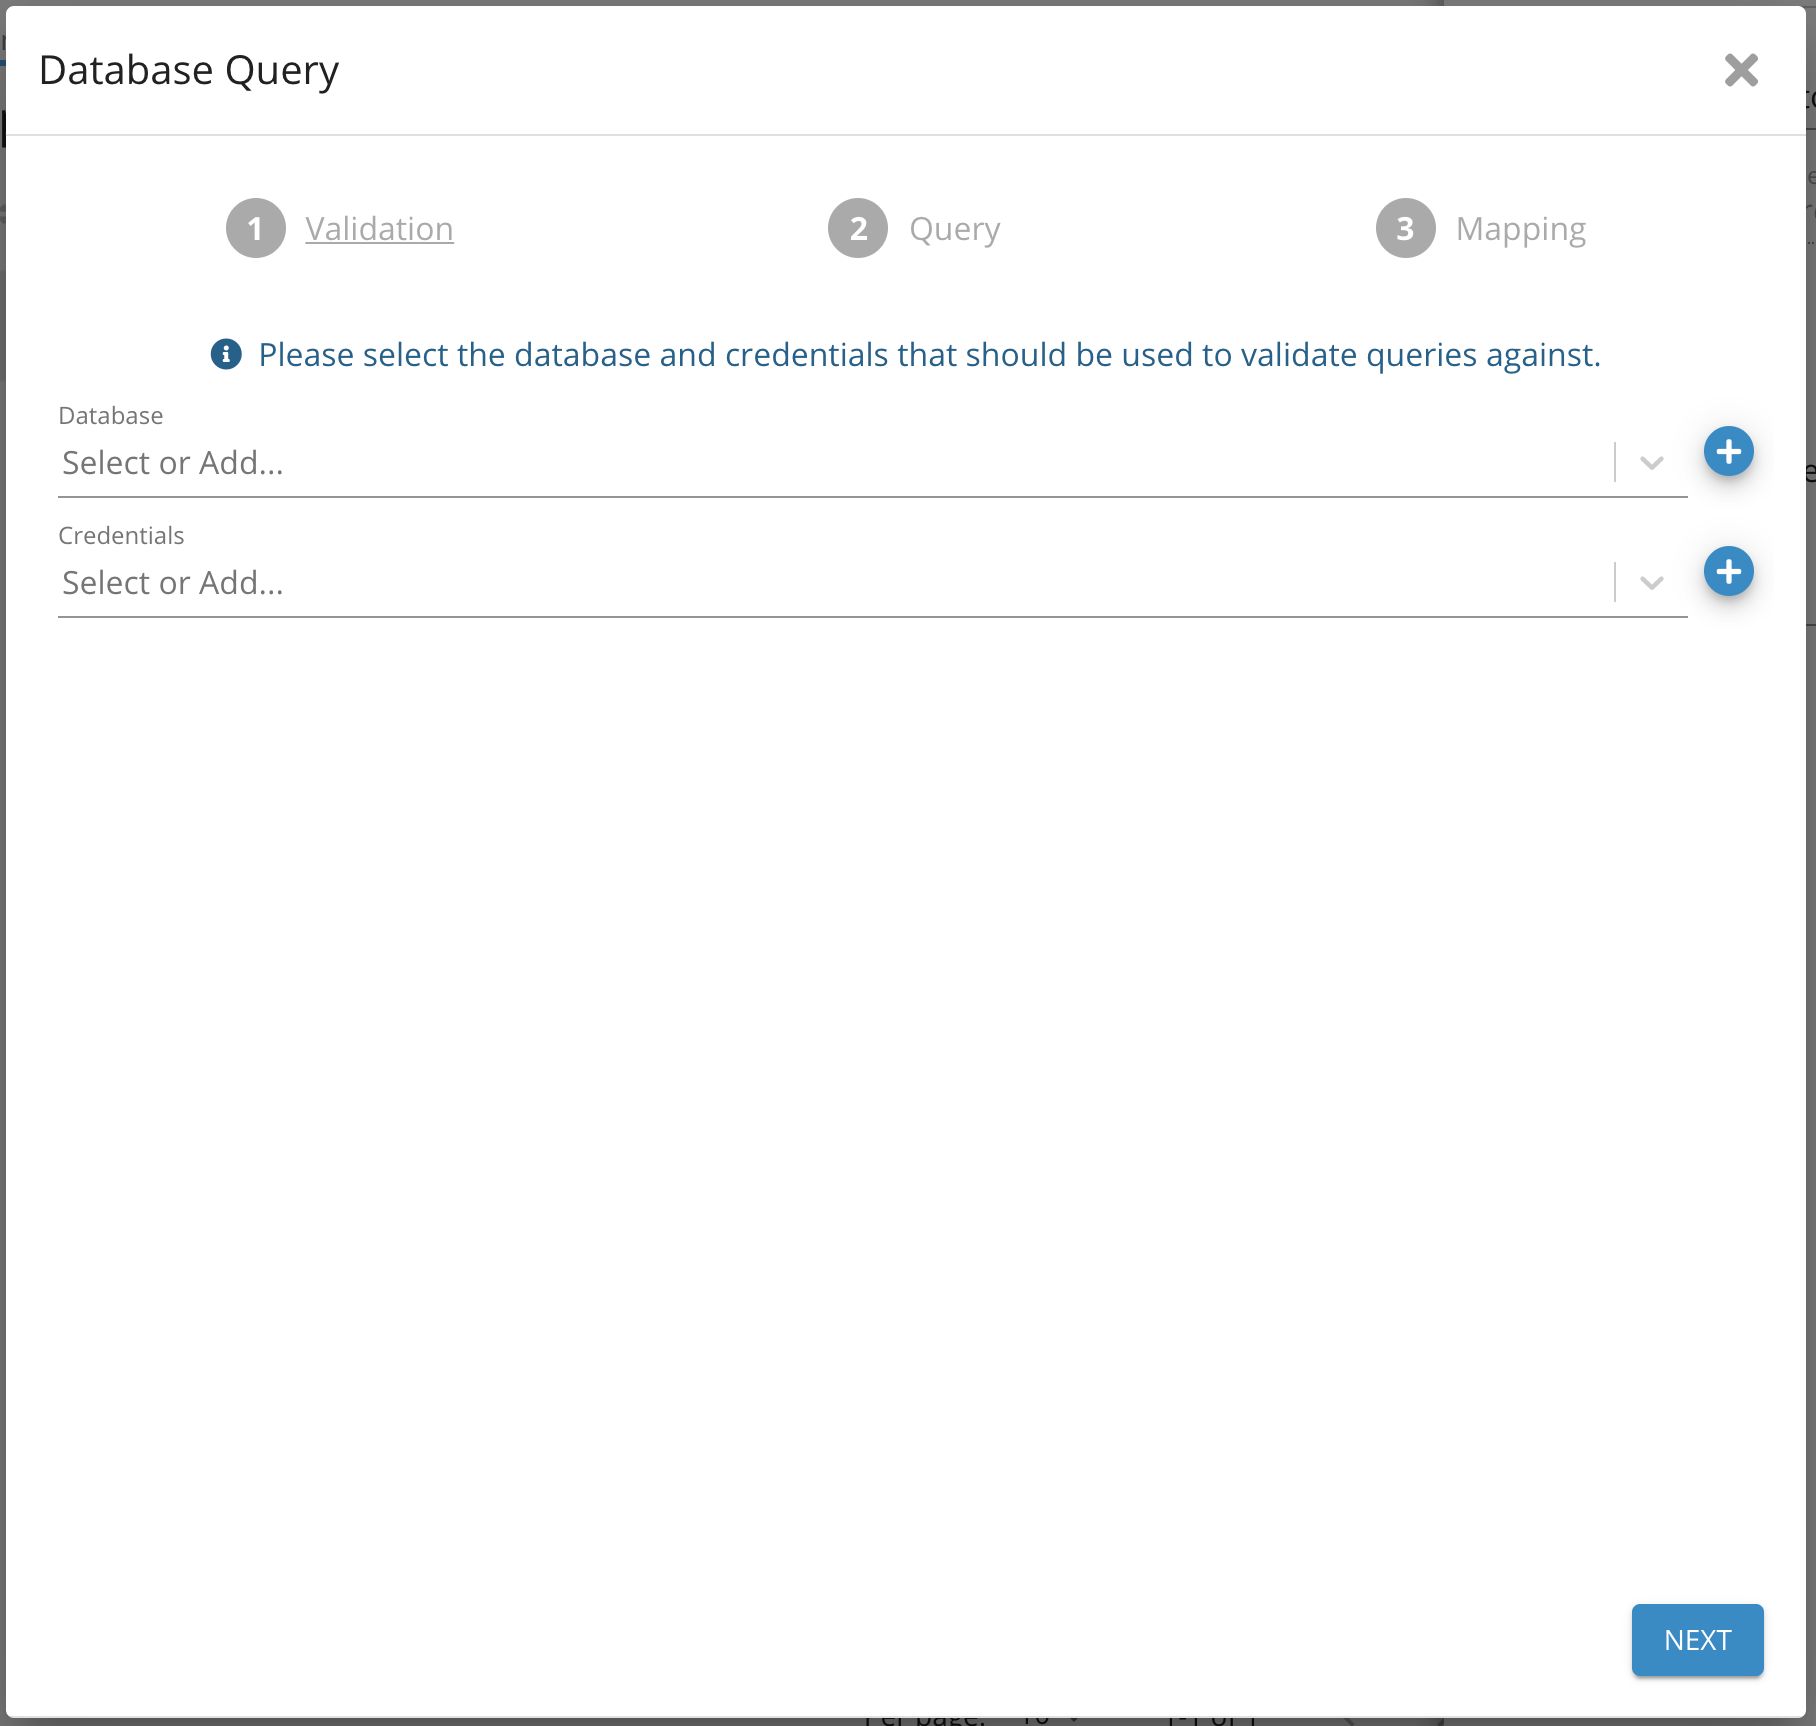
5. Select Database where the query will be run
6. Select credentials for DB access
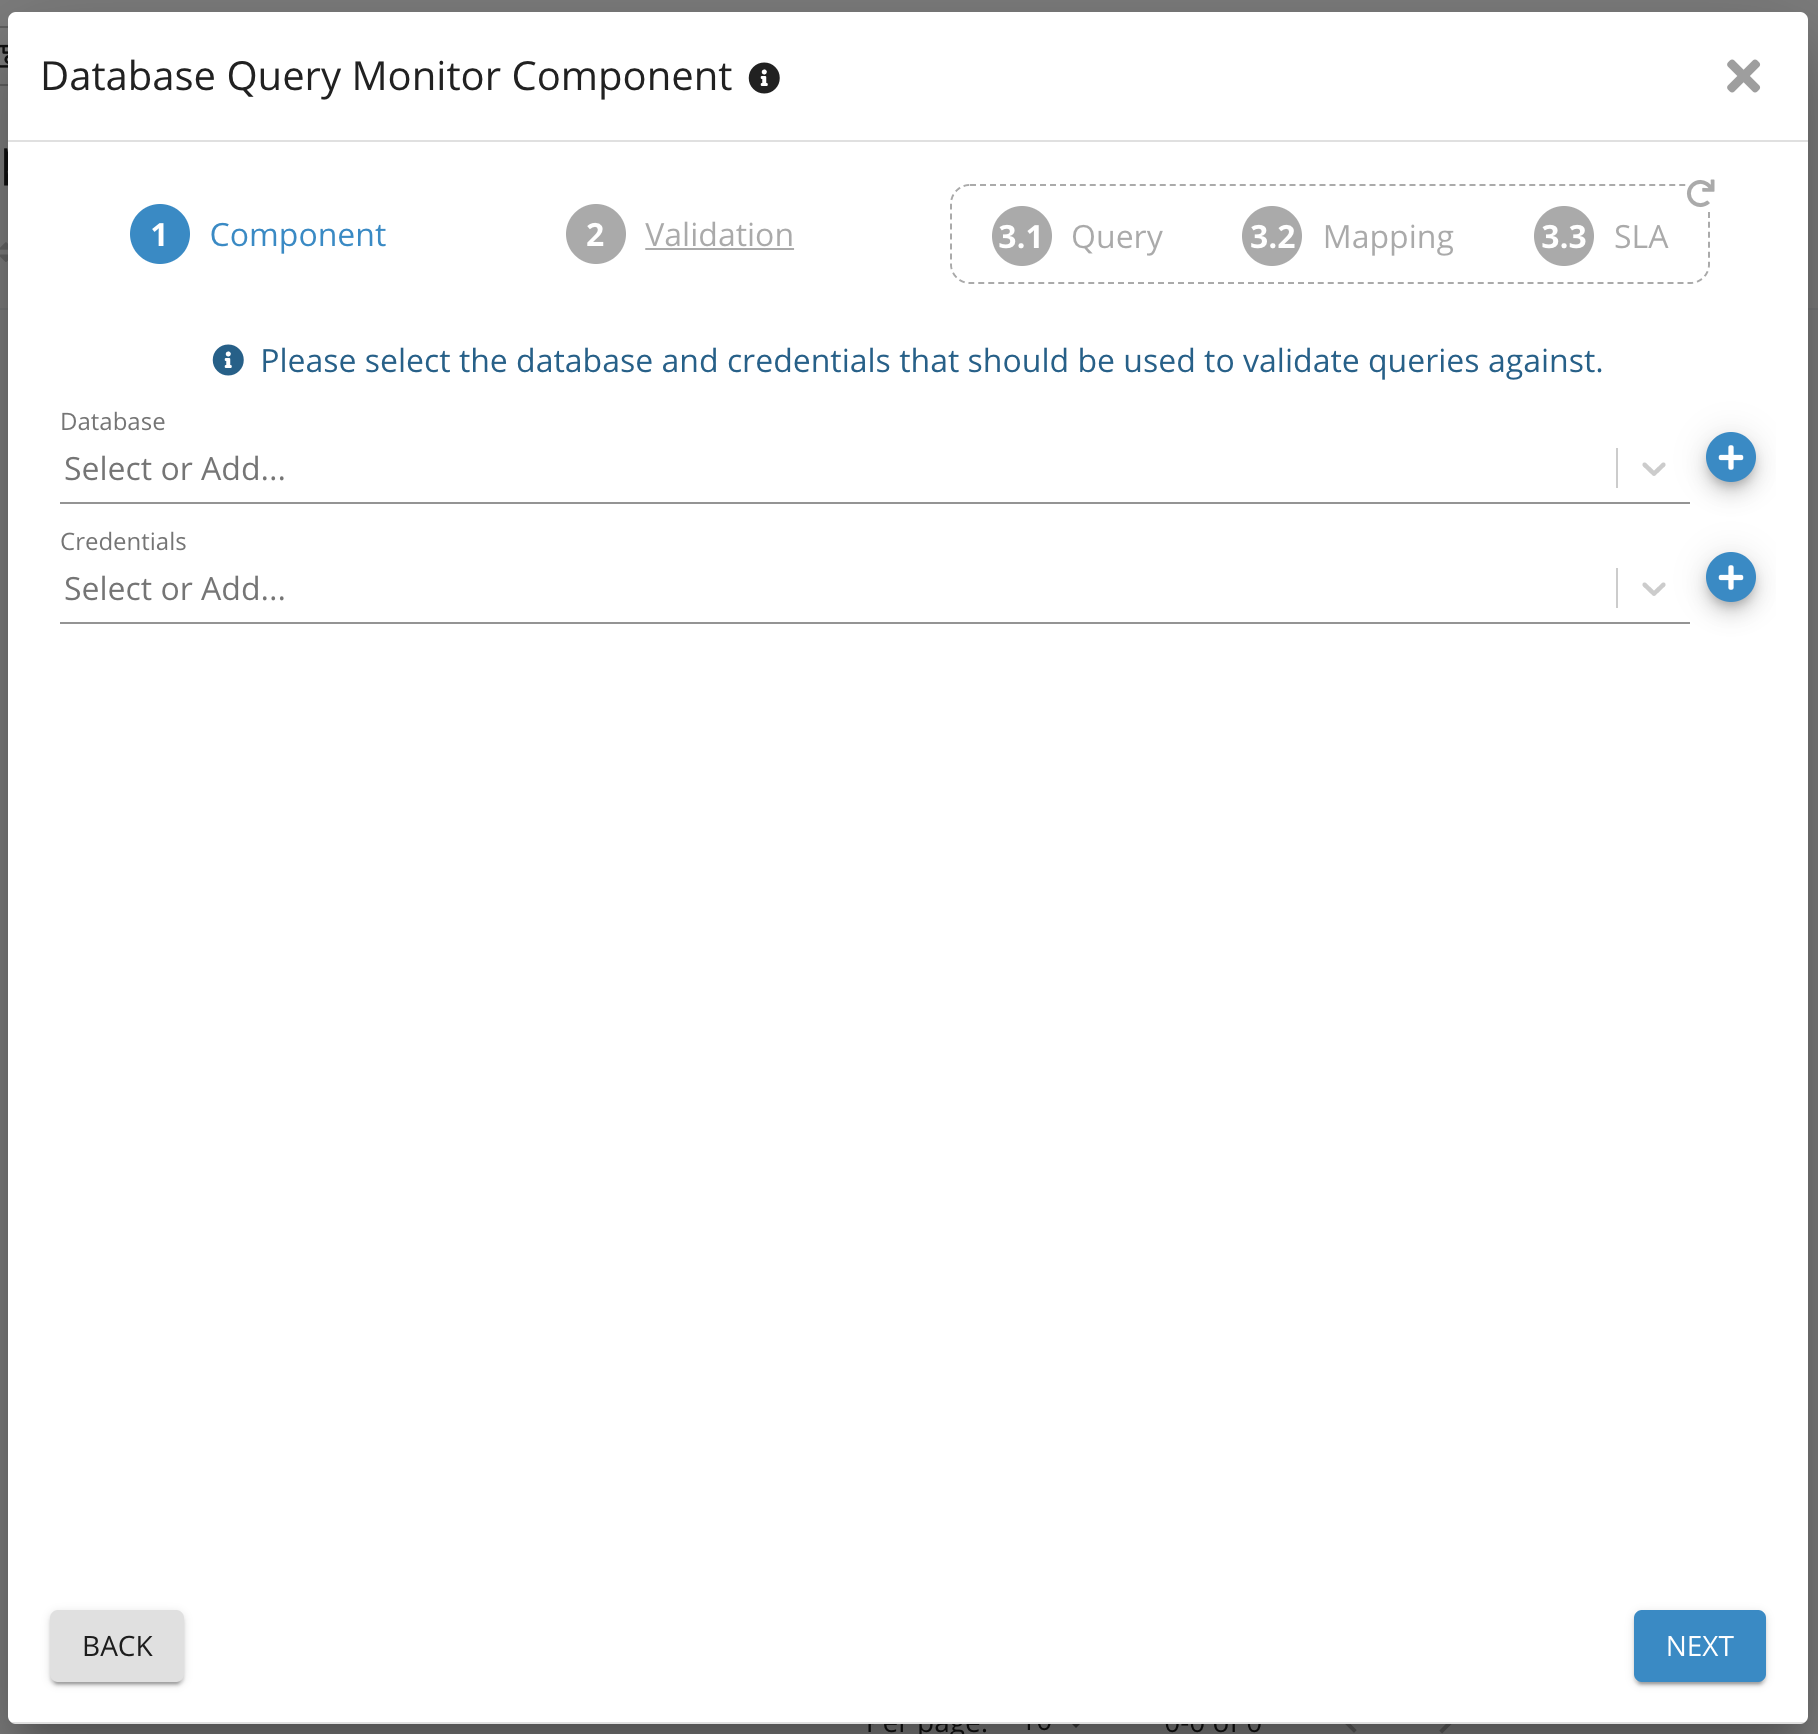
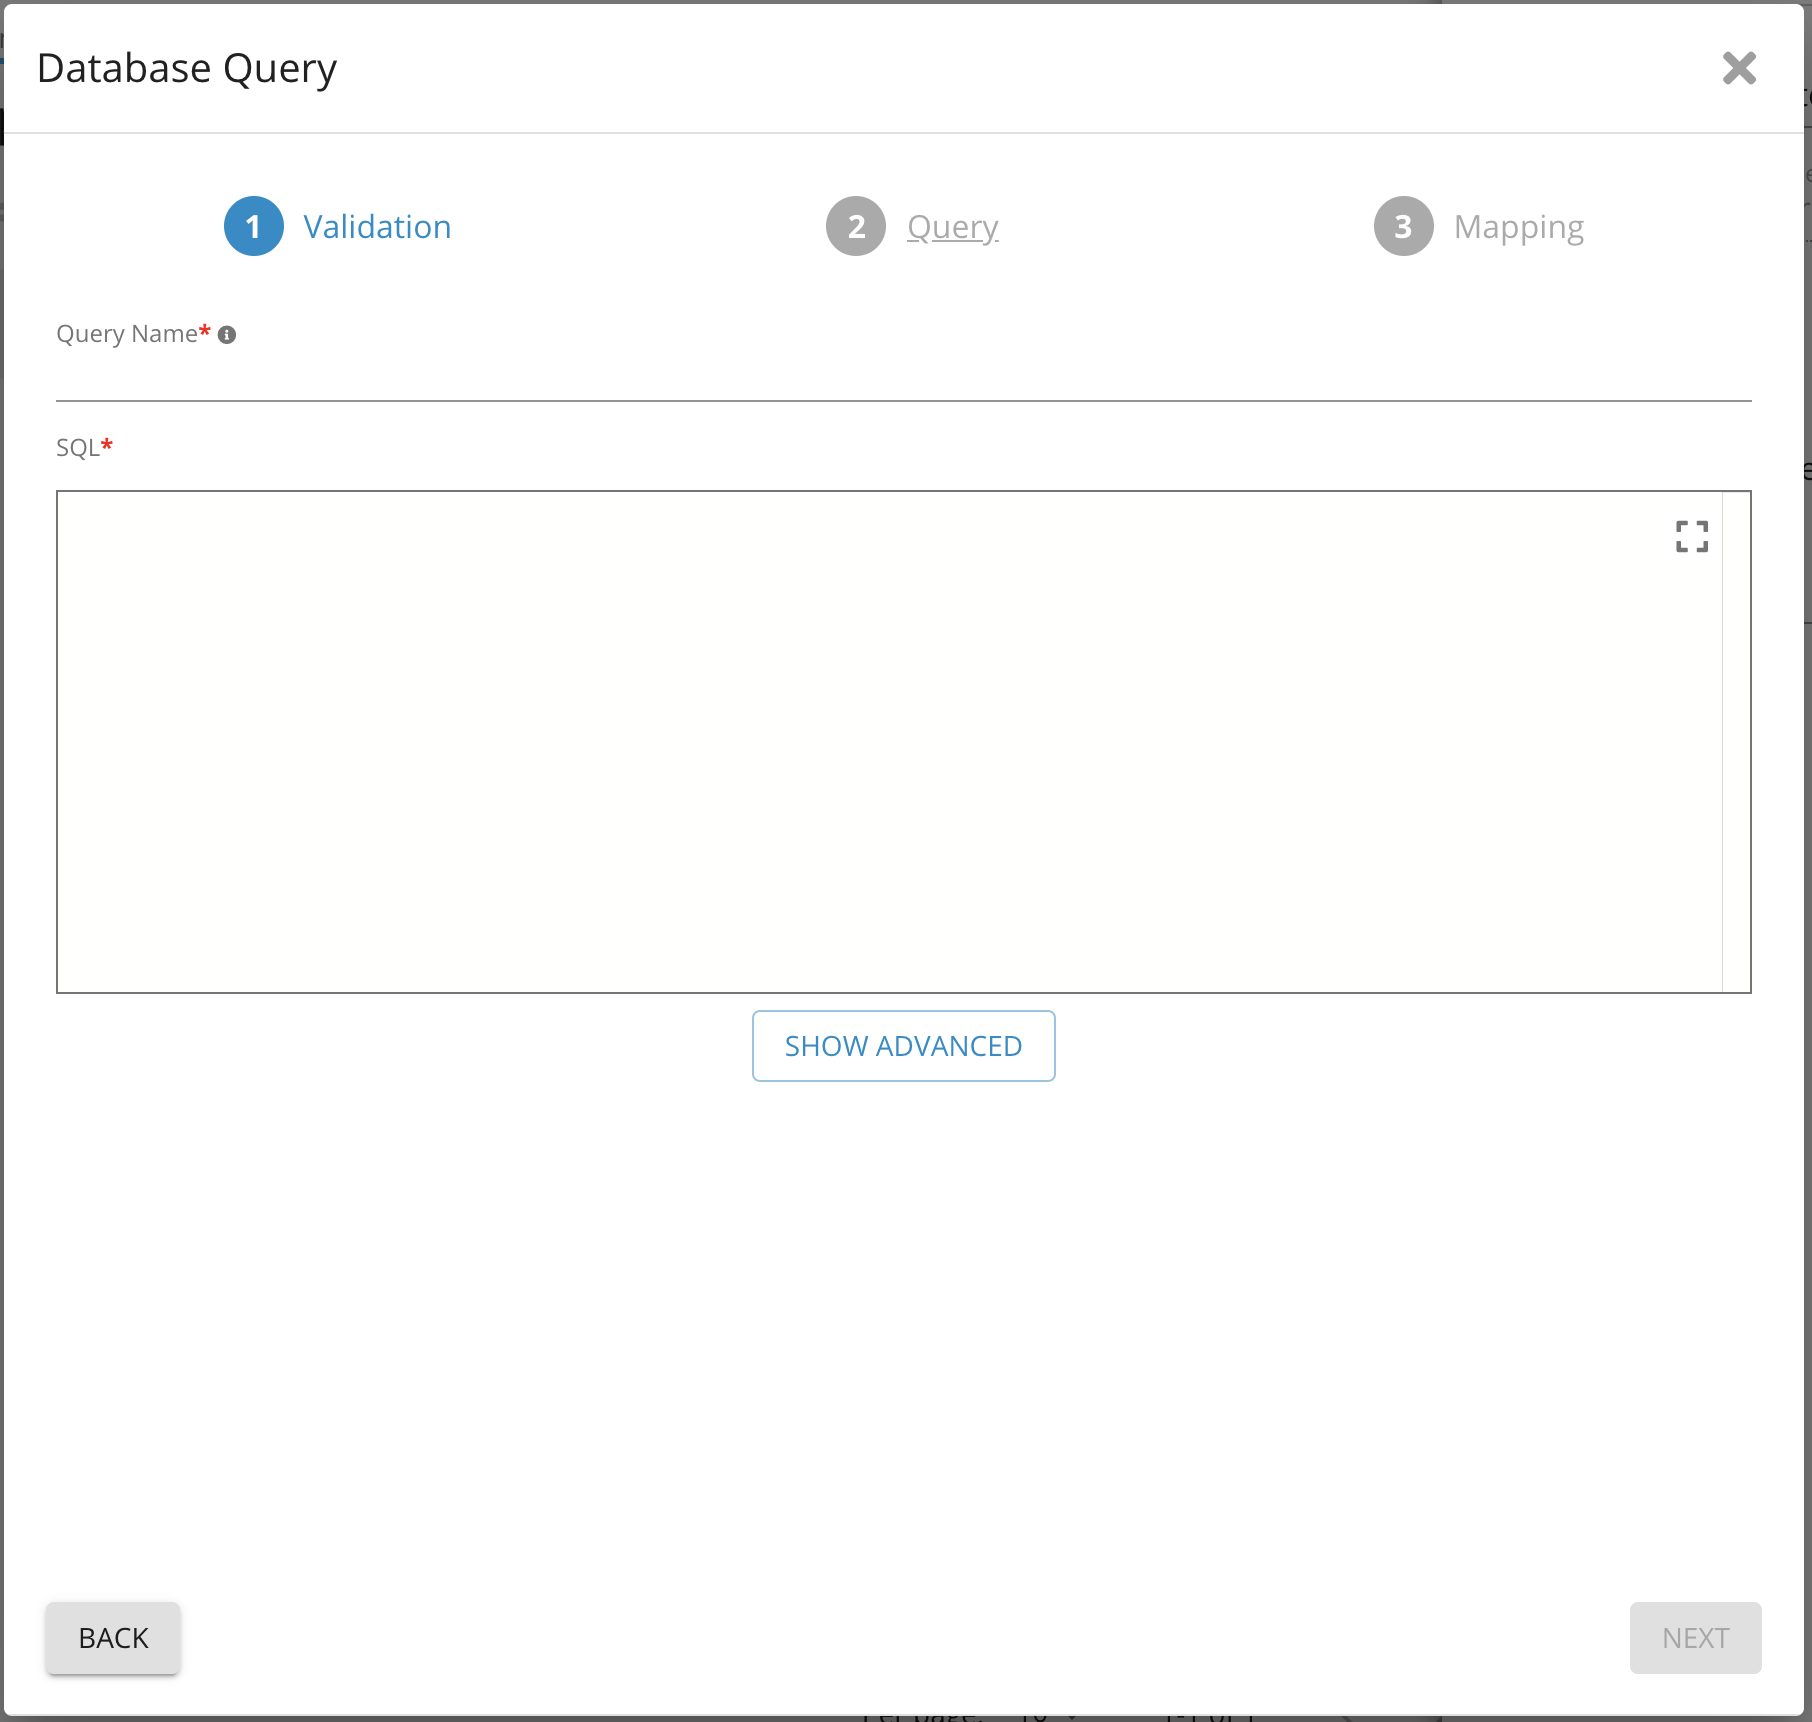
7. Provide a name for the query
8. Write SQL query in SQL field, you can validate the query here as well
9. Click Next
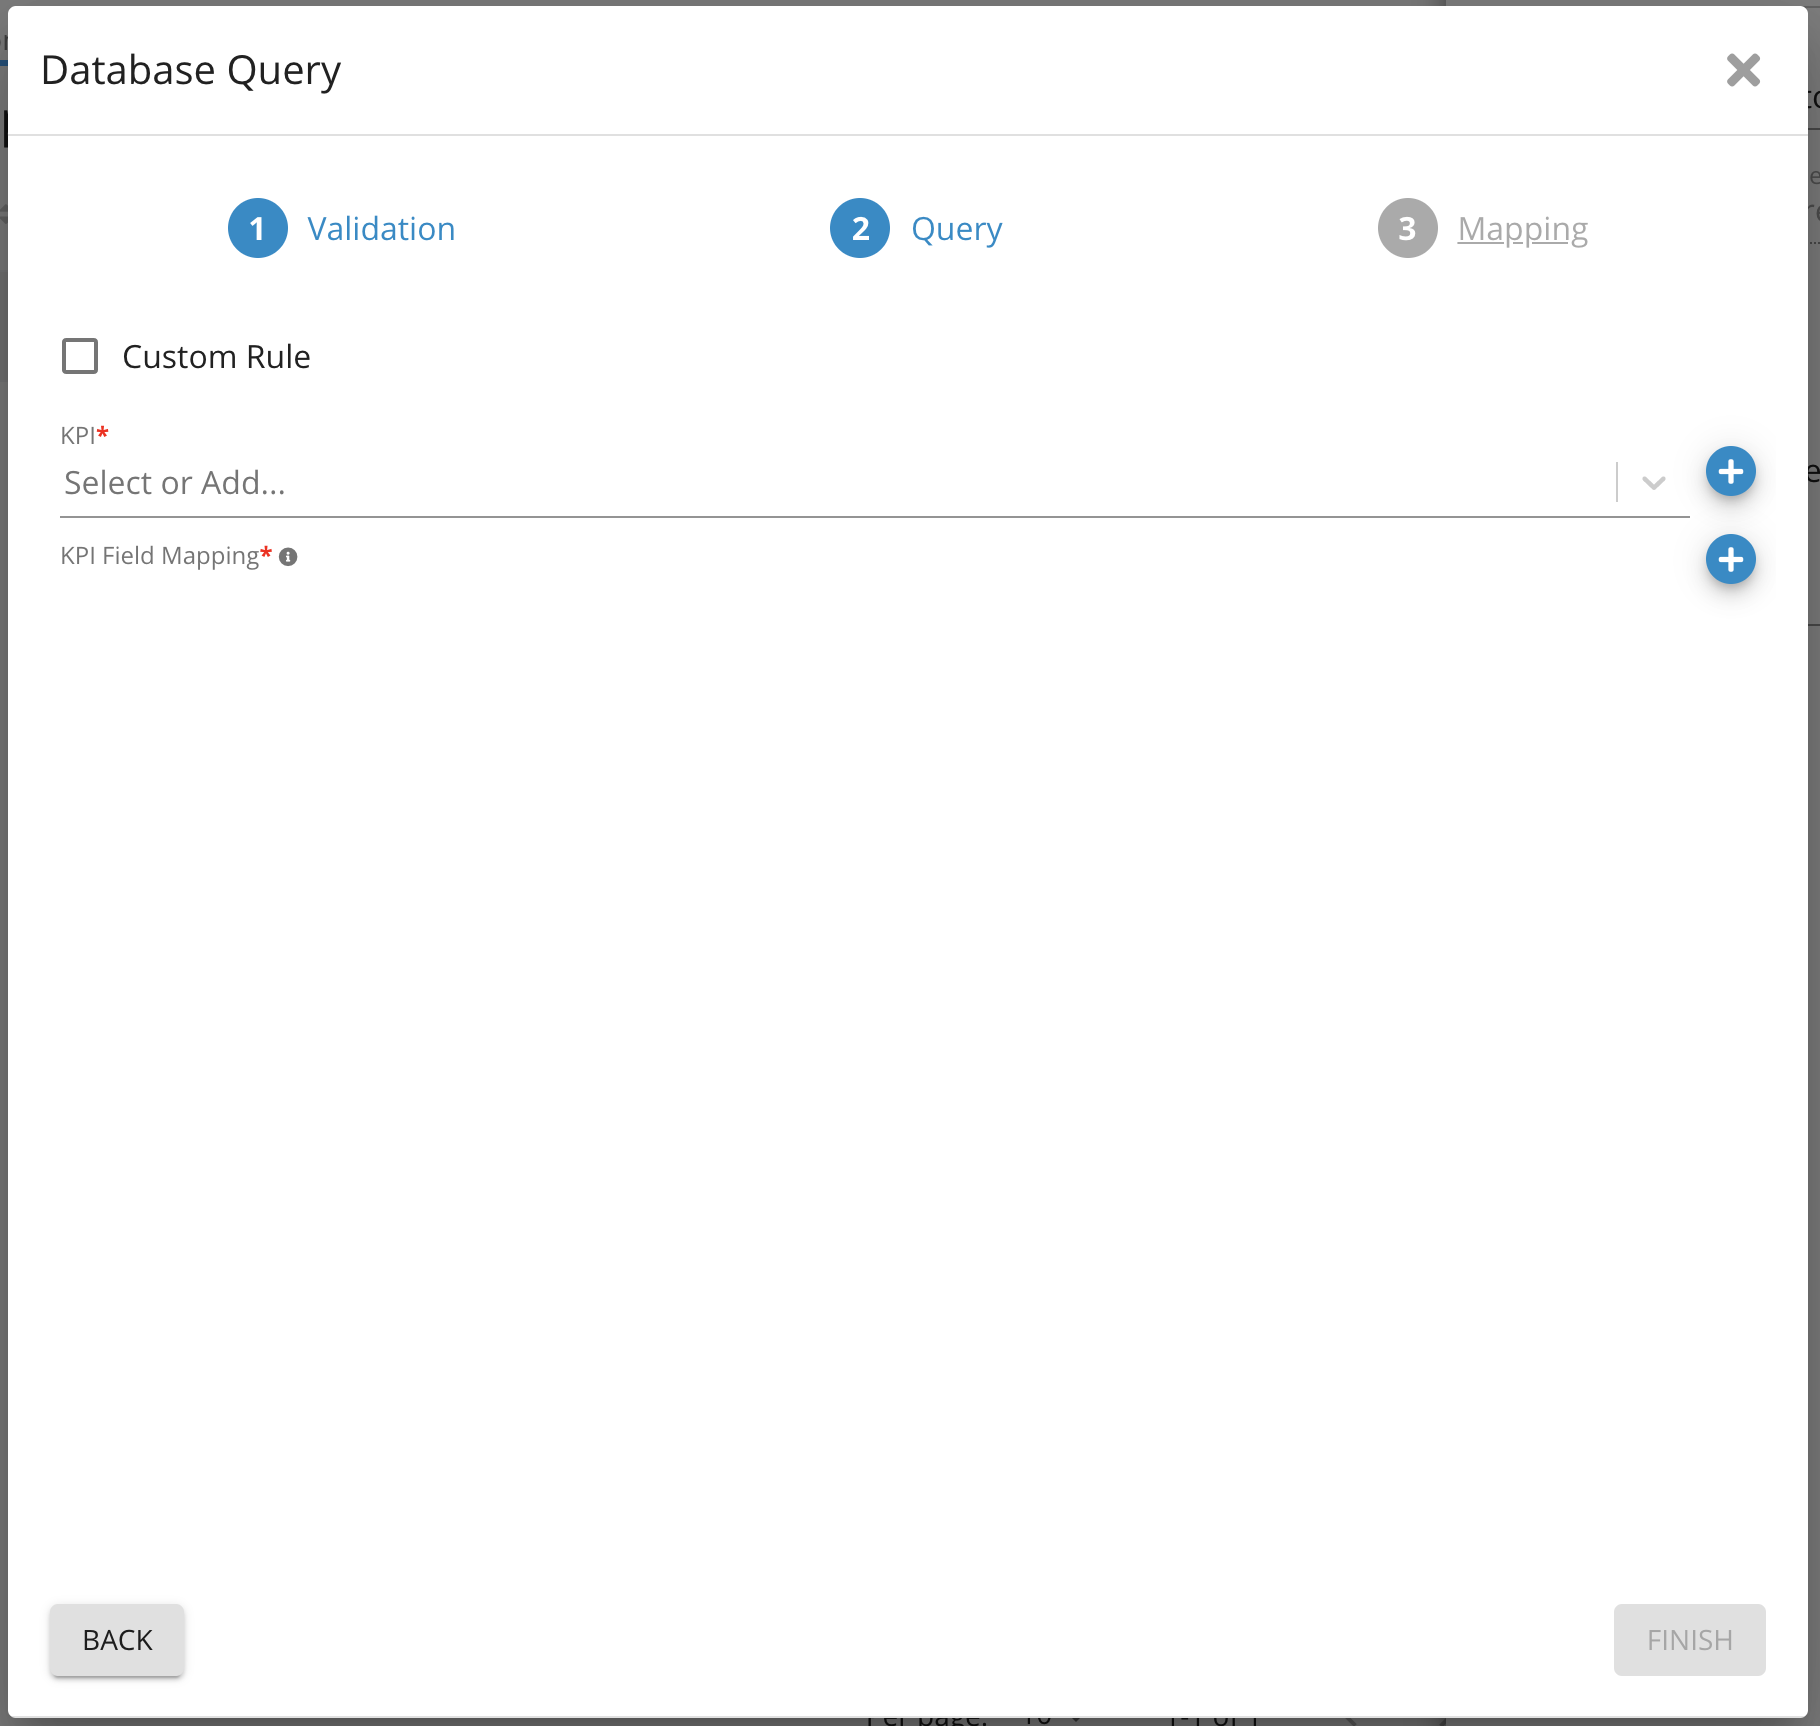
10. Select KPI from drop-down list
You may choose to add custom KPI and rules (discussed below)
11. Click Next
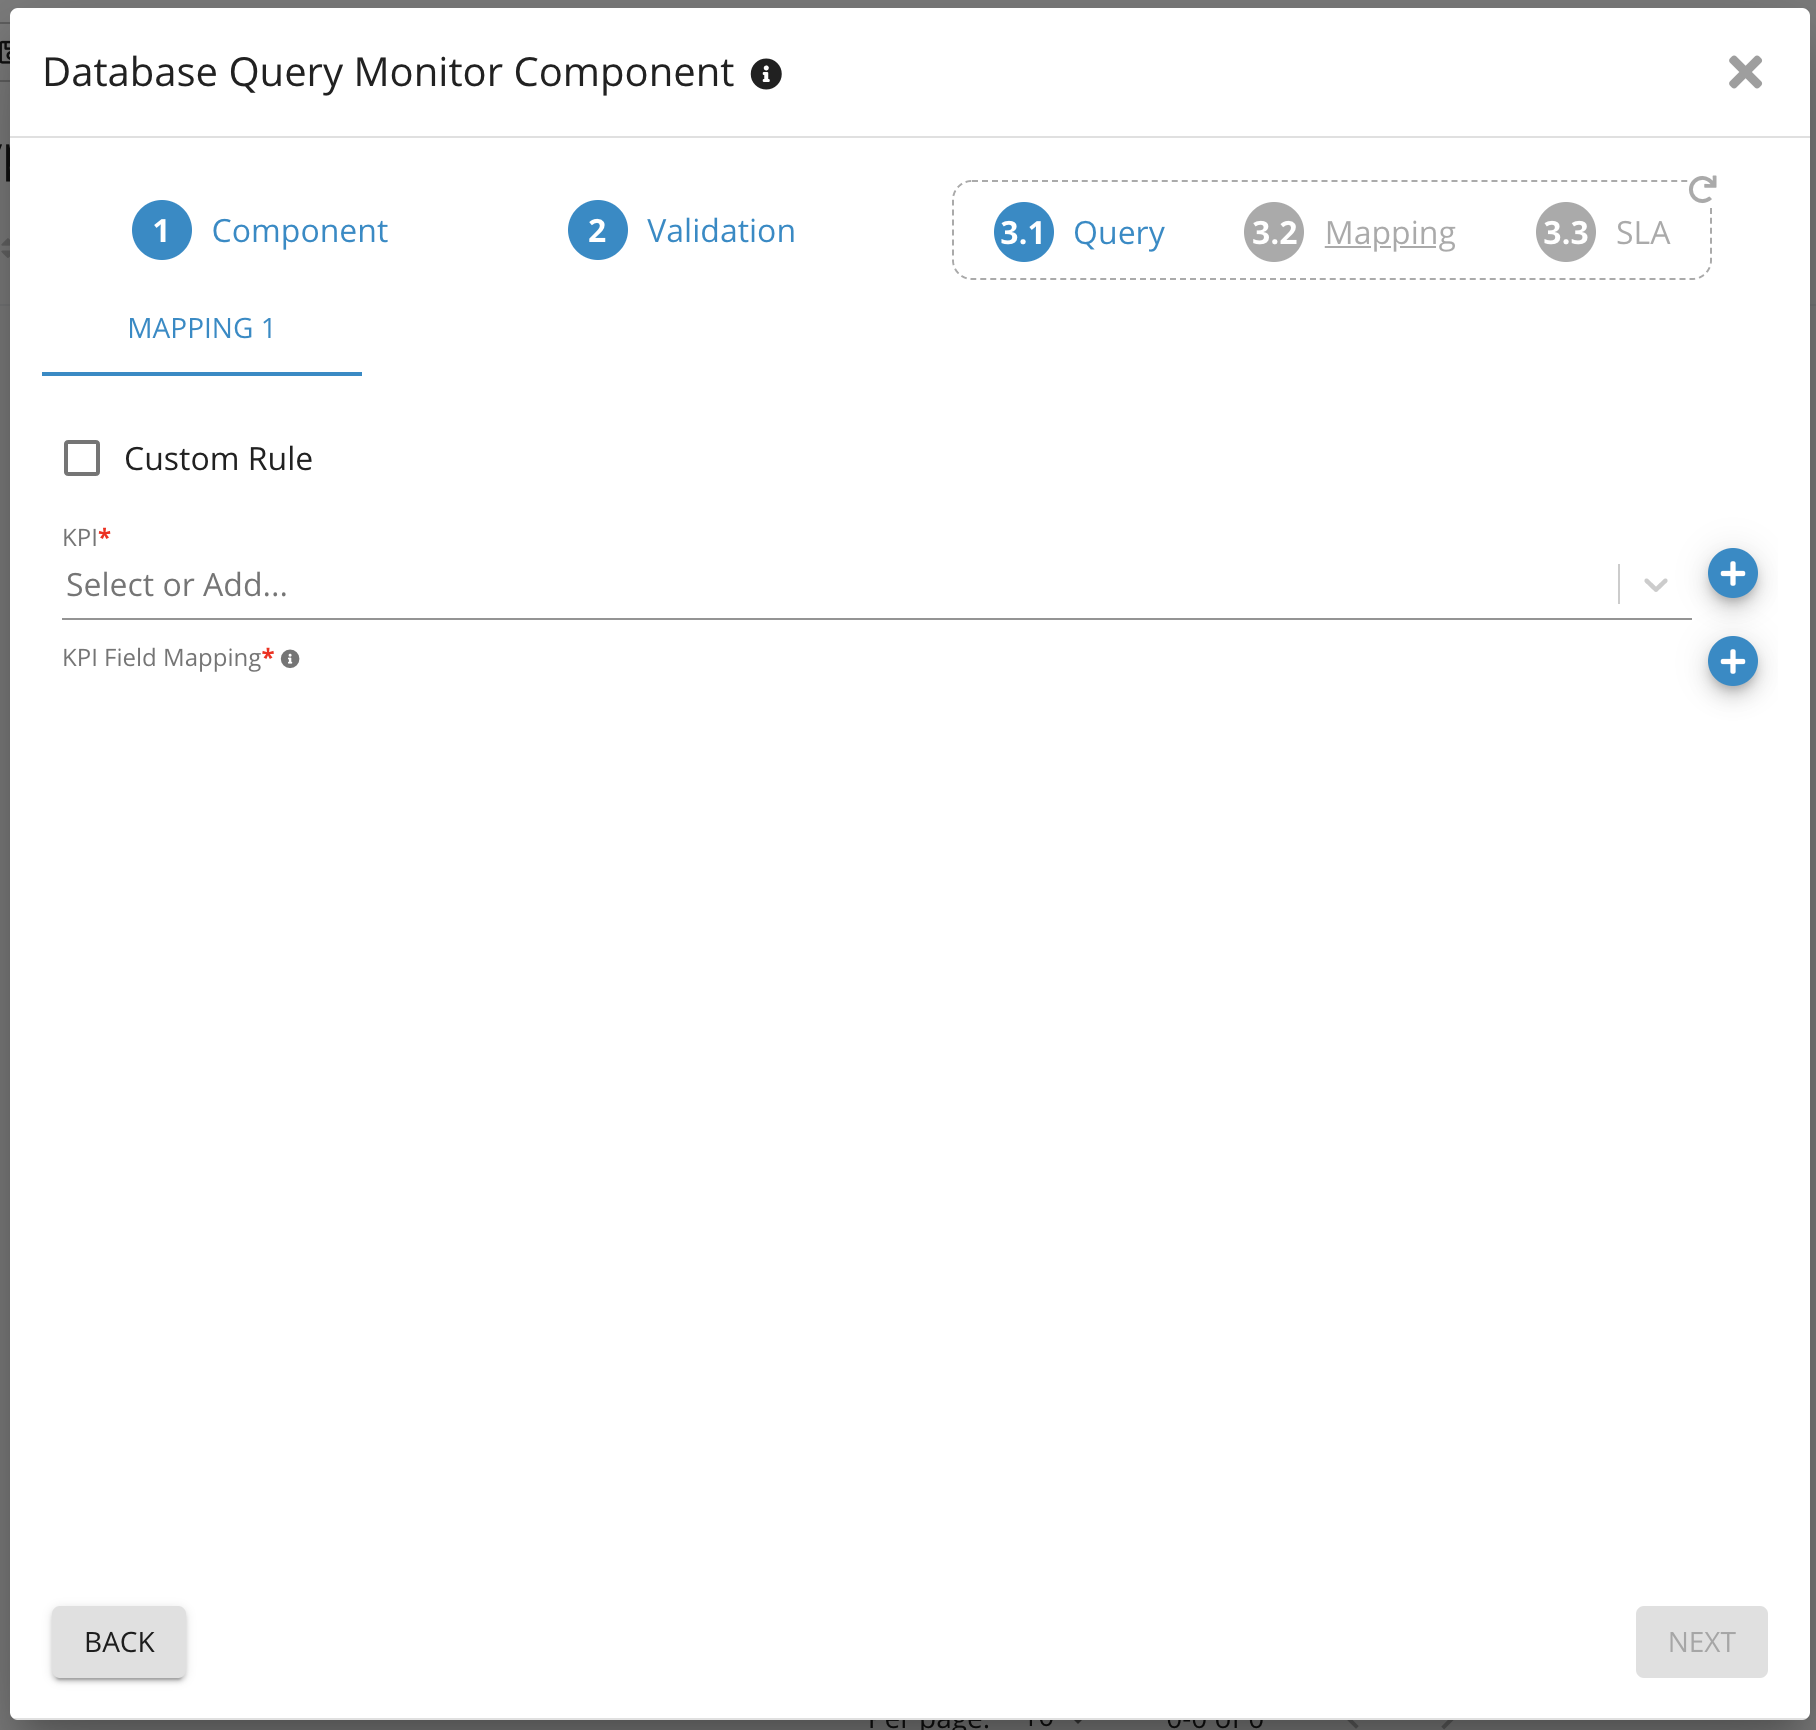
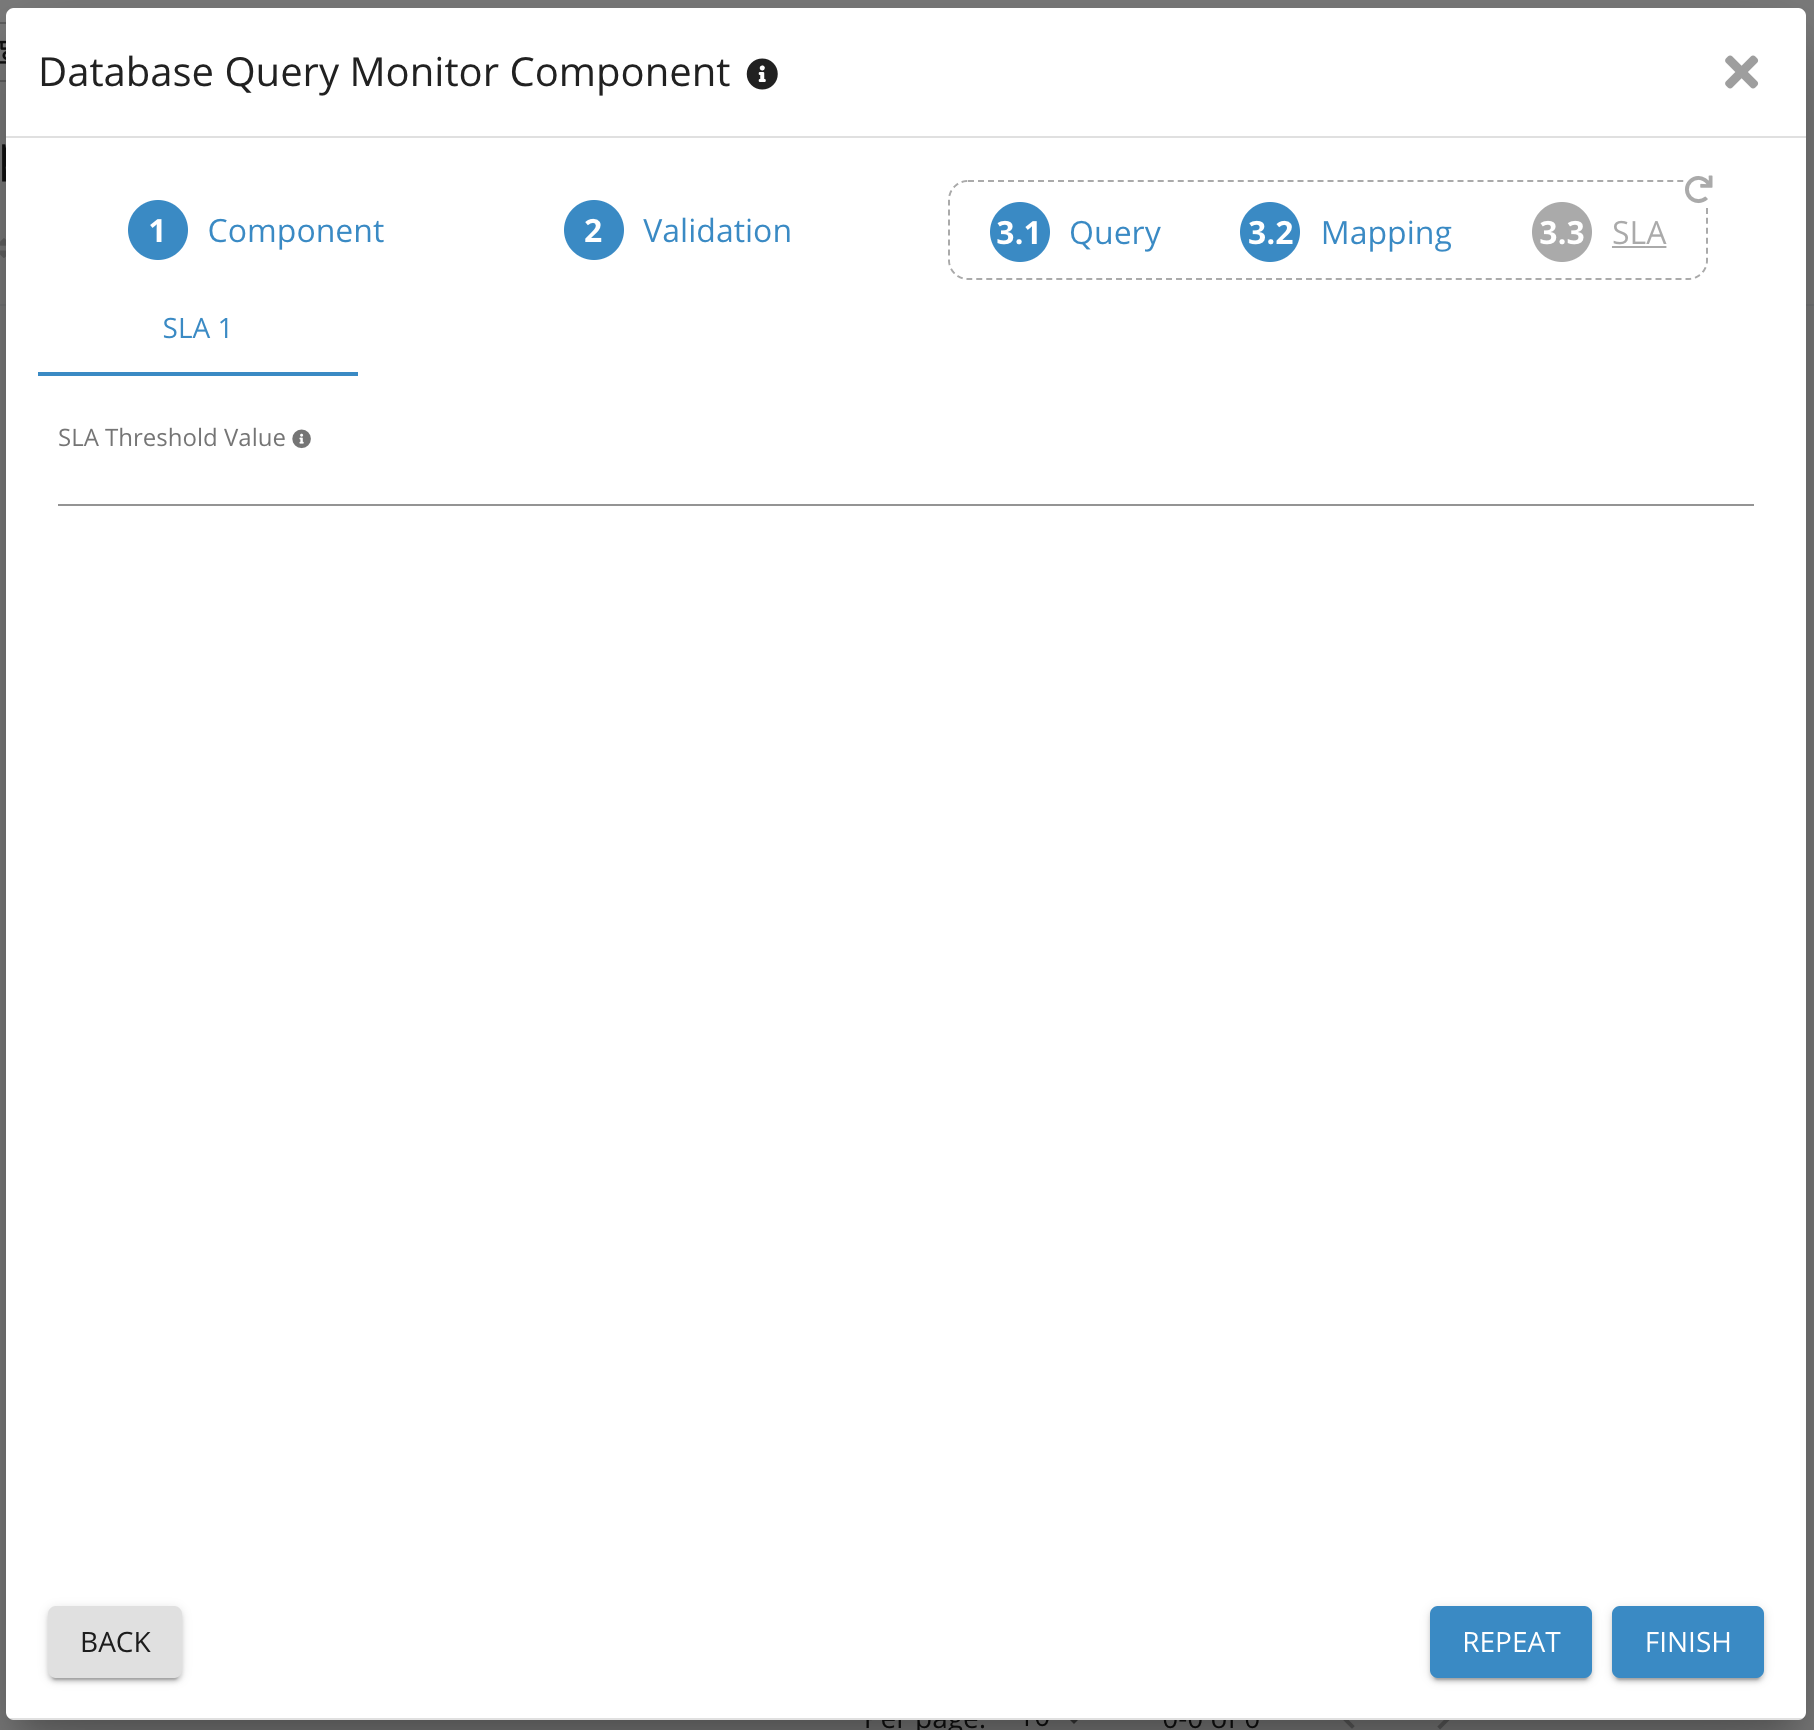
12. Provide SLA threshold value
13. Click Finish
Add an additional query to an existing Query Monitor
1. Log on to Germain Workspace > left menu > System > Component Types
2. Add and Query Monitor Component
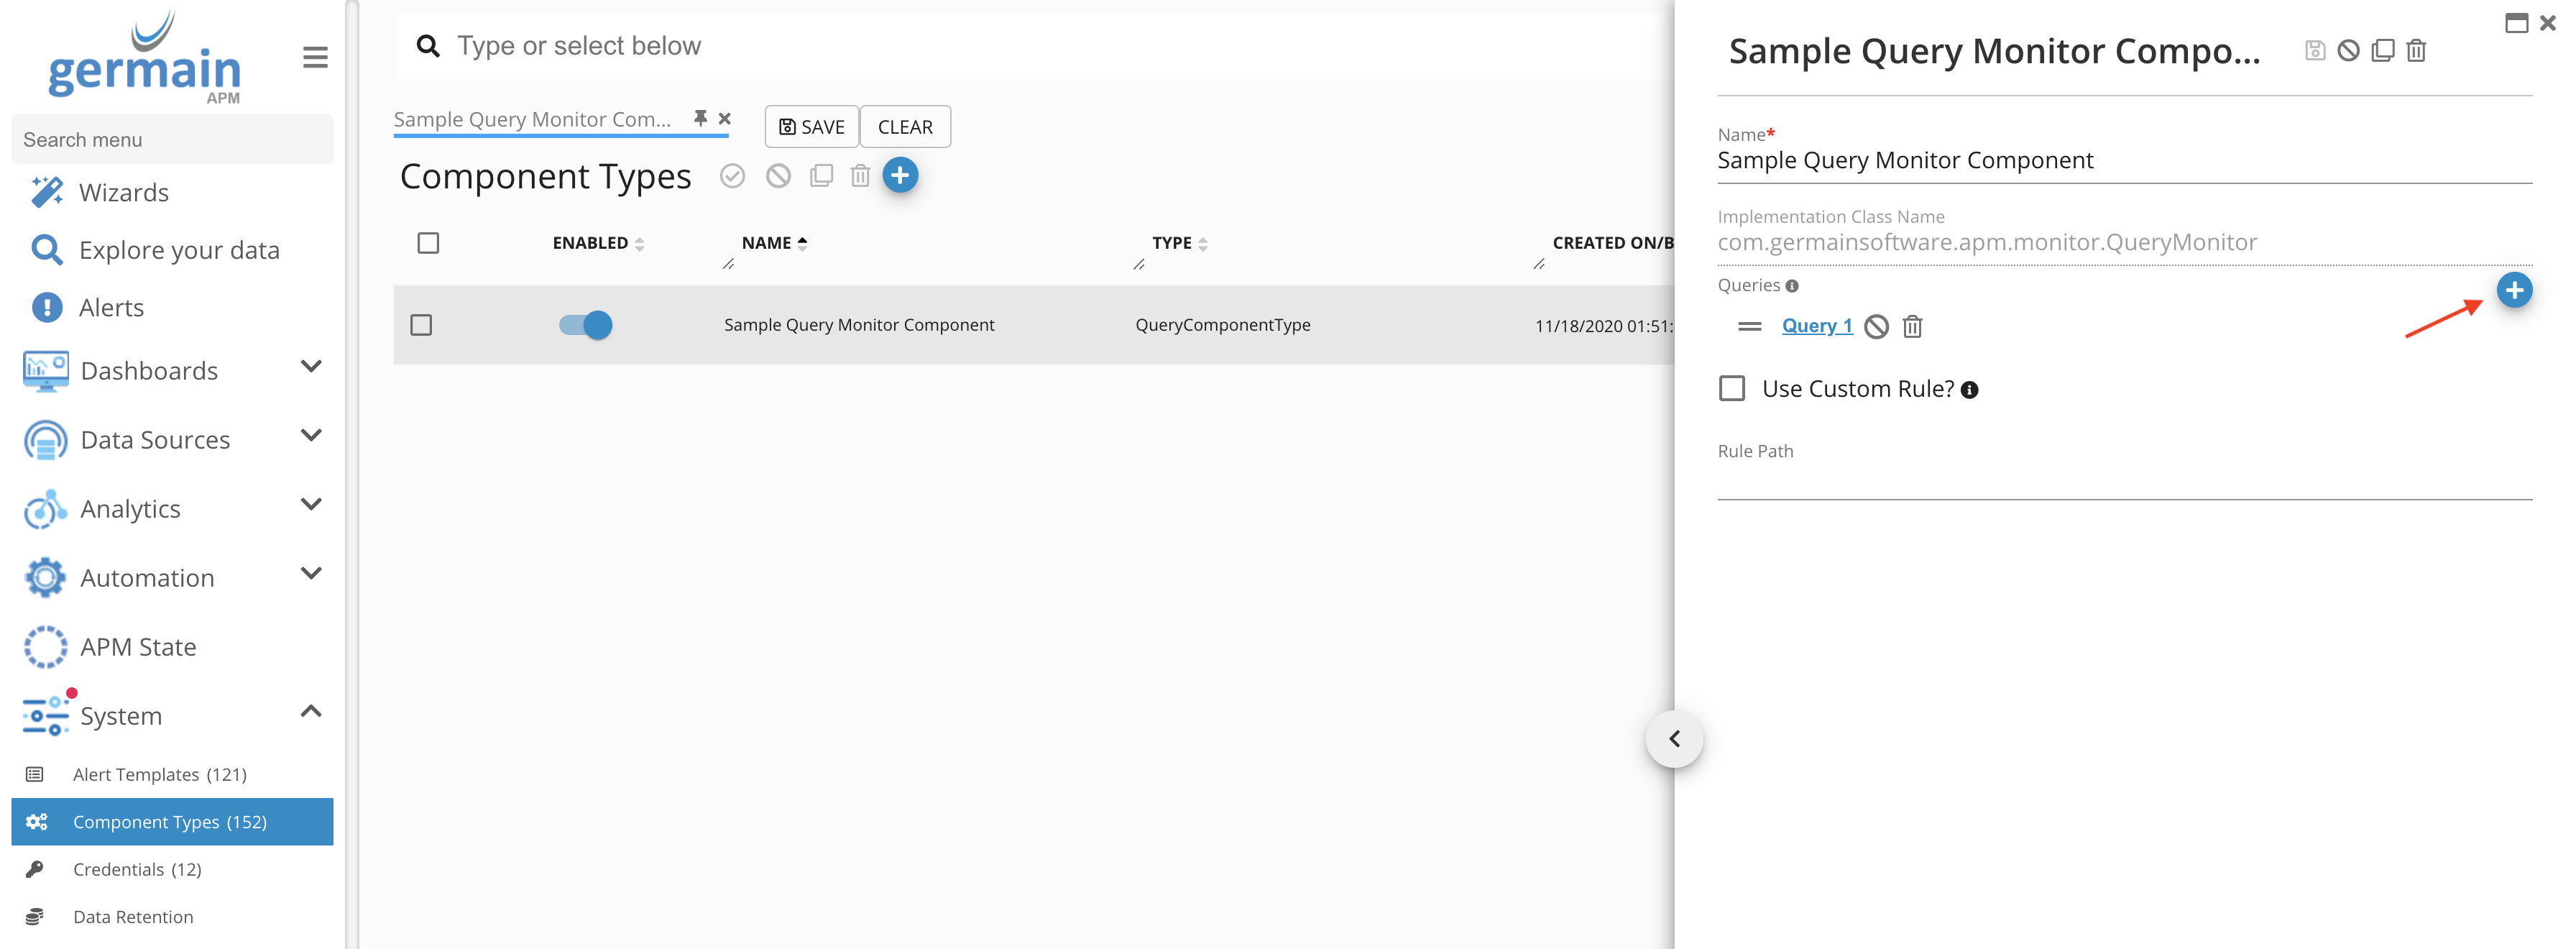
3. Click on the component to edit it
4. Click the add/plus button under Queries section
5. Select Database and Credentials for the database
6. Click Next
7. Provide a name for the query
8. Write SQL query in SQL field, you can validate the query here as well
9. Click Next
10. Check Custom rule and select KPI
11. Click Finish
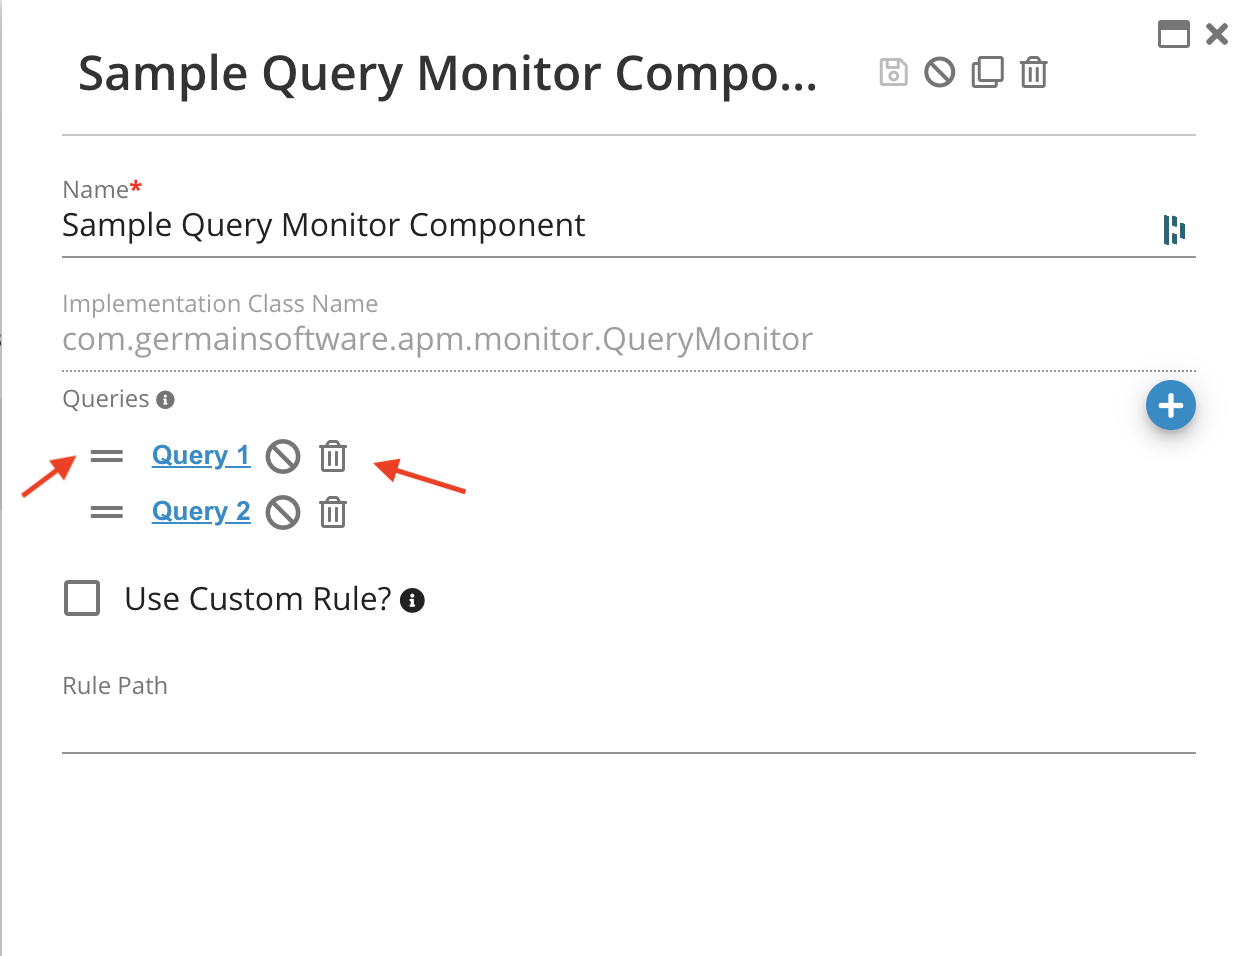
12. You can view all the queries for this component here
13. From this page you can enable, disable, delete or reorder the priority of queries
Create KPI for Query Monitor
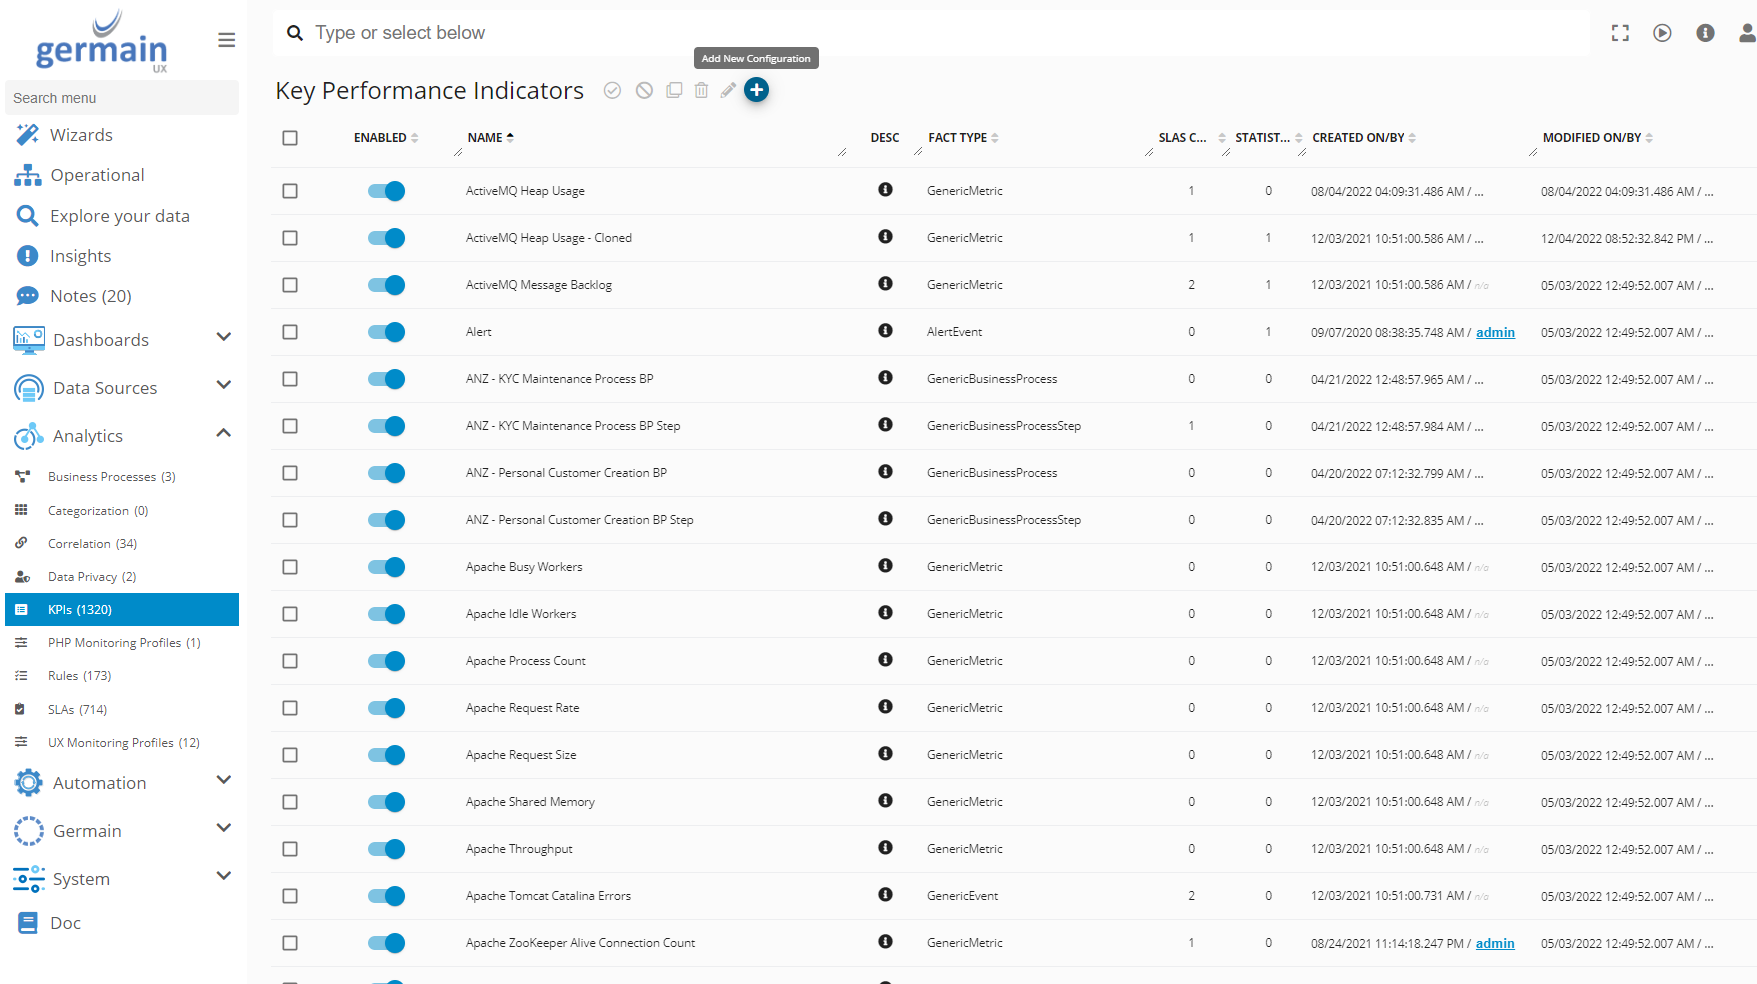
1. Germain Workspace > left menu > Analytics > KPIs
2. Click add/plus button
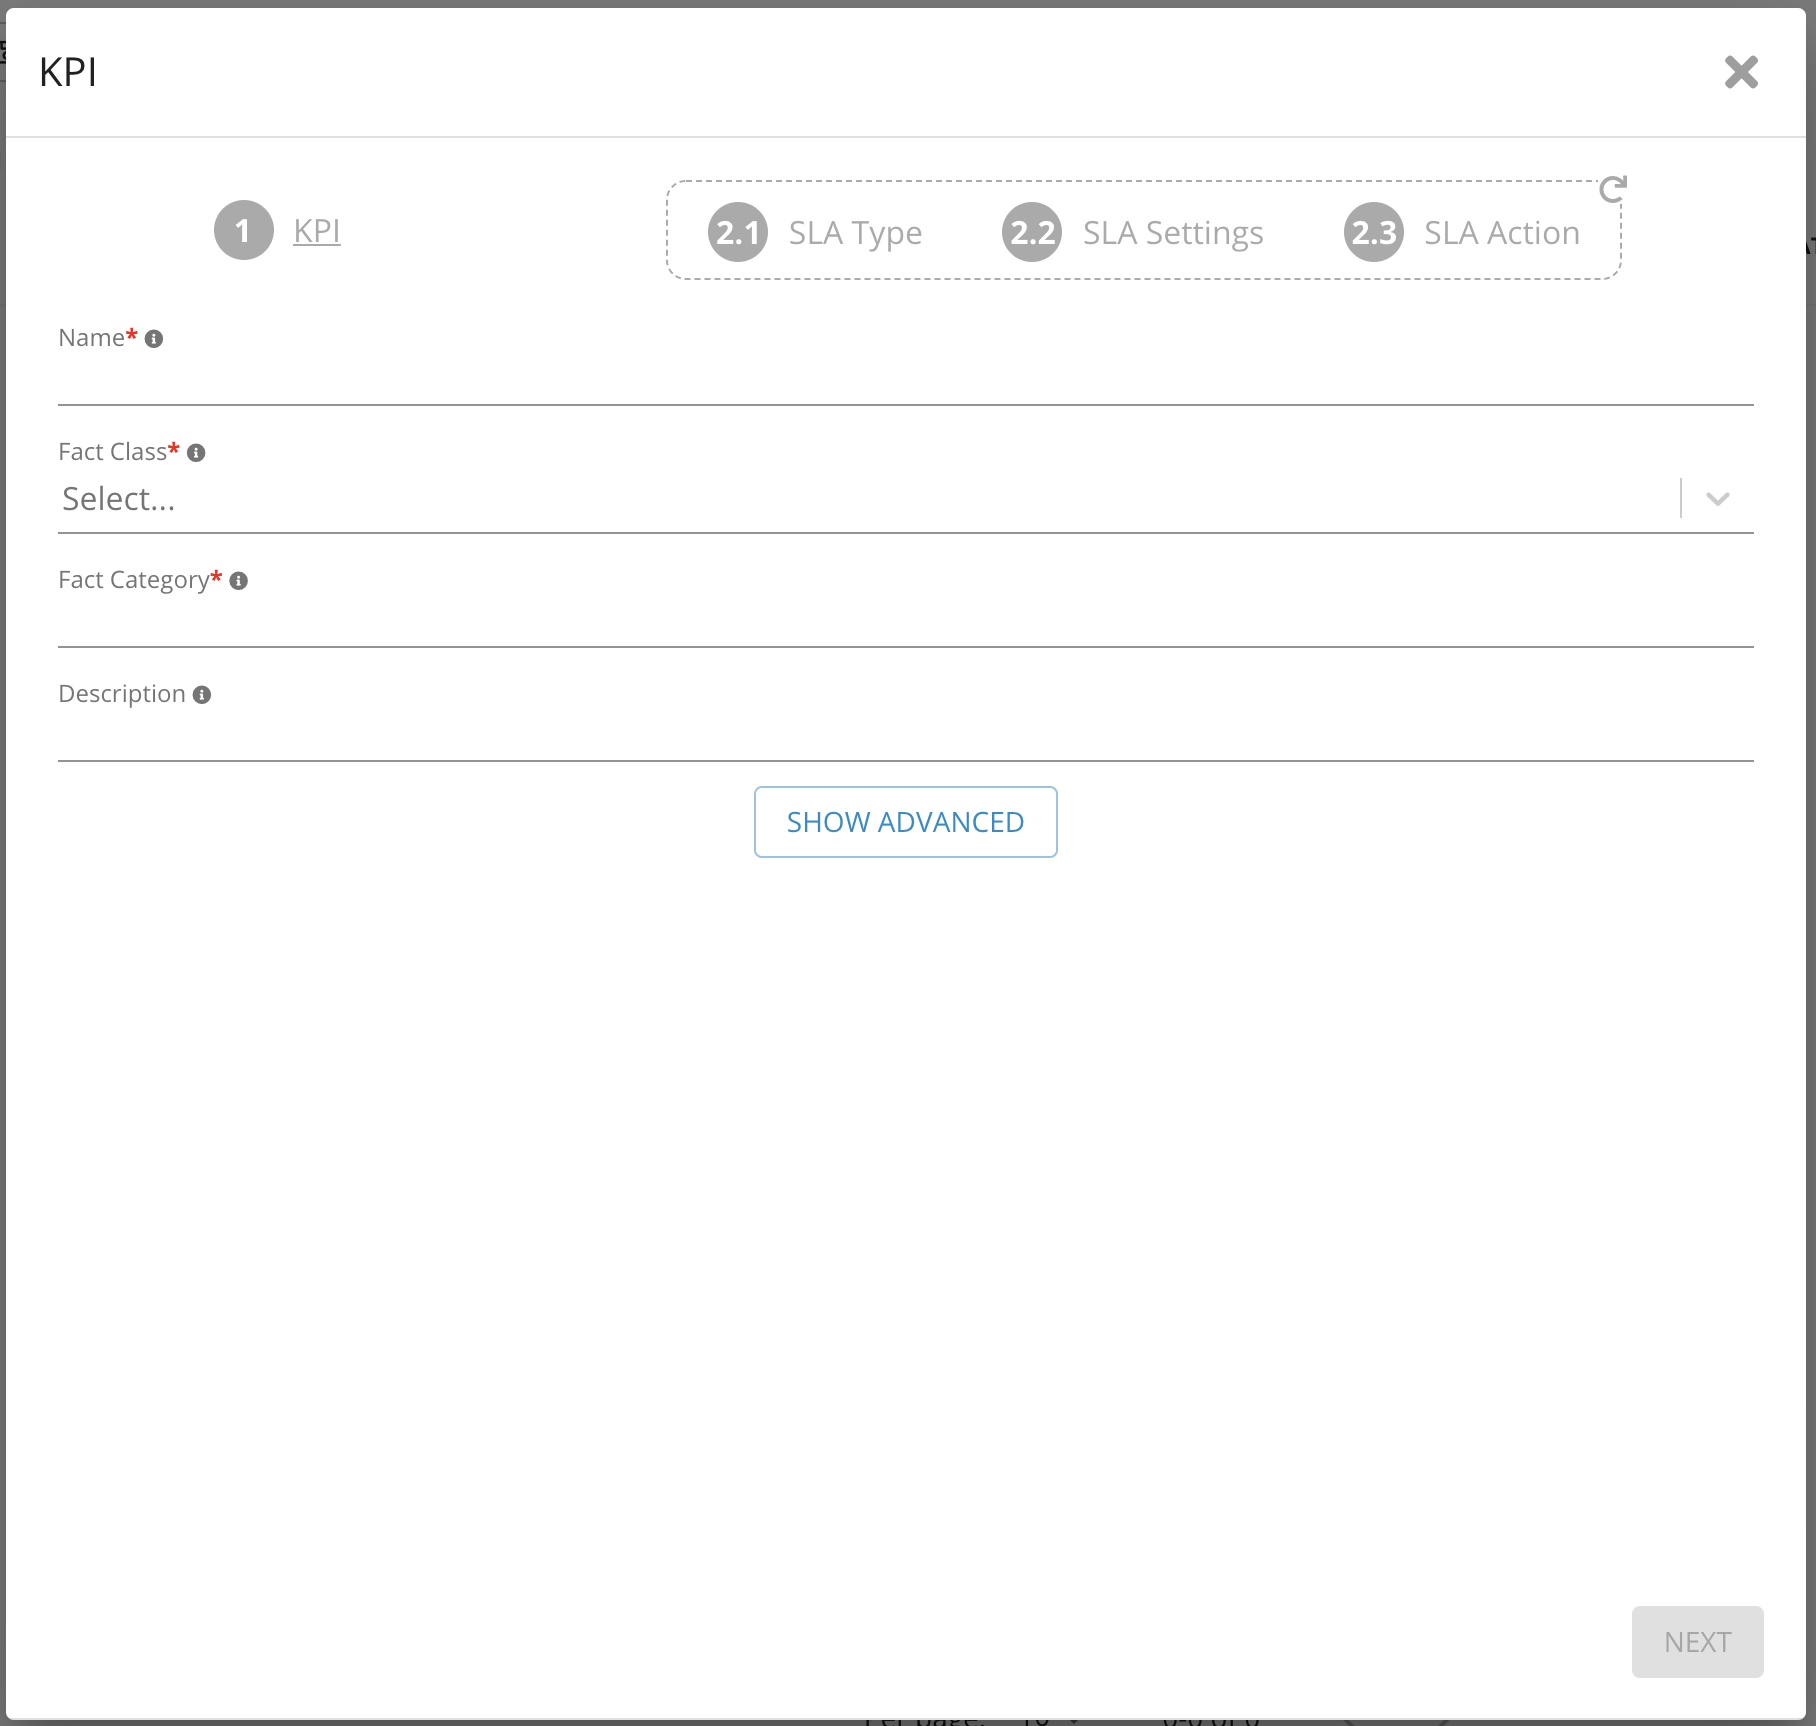
3. Provide Name
4. Choose Generic Event or Generic Transaction as Fact Class
5. Provide a unique name for Fact Category(i.e Query: Sample Query)
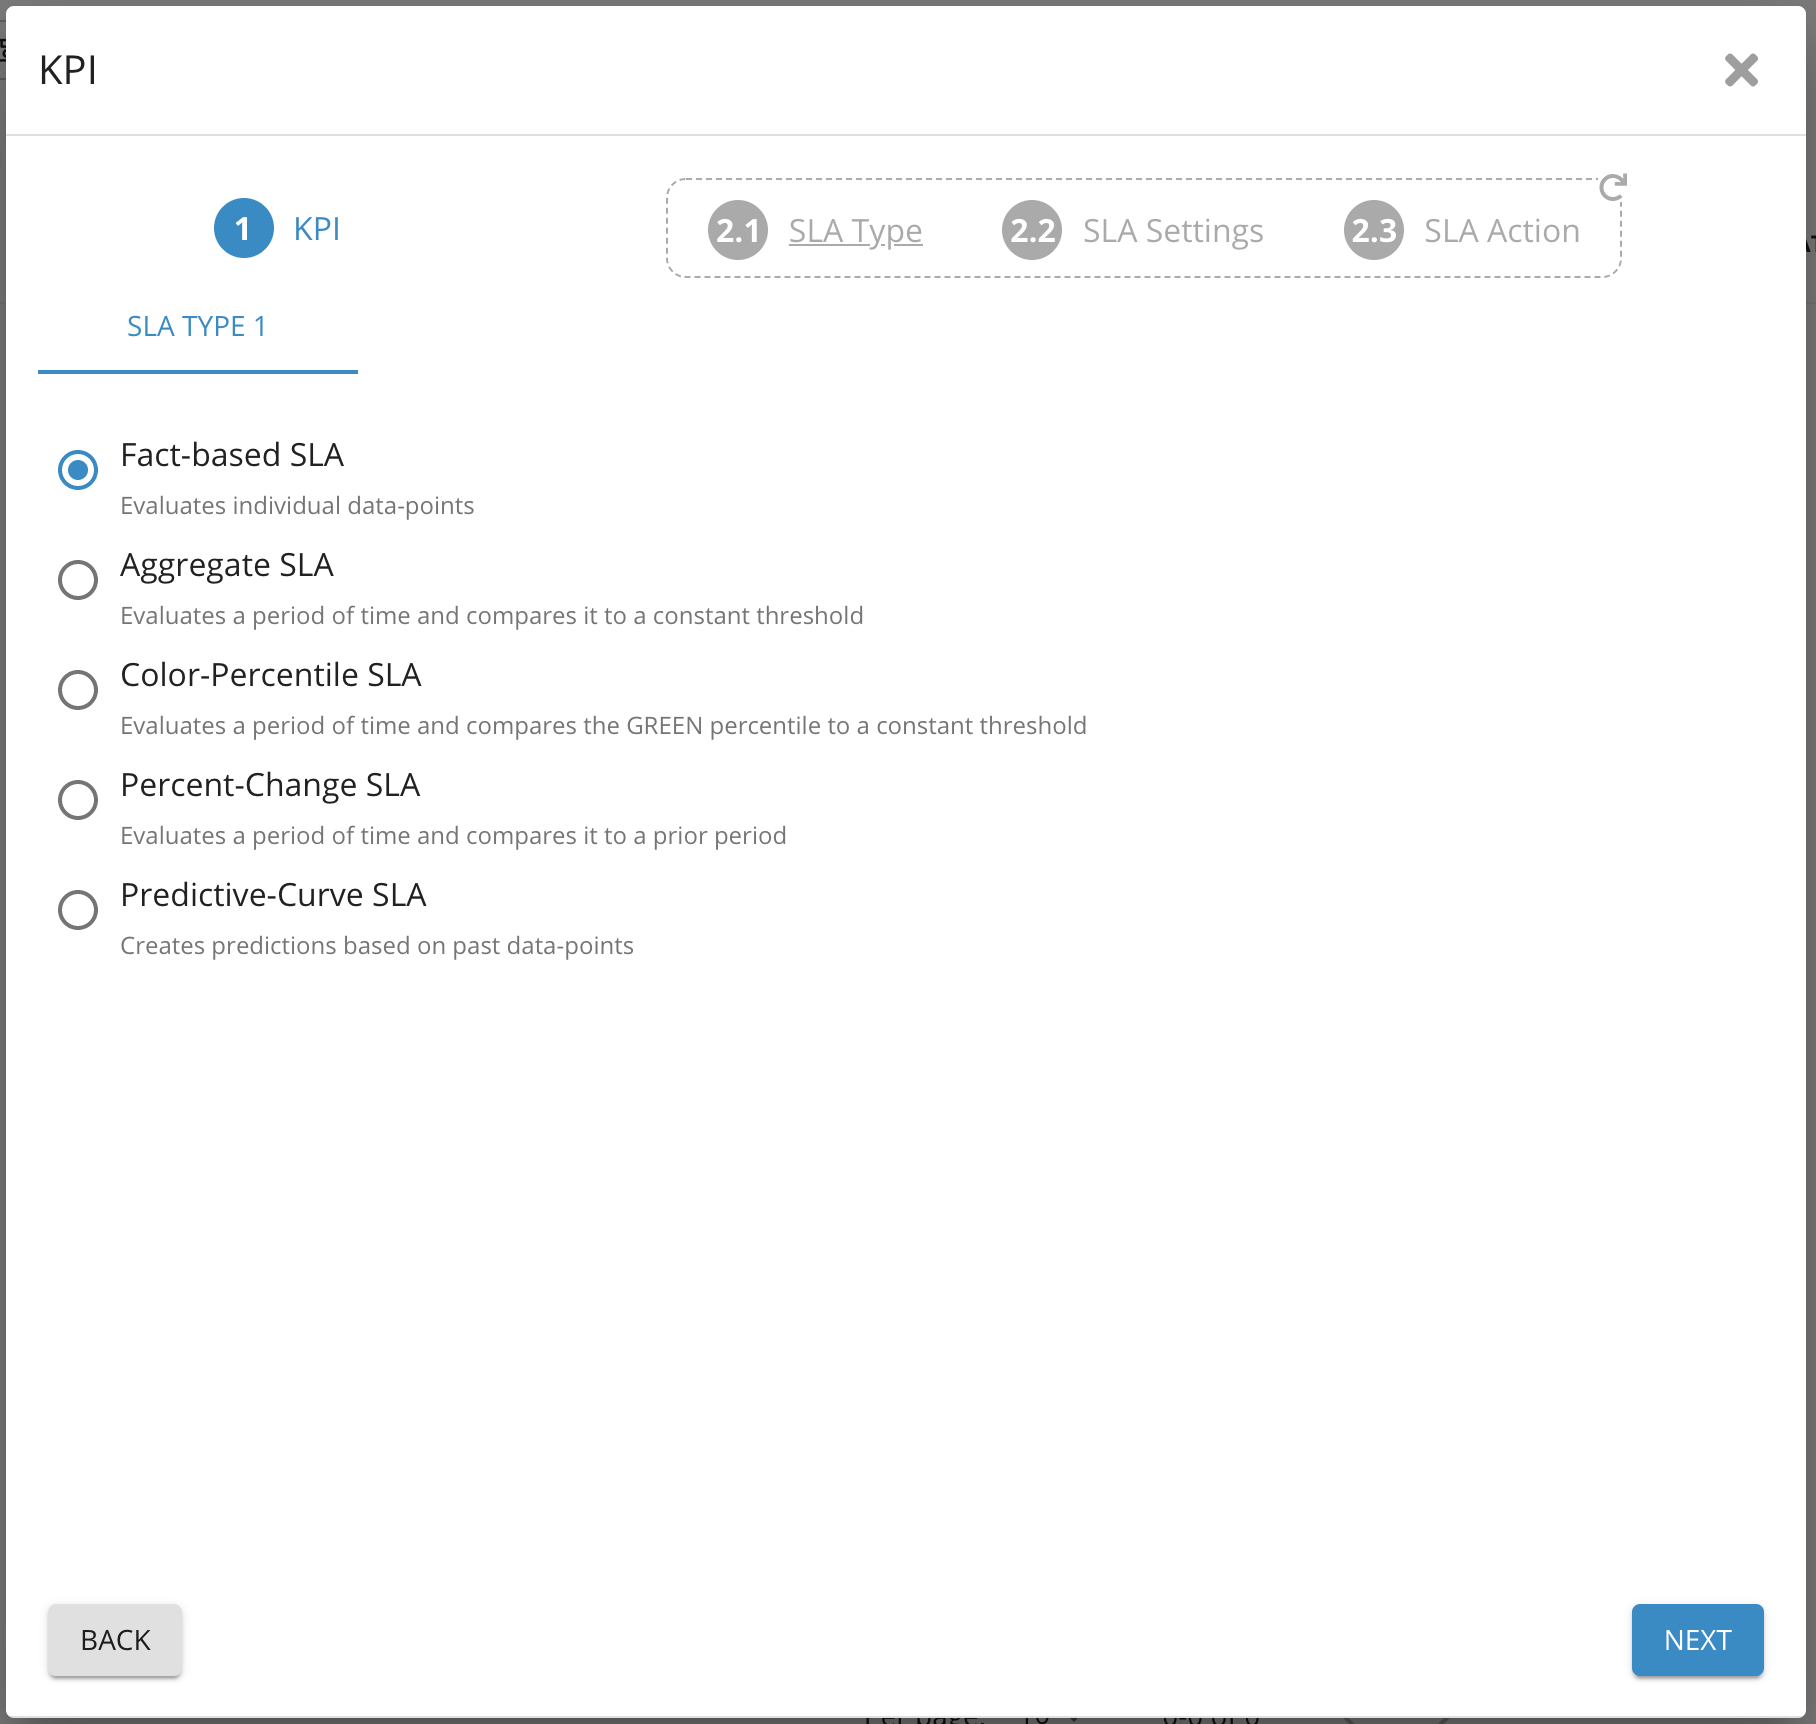
6. Select Fact-based SLA
7. Click Next
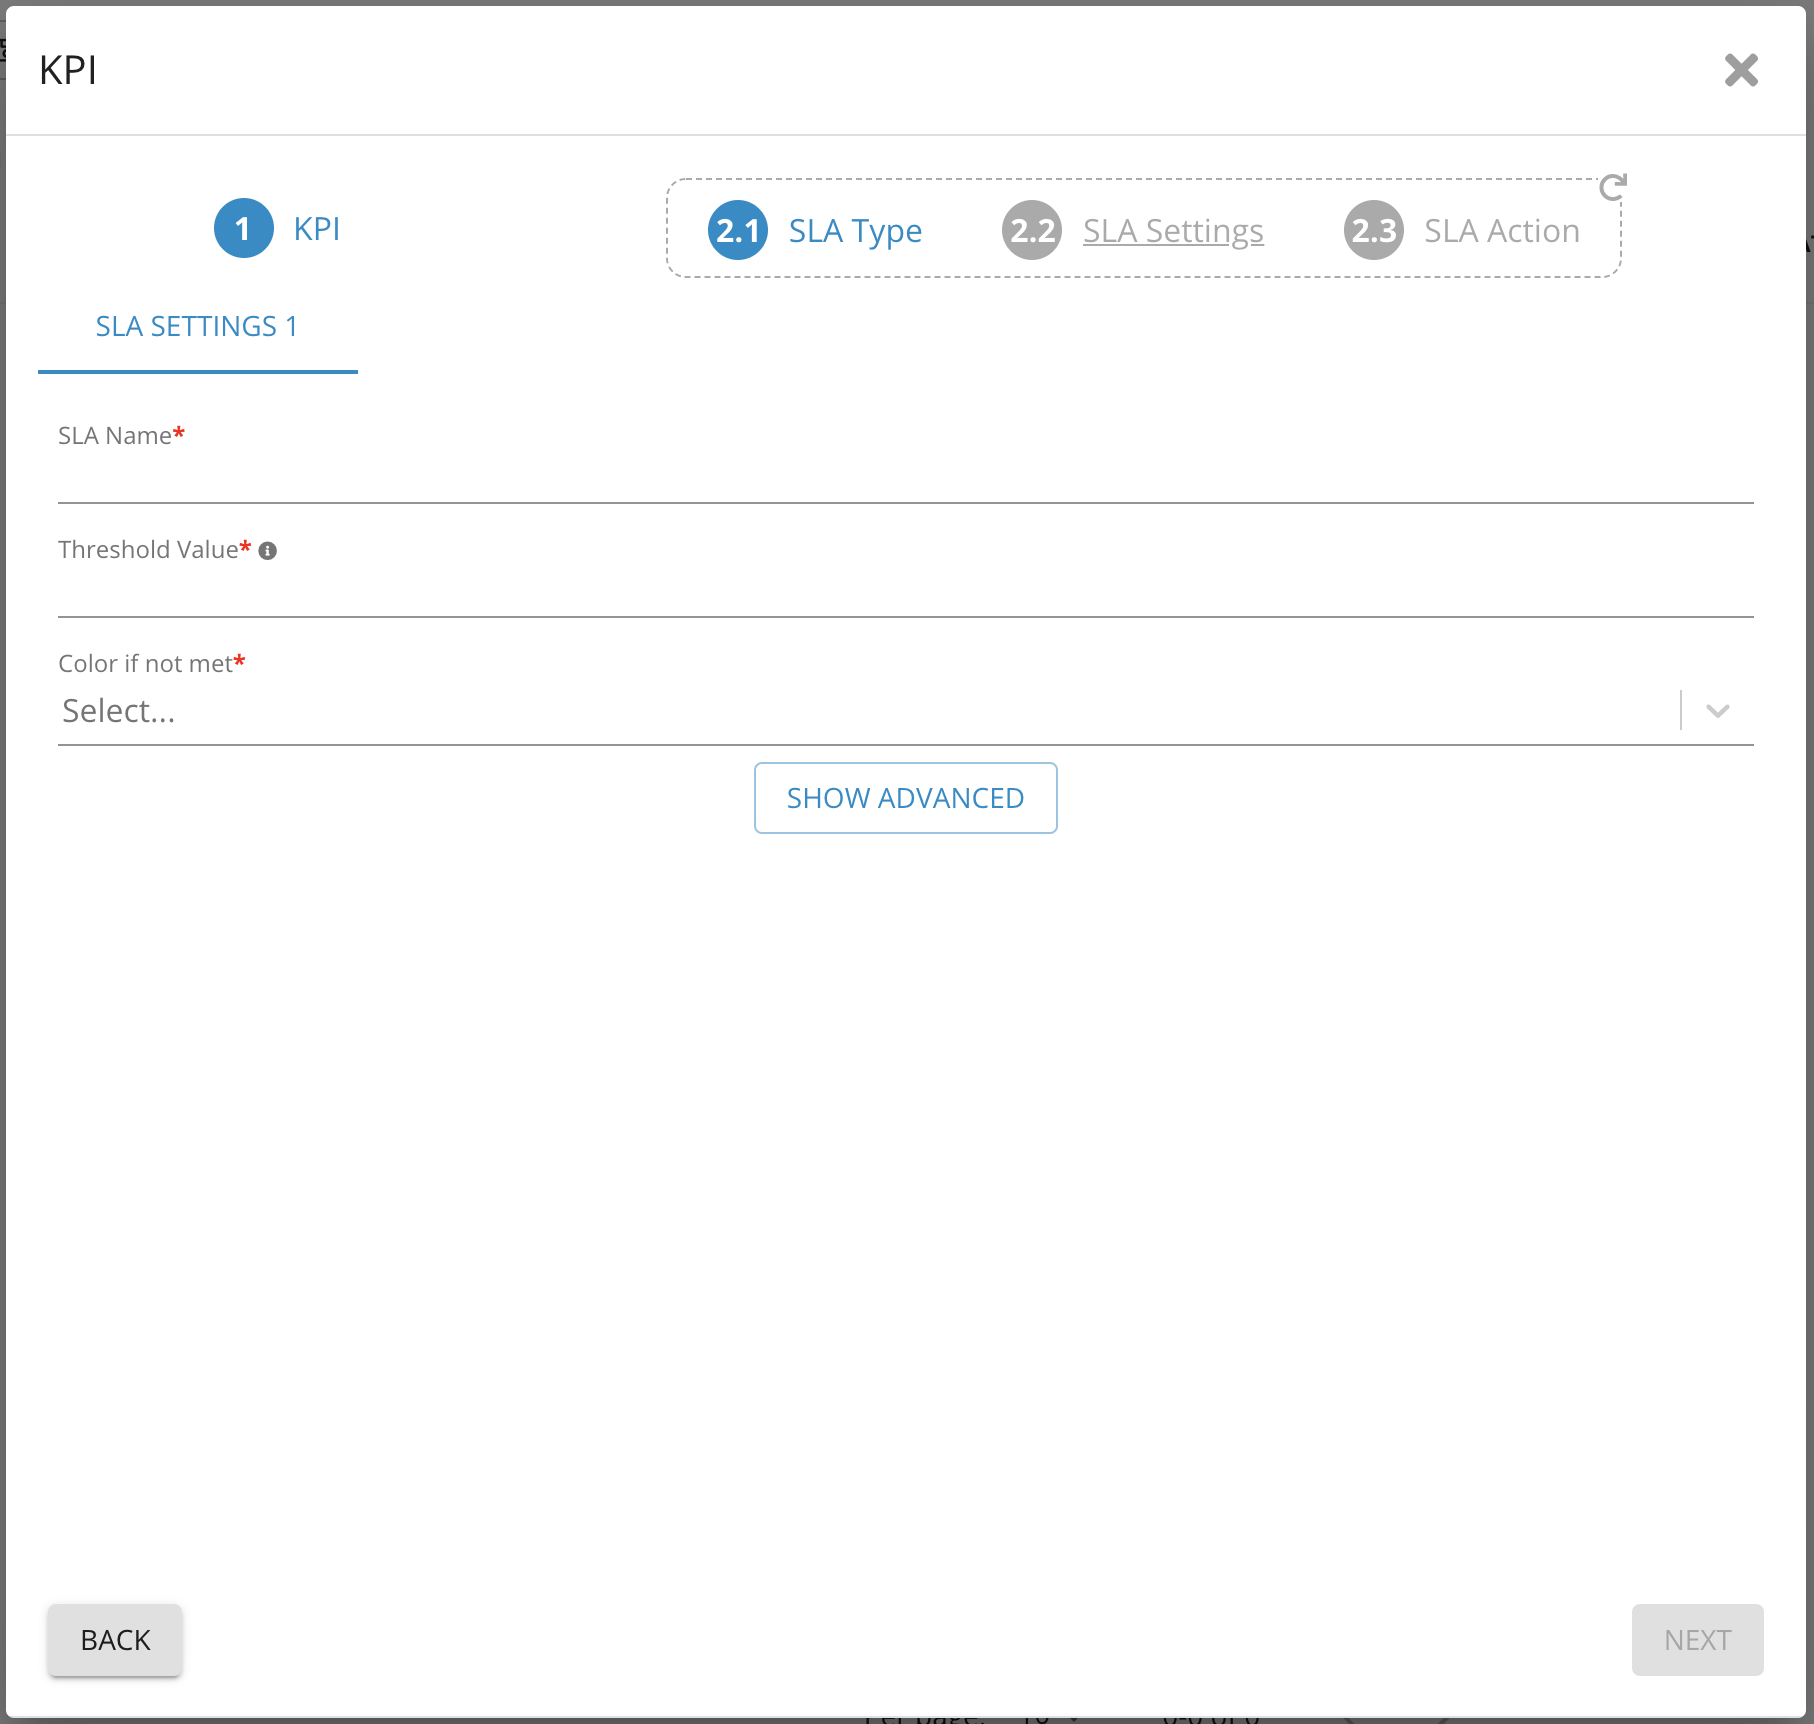
8. Provide Name for SLA
9. Provide threshold value in seconds
10. Choose color (i.e. Red, Orange)
11. Click Next
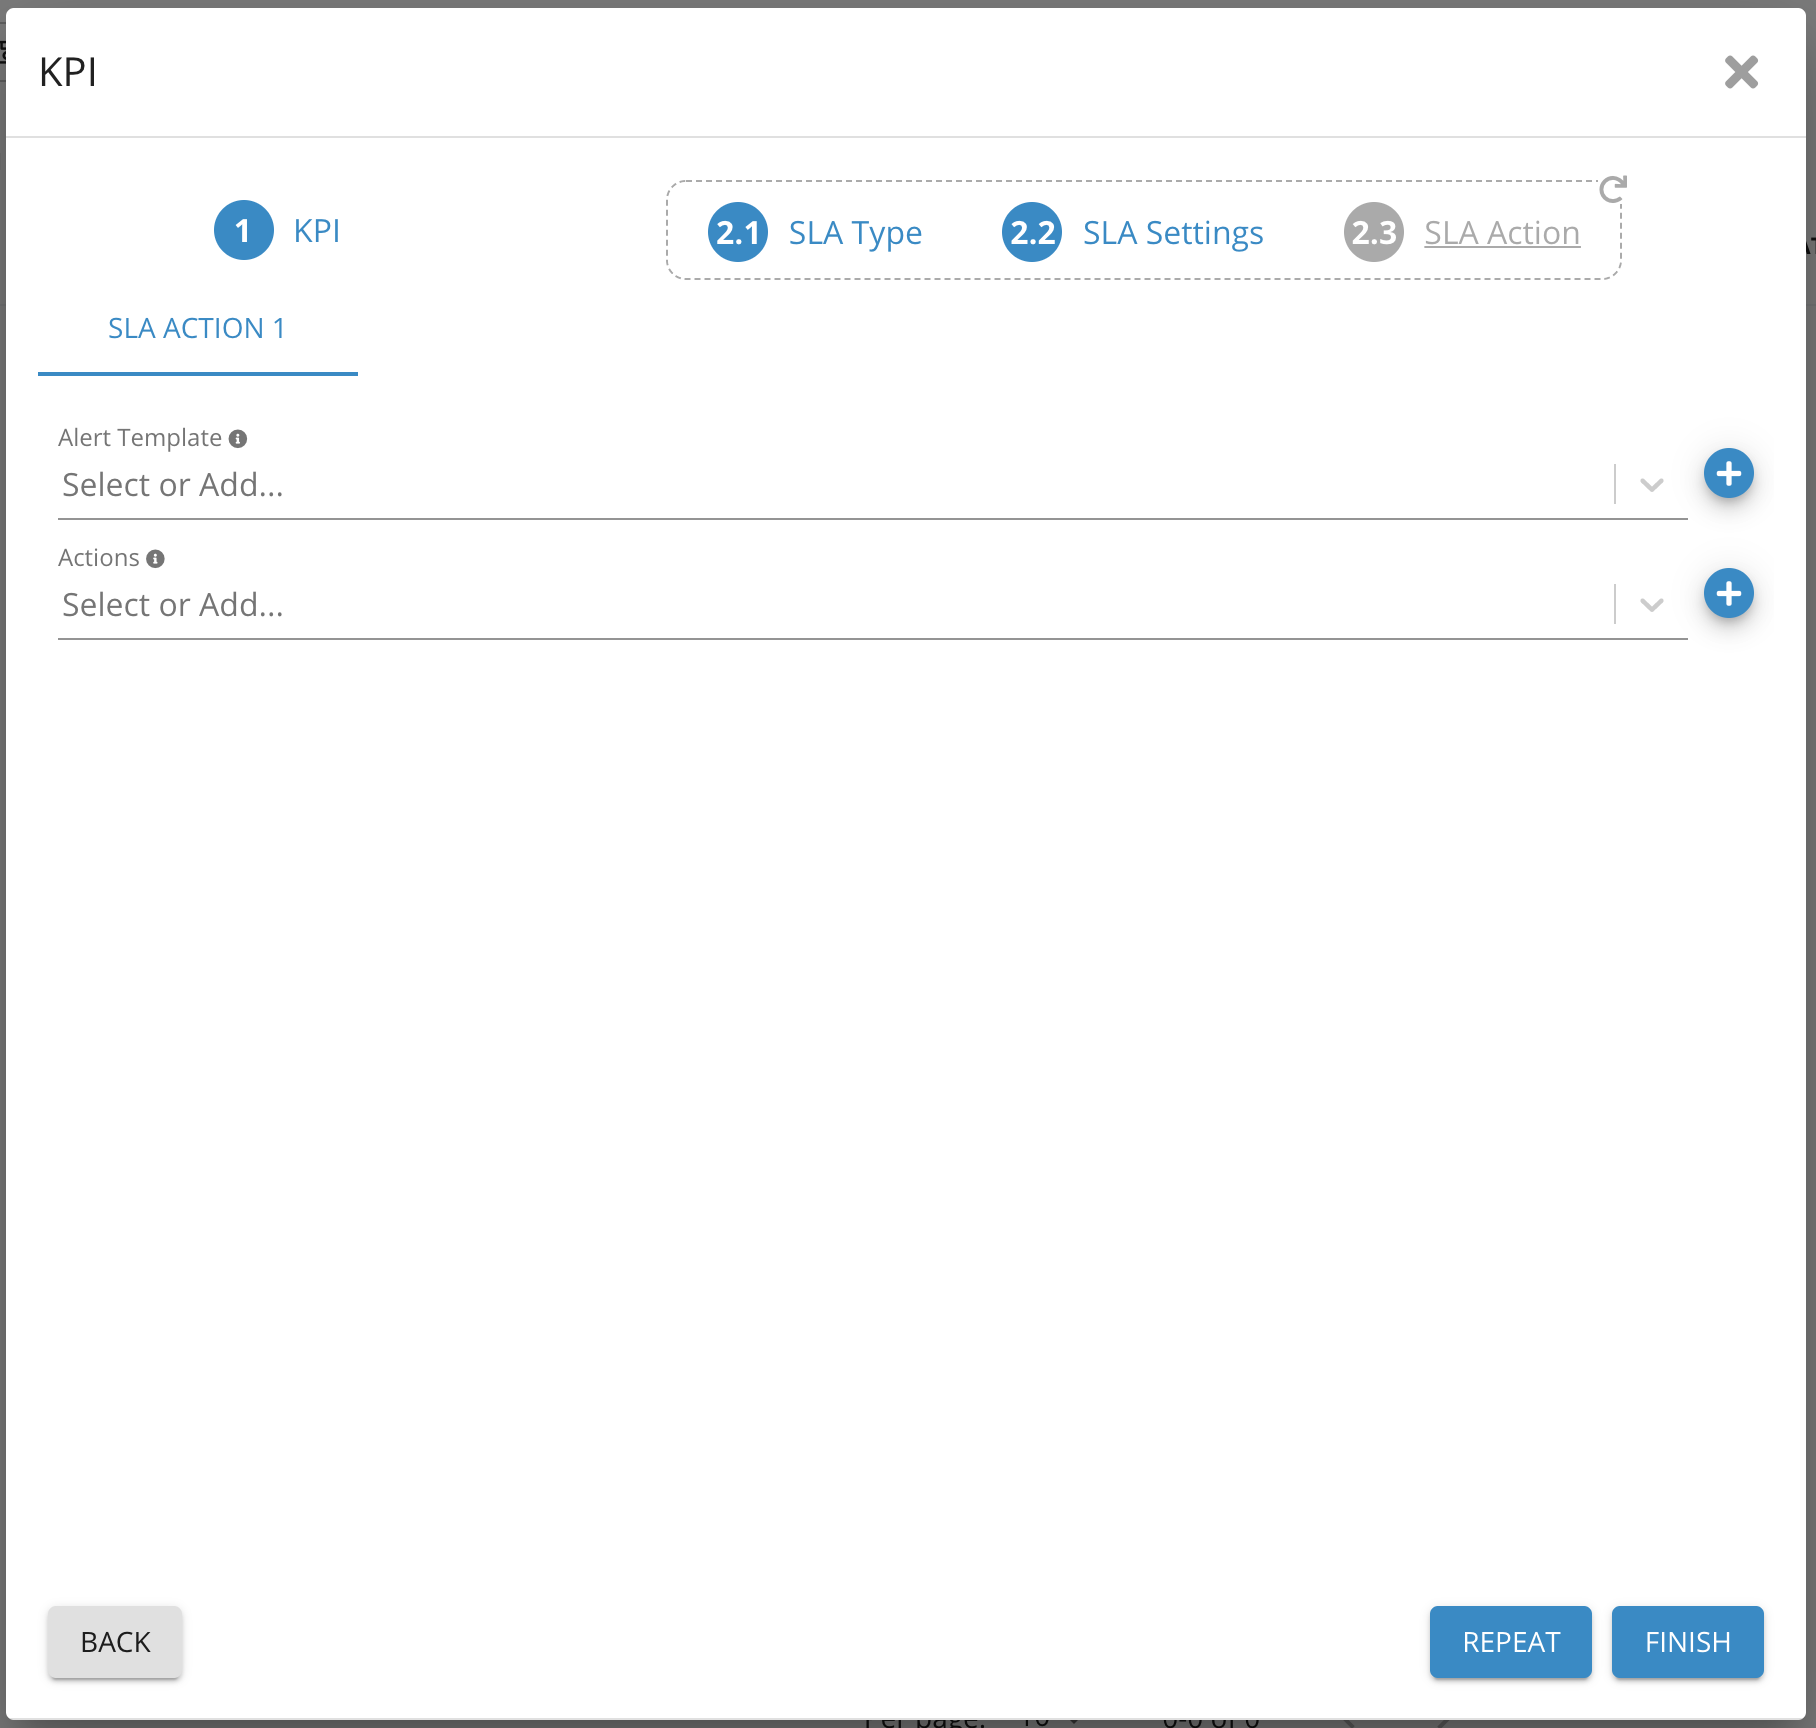
12. Optional Step. You may choose to add an alert. You can select them from the drop-down list
13. Click Finish
Create your Dashboards
Create your Rules
Component: Engine
Feature Availability: 8.6.0 or later