Feature
What is a Profile?
A profile is a set of automation components for a single application. Typically, these components share the same configuration settings. For example, two components may both require the hostname and port that an application instance runs on in order to monitor its availability as well as execute synthetic requests against it.
Additionally, there are often dependencies between components for a specific application. For example, a component that monitors a log directory may be dependent on a parser component to process the log files. The profile is aware of these dependencies and will guarantee that components are only deployed if all dependencies are also available.
While you can deploy each component individually to a Germain UX engine, deploying them via a profile greatly reduces the need to understand the interdependencies between components and speeds up the deployment of monitoring at scale.
Examples
Germain UX is preconfigured with profiles for a variety of applications. Here is a subset of the most frequently used profiles:
|
Apache HTTP |
Apache Kafka |
Apache Tomcat |
Apache ZooKeeper |
|
IBM DB2 |
Docker |
Elasticsearch |
GoLang |
|
Kubernetes |
Microsoft IIS |
MySQL Database |
Nginx |
|
OBIEE |
Oracle Database |
PHP |
PostgreSQL Database |
|
SQL Server Database |
Salesforce |
Siebel CRM |
|
Applying a Profile
In order to be able to apply a profile to a server, you first need to designate a Germain UX engine to be responsible for monitoring that server.
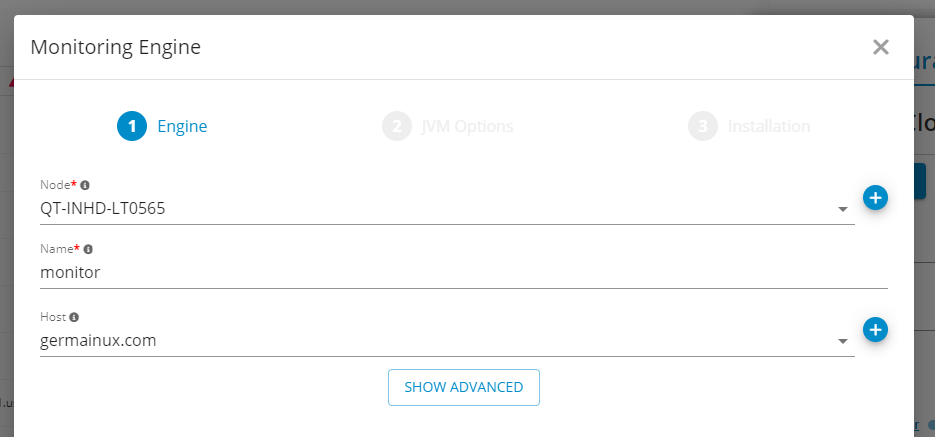
You can specify the host that an engine is going to monitor during engine creation:
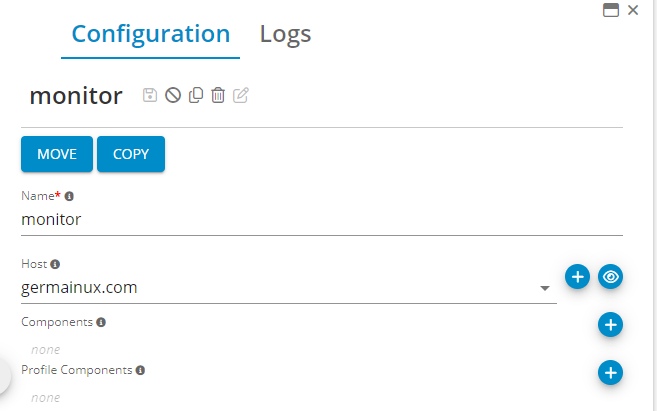
For existing engines, you can change this association from the Germain UX state screen:
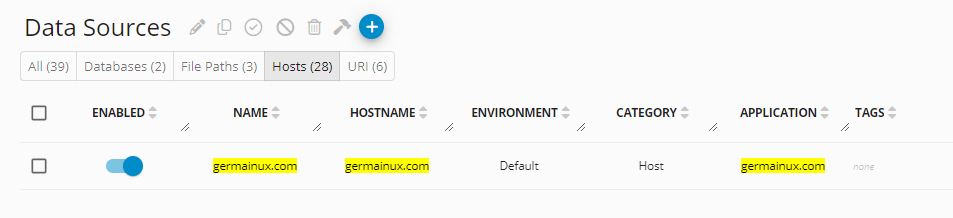
Once you have assigned an engine, you can now apply the profile to your server. To do so, navigate to the “Data Sources” screen and find your server under the “Hosts” tab:
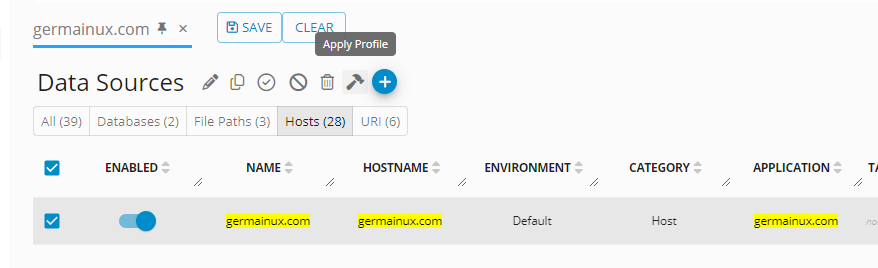
Select your server, and click the “Apply Profile” icon to initiate the profile dialog. It is possible to apply a profile to multiple servers at once this way.
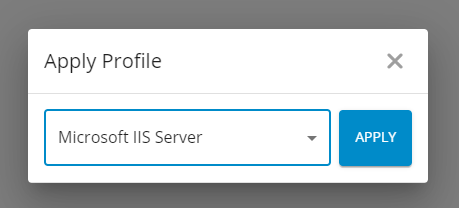
Next, select the profile that matches the application you want to monitor:
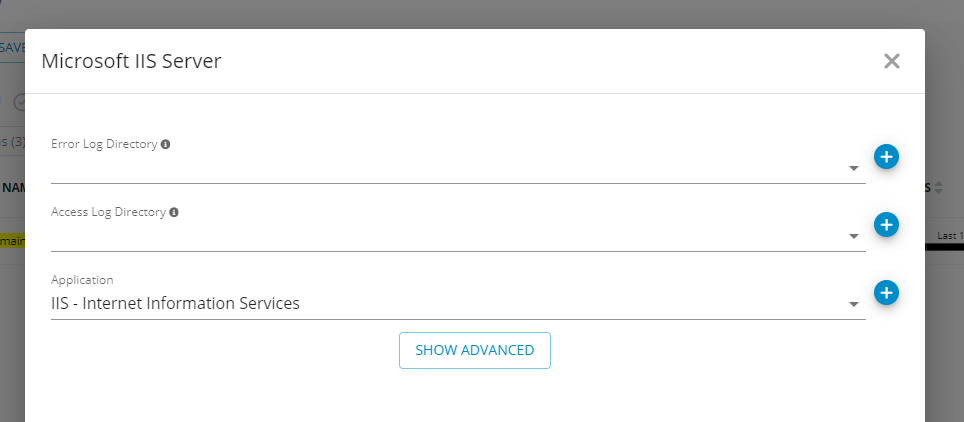
Depending on the profile selected, the next dialog will ask you to provide one or more inputs. Typical values that you will see here are log paths, ports, and credentials needed to monitor the target application:
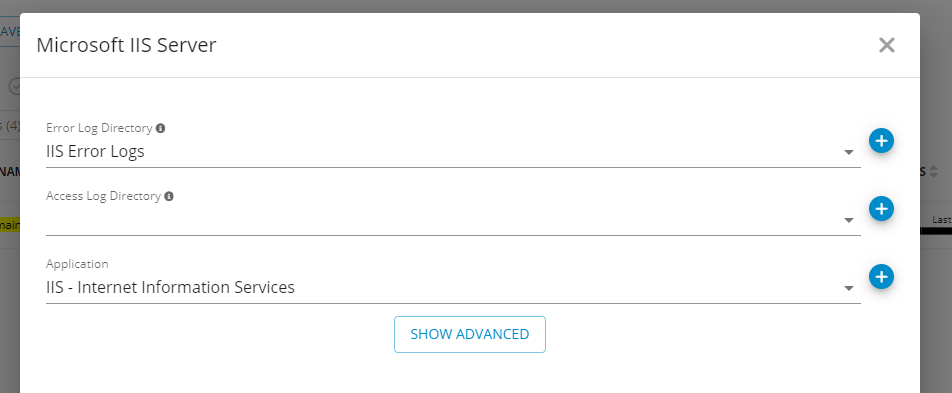
You may not be able to provide values for all requested inputs. For example, while configuring monitoring for a new server you may not yet have the final credentials that are going to be used once the system is running. In this case, Germain UX will attempt to deploy as many monitoring components as possible with the information given. Any components that are lacking required information will be disabled and can be activated at a later point.
For example, let’s fill in the error log directory for the Microsoft IIS Server profile but omit the access log directory:
Next, apply the profile. You will see that most of the profile components were deployed. However, the component responsible for monitoring the access log was skipped:
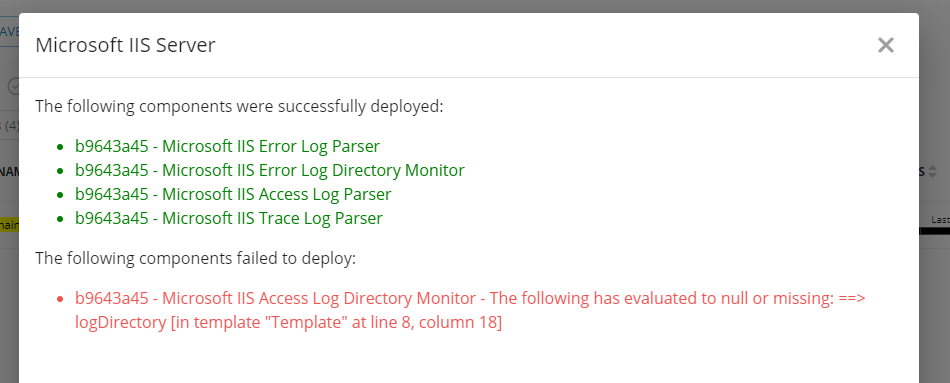
At this point, the monitoring components are ready and will start collecting data from your application.
Reapplying a Profile
In case you need to change any of the settings provided during the initial application of a profile, you can reapply it at any point. To do so, navigate to the “Data Sources” page and find your server under the “Hosts” tab. Click on it to open the details panel:
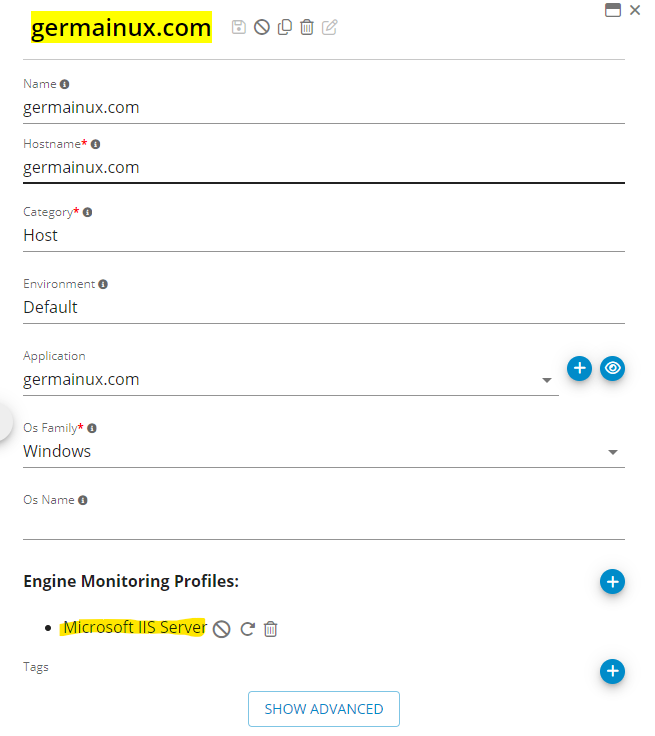
Under the “Engine Monitoring Profiles” section, you will see any profile previously applied to this server. Let’s reconfigure the profile for “Microsoft IIS Server” by providing the access log directory that we had skipped during the initial deployment.
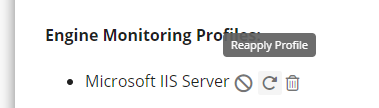
Click on the “Reapply Profile” button to bring up the settings dialog:
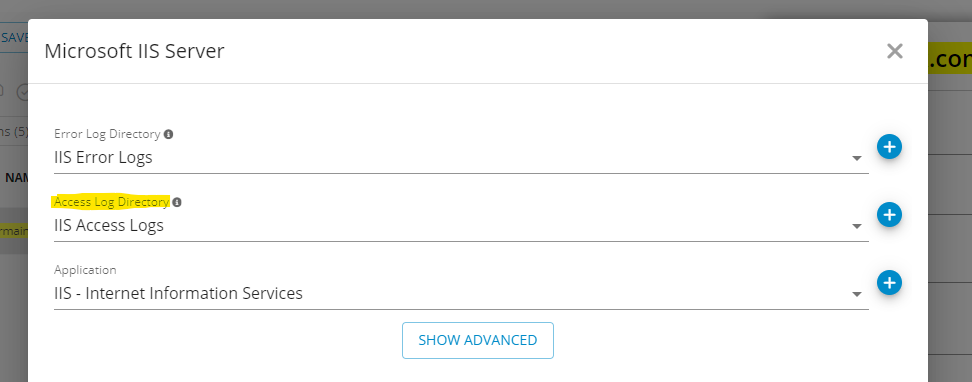
You will notice that the original settings (Error directory and Application name) are stored as part of the profile. Now, let’s also provide a value for the “Access Log Directory”:
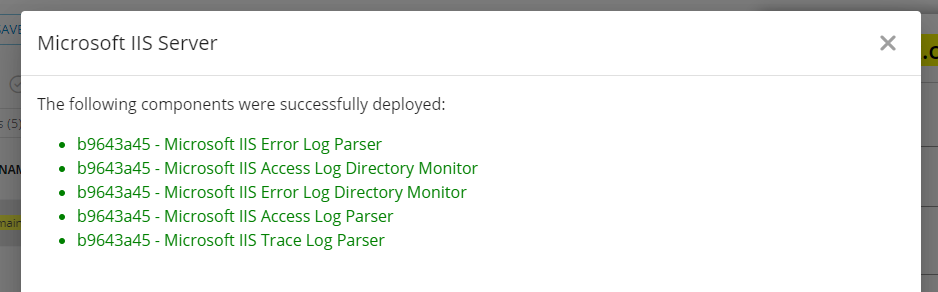
Finally, click apply to reapply the profile. This time around, you will notice that all components were successfully deployed:
Disabling a Profile
Sometimes you may need to disable all monitoring associated with a given profile, for example if you temporarily taking a server offline. To do so, you can disable monitoring profiles from the details panel:
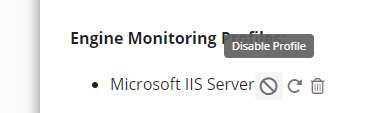
After disabling a profile, any components associated with it will be removed from the engine responsible for the selected server. However, any configuration settings are stored to make it easy to redeploy the profile in the future.
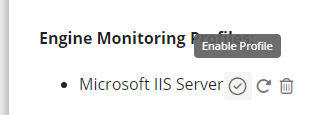
To redeploy the profile, just click on the “Enable Profile” icon:
Automatic Profile Configuration
So far we have manually deployed profiles to engines. This is sufficient for small environment that change infrequently. However, if you are finding yourself adding and removing system frequently, or if you are using virtualization and containers, you will want to set up rules to automatically apply profiles as Germain UX engines come online.
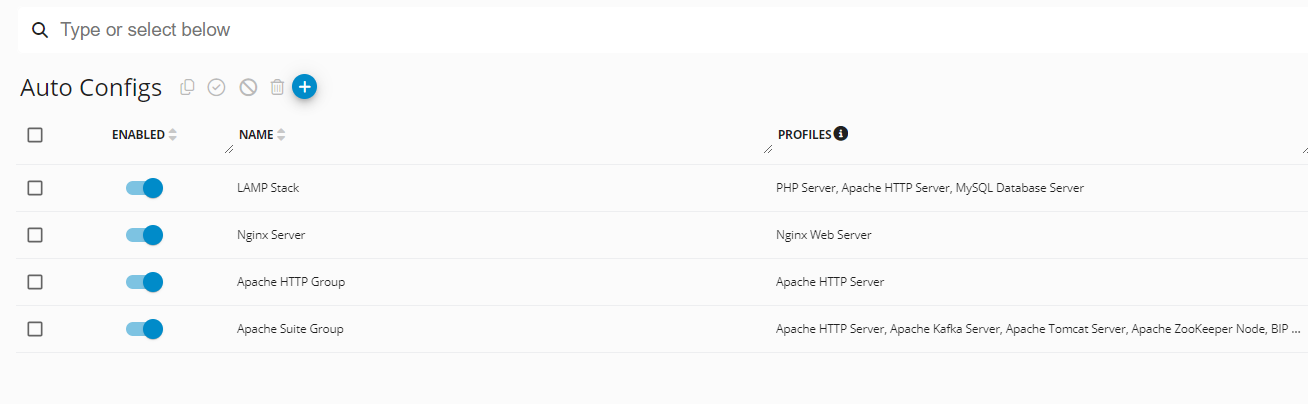
To create a new auto-config rule, navigate to “Auto Configs” screen on the Germain UX workspace:
Each auto-config rule first declares which servers it is applicable to. For example, the following profile would apply to each server that is configured as part of the “Stage” environment for which a monitoring engine is deployed:
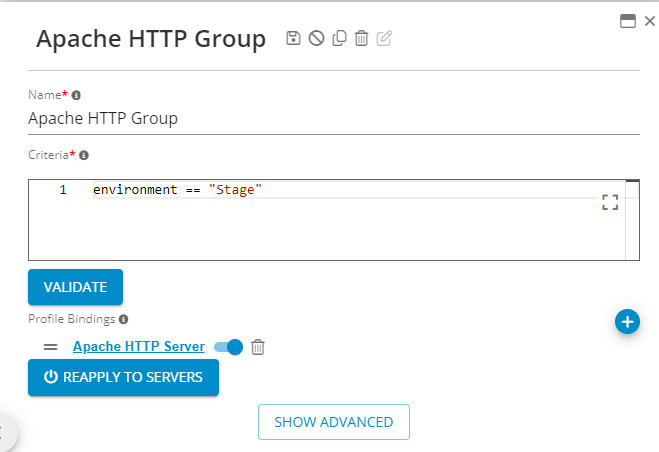
In this example, the Apache HTTP Server profile would be applied automatically when a new engine connects to the Germain UX system for the first time for any server in the stage environment.
Creating Custom Profiles
While Germain UX is preconfigured for a wide variety of common applications, there are cases when you may want to create your own profiles, either to customize existing monitoring or to put together component bundles from scratch for custom applications.
Our support team is available to help you build new profile. Please contact us to schedule a training session.