Features
Germain UX offers six powerful heatmaps that provide deep insights into user interactions with your web pages. These heatmaps highlight the areas of a page that attract the most activity, helping you identify frictions or drop-offs—whether for individual users or your entire user community.
Here’s what each heatmap reveals:
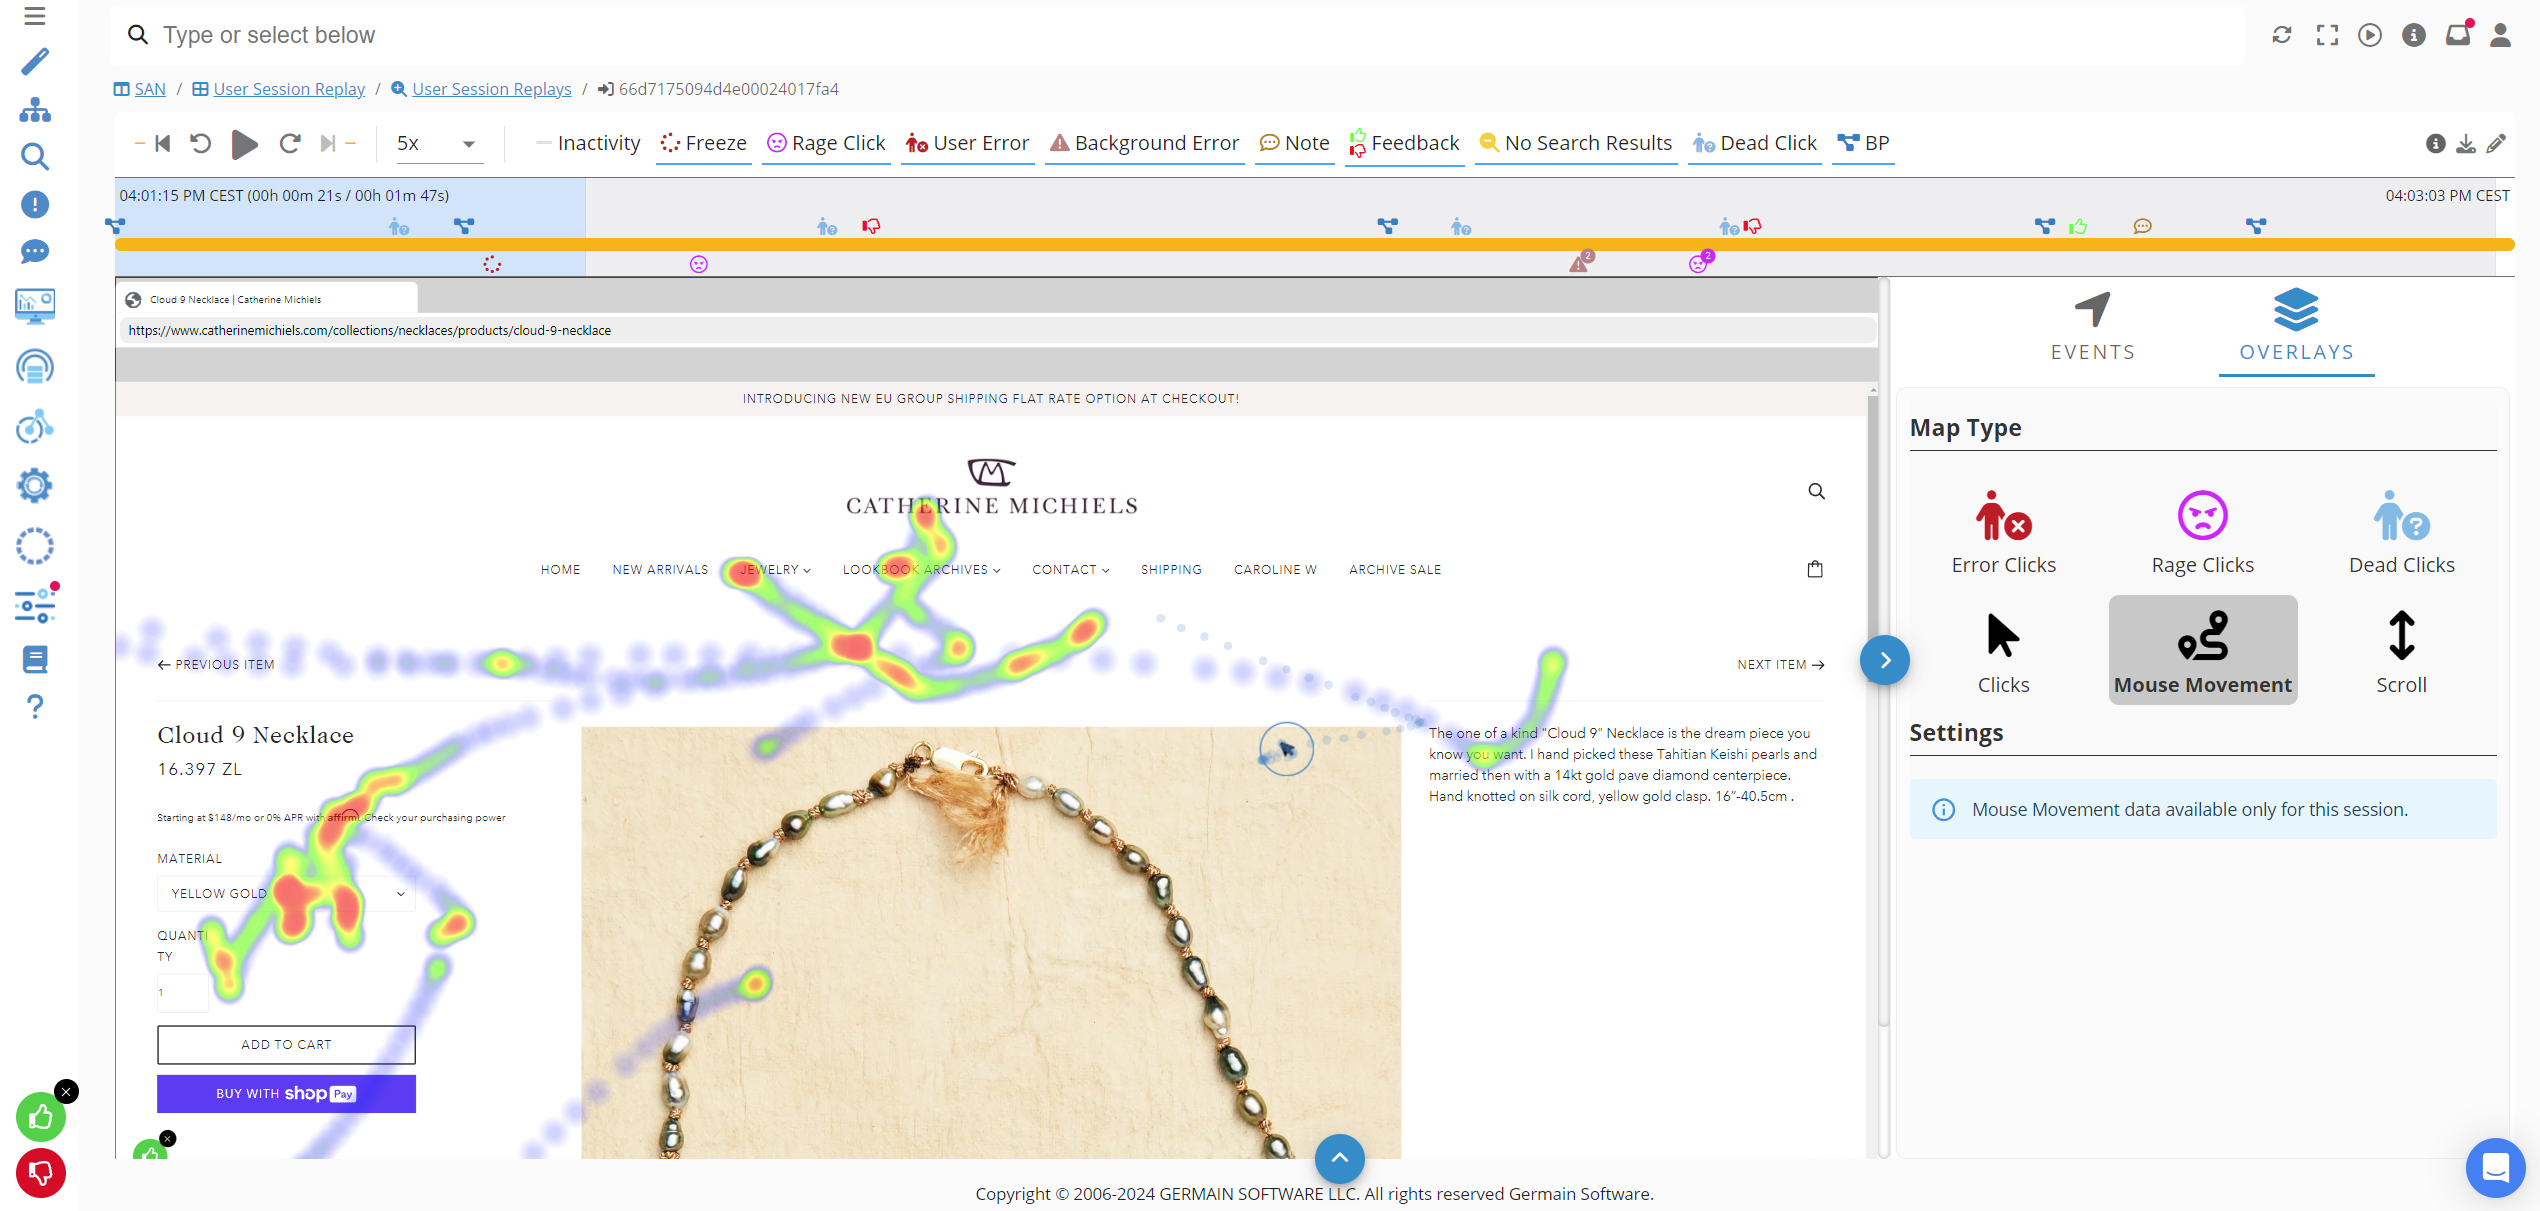
Mouse Movement Heatmap
Tracks mouse movements across a page, offering insights into areas of interest or hesitation that may indicate confusion or curiosity.
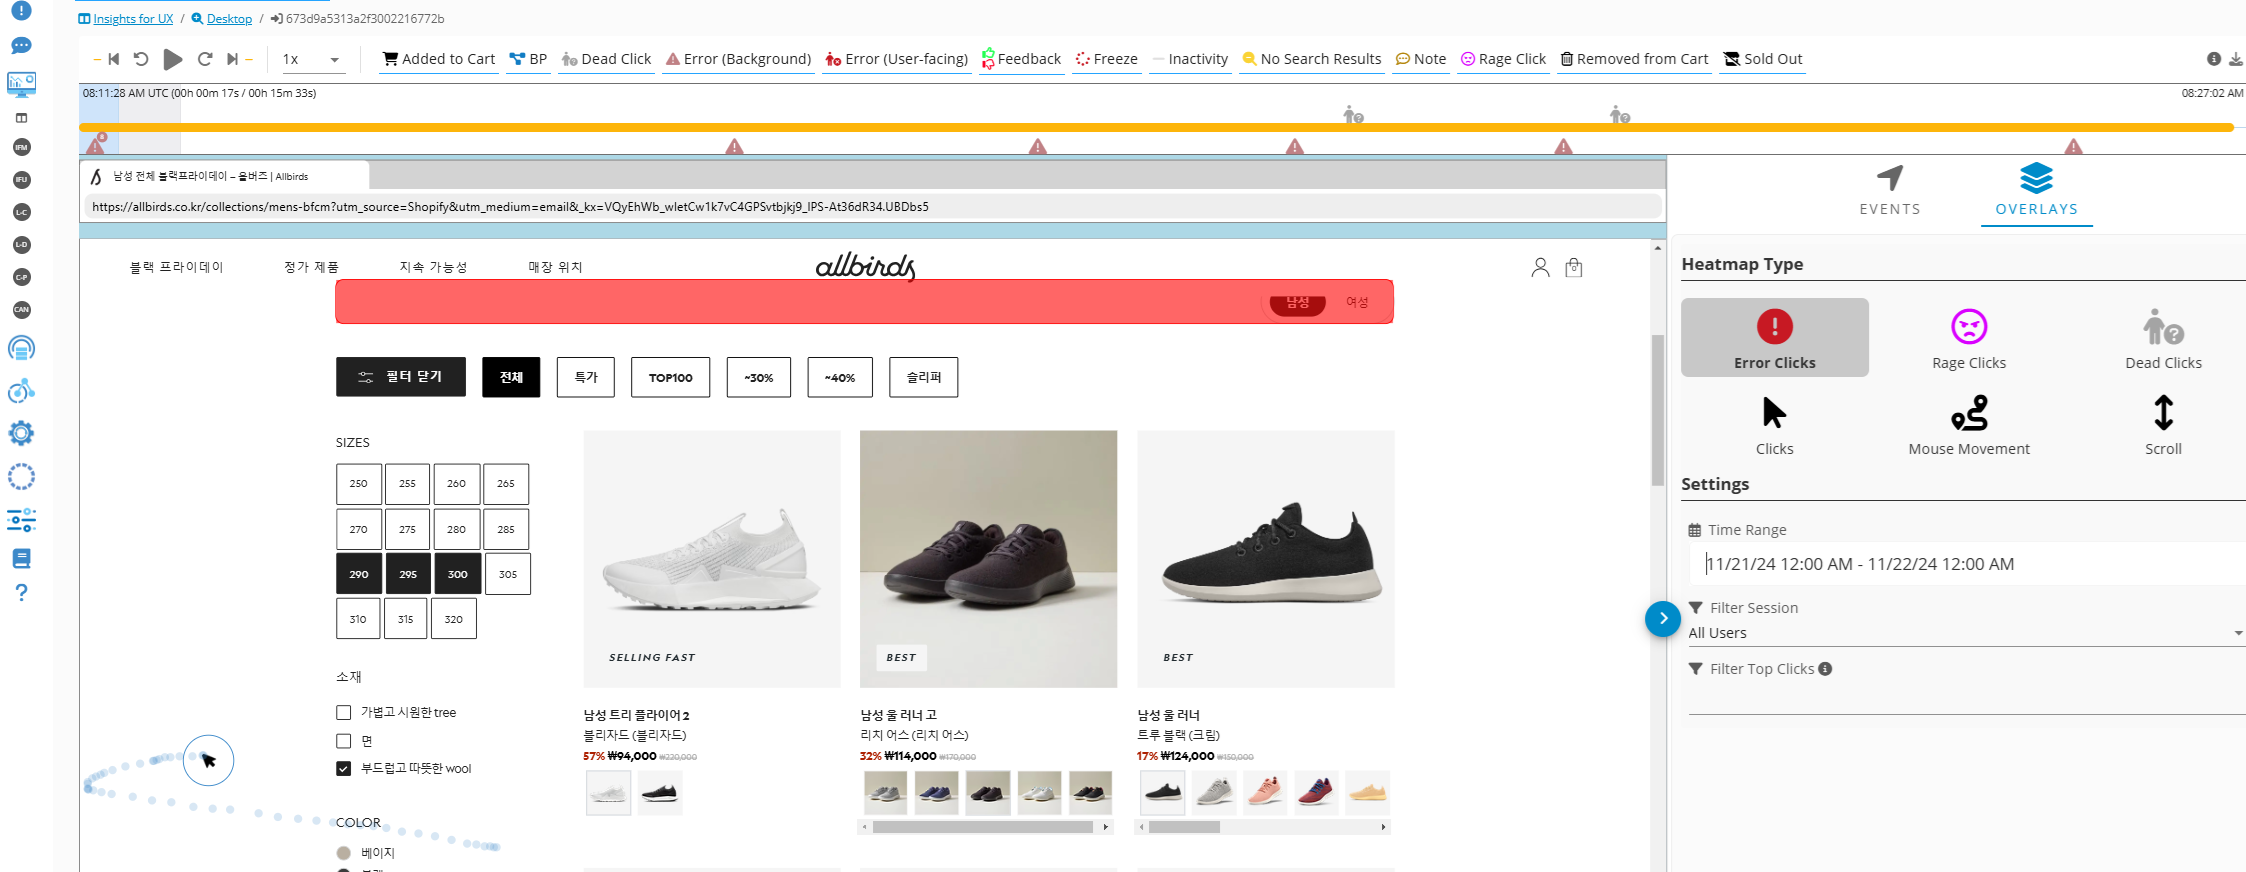
Error Clicks Heatmap
Highlights clicks that result in errors, such as broken links, unresponsive elements, or other issues, enabling you to quickly resolve pain points.
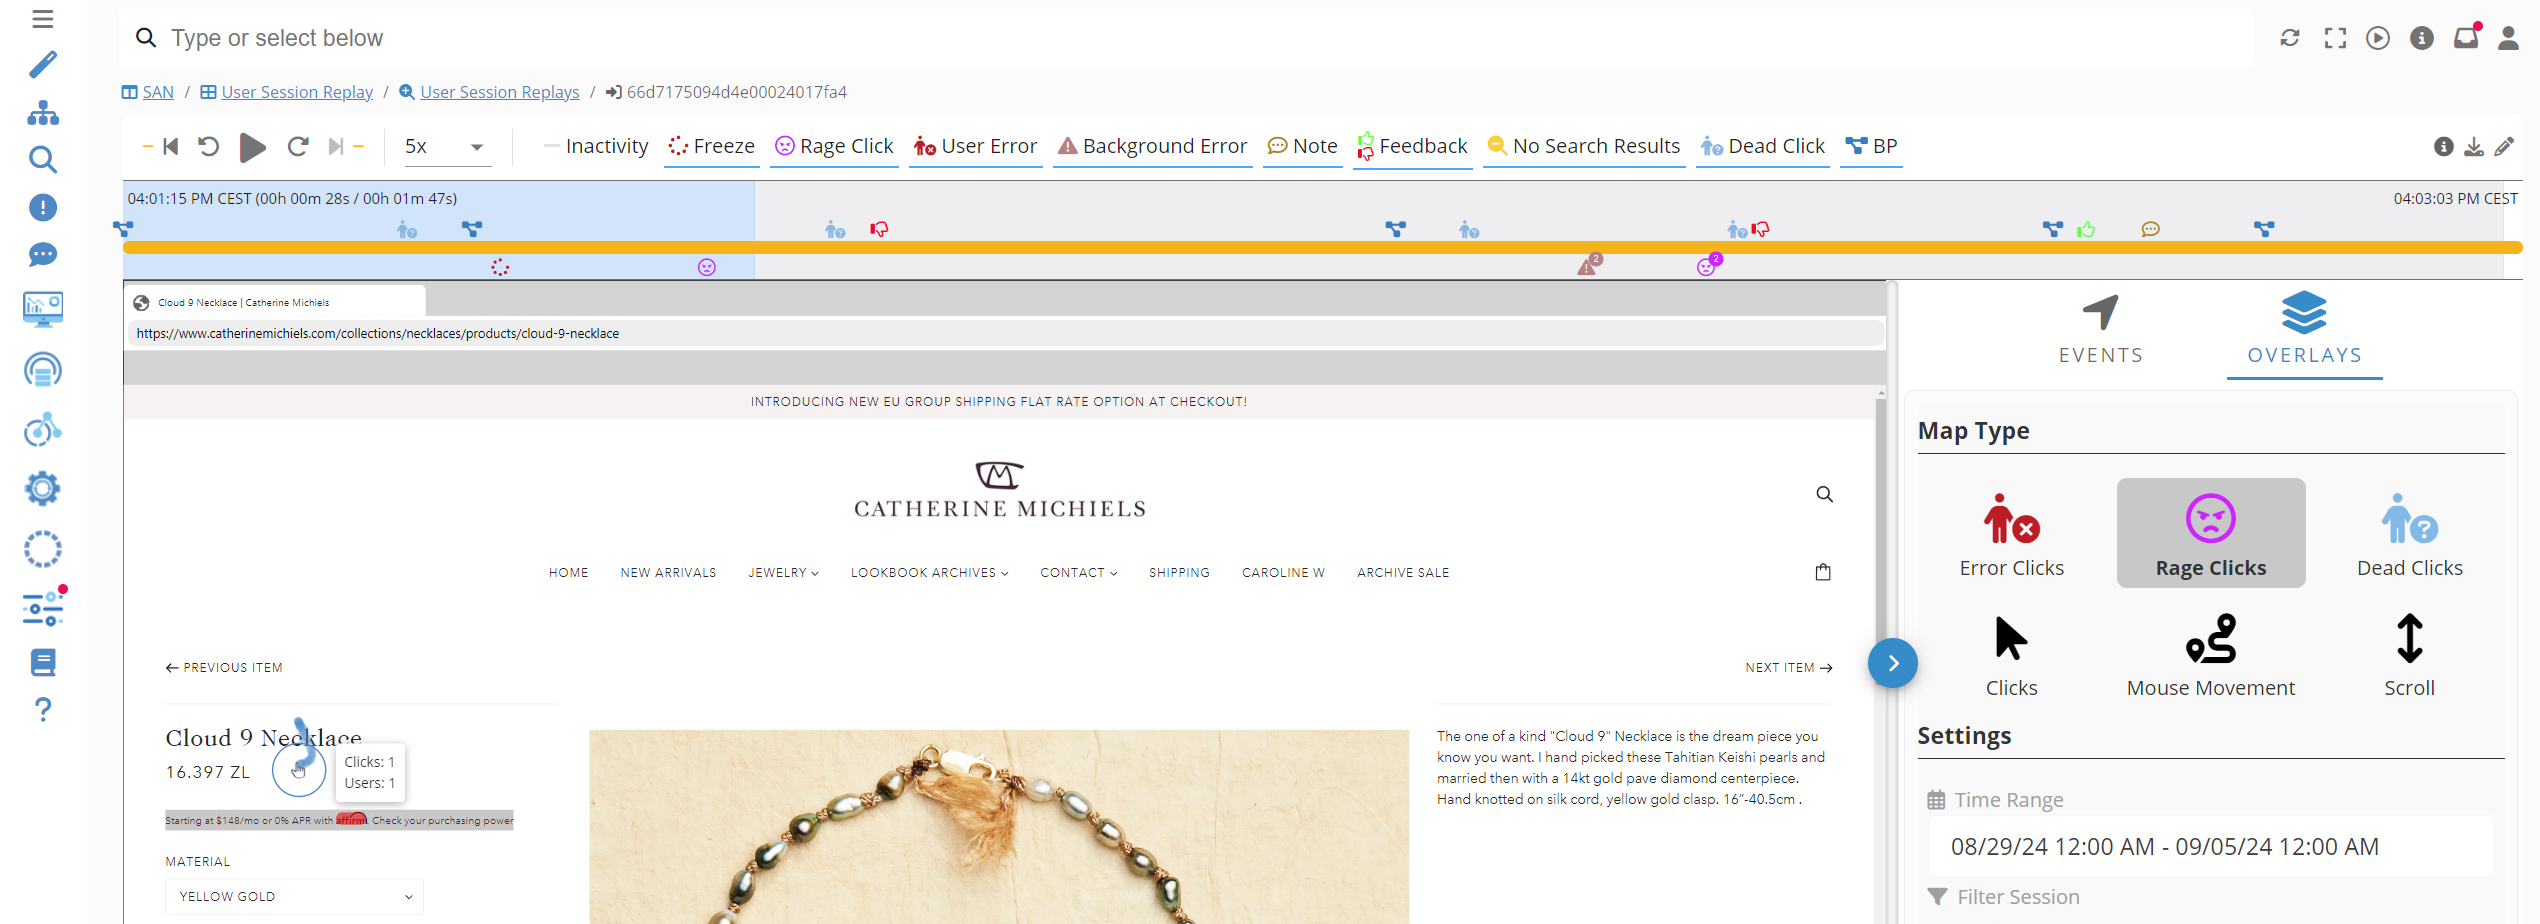
Rage Clicks Heatmap
Tracks areas where users repeatedly click out of frustration, helping you identify confusing or malfunctioning elements that disrupt the user experience.
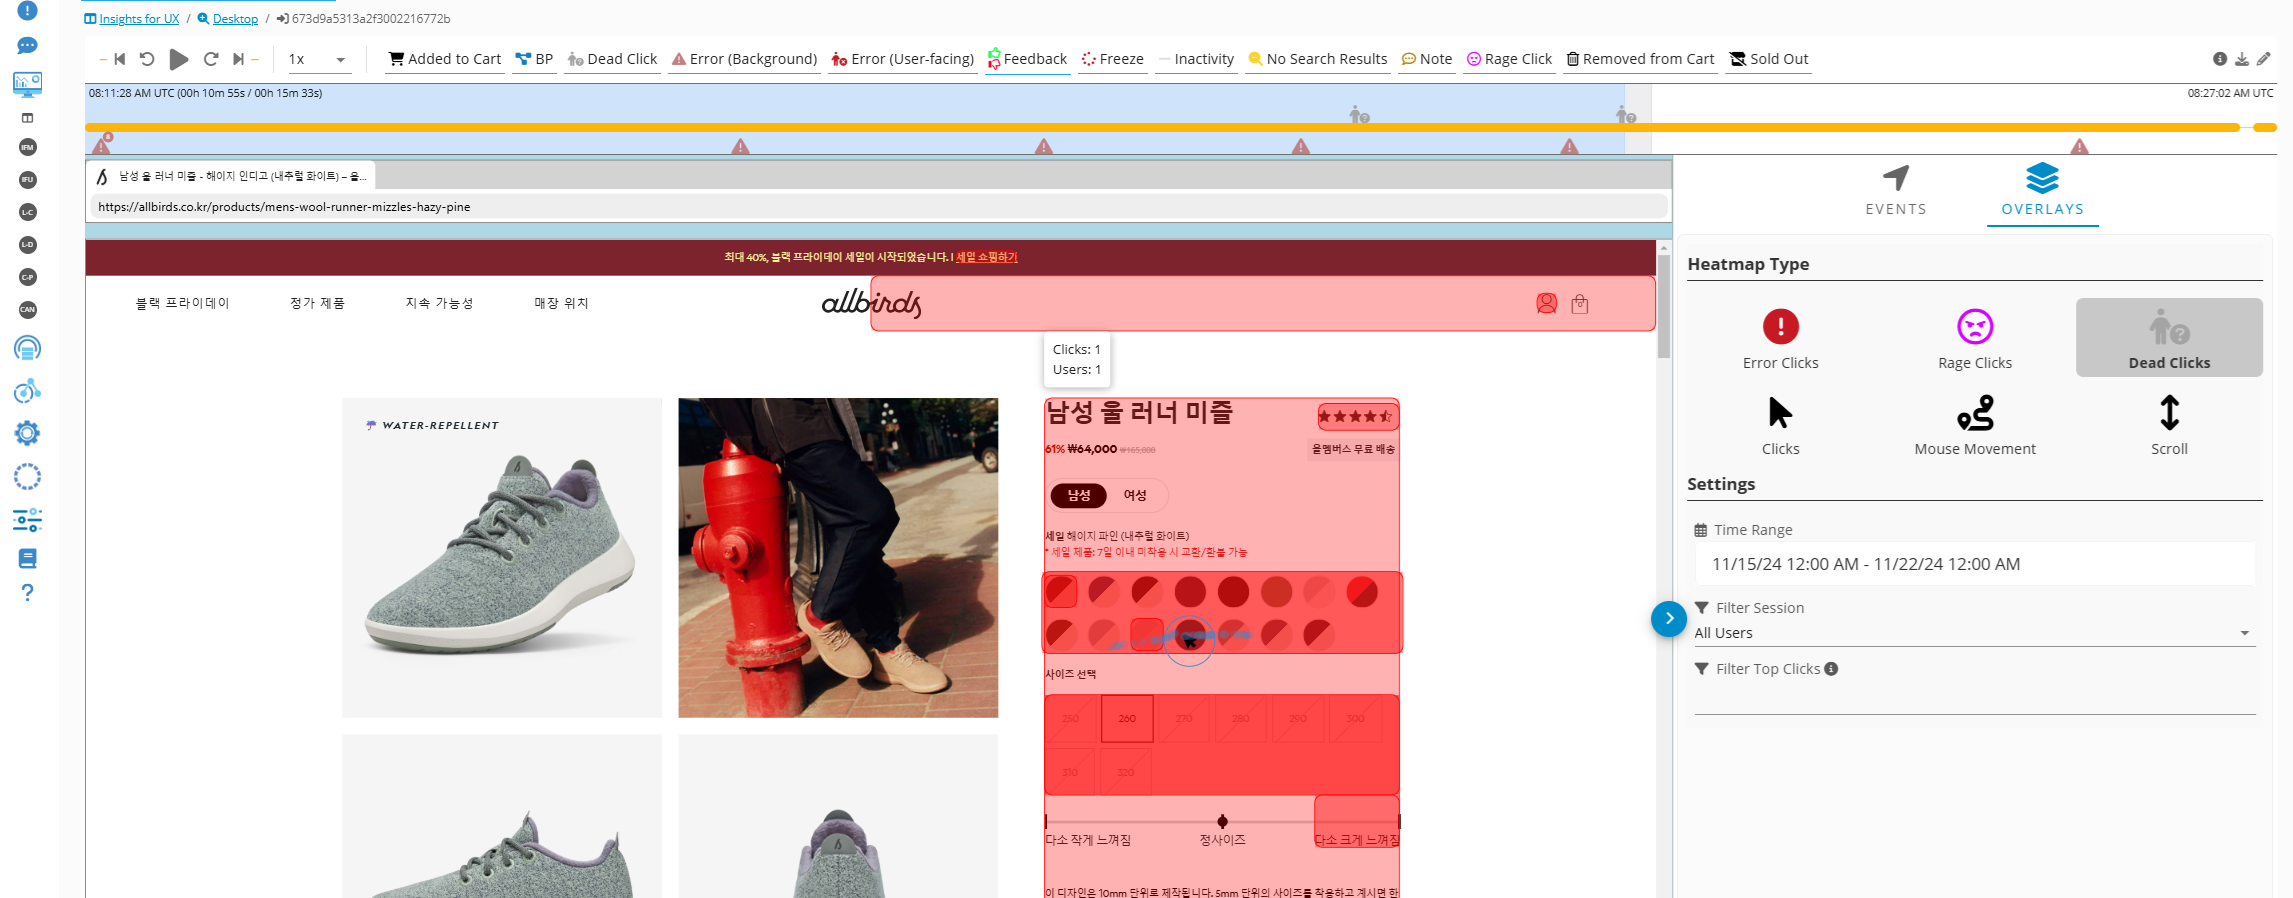
Dead Clicks Heatmap
Shows clicks on non-interactive or ineffective elements, giving you insight into wasted efforts and opportunities to optimize page functionality.
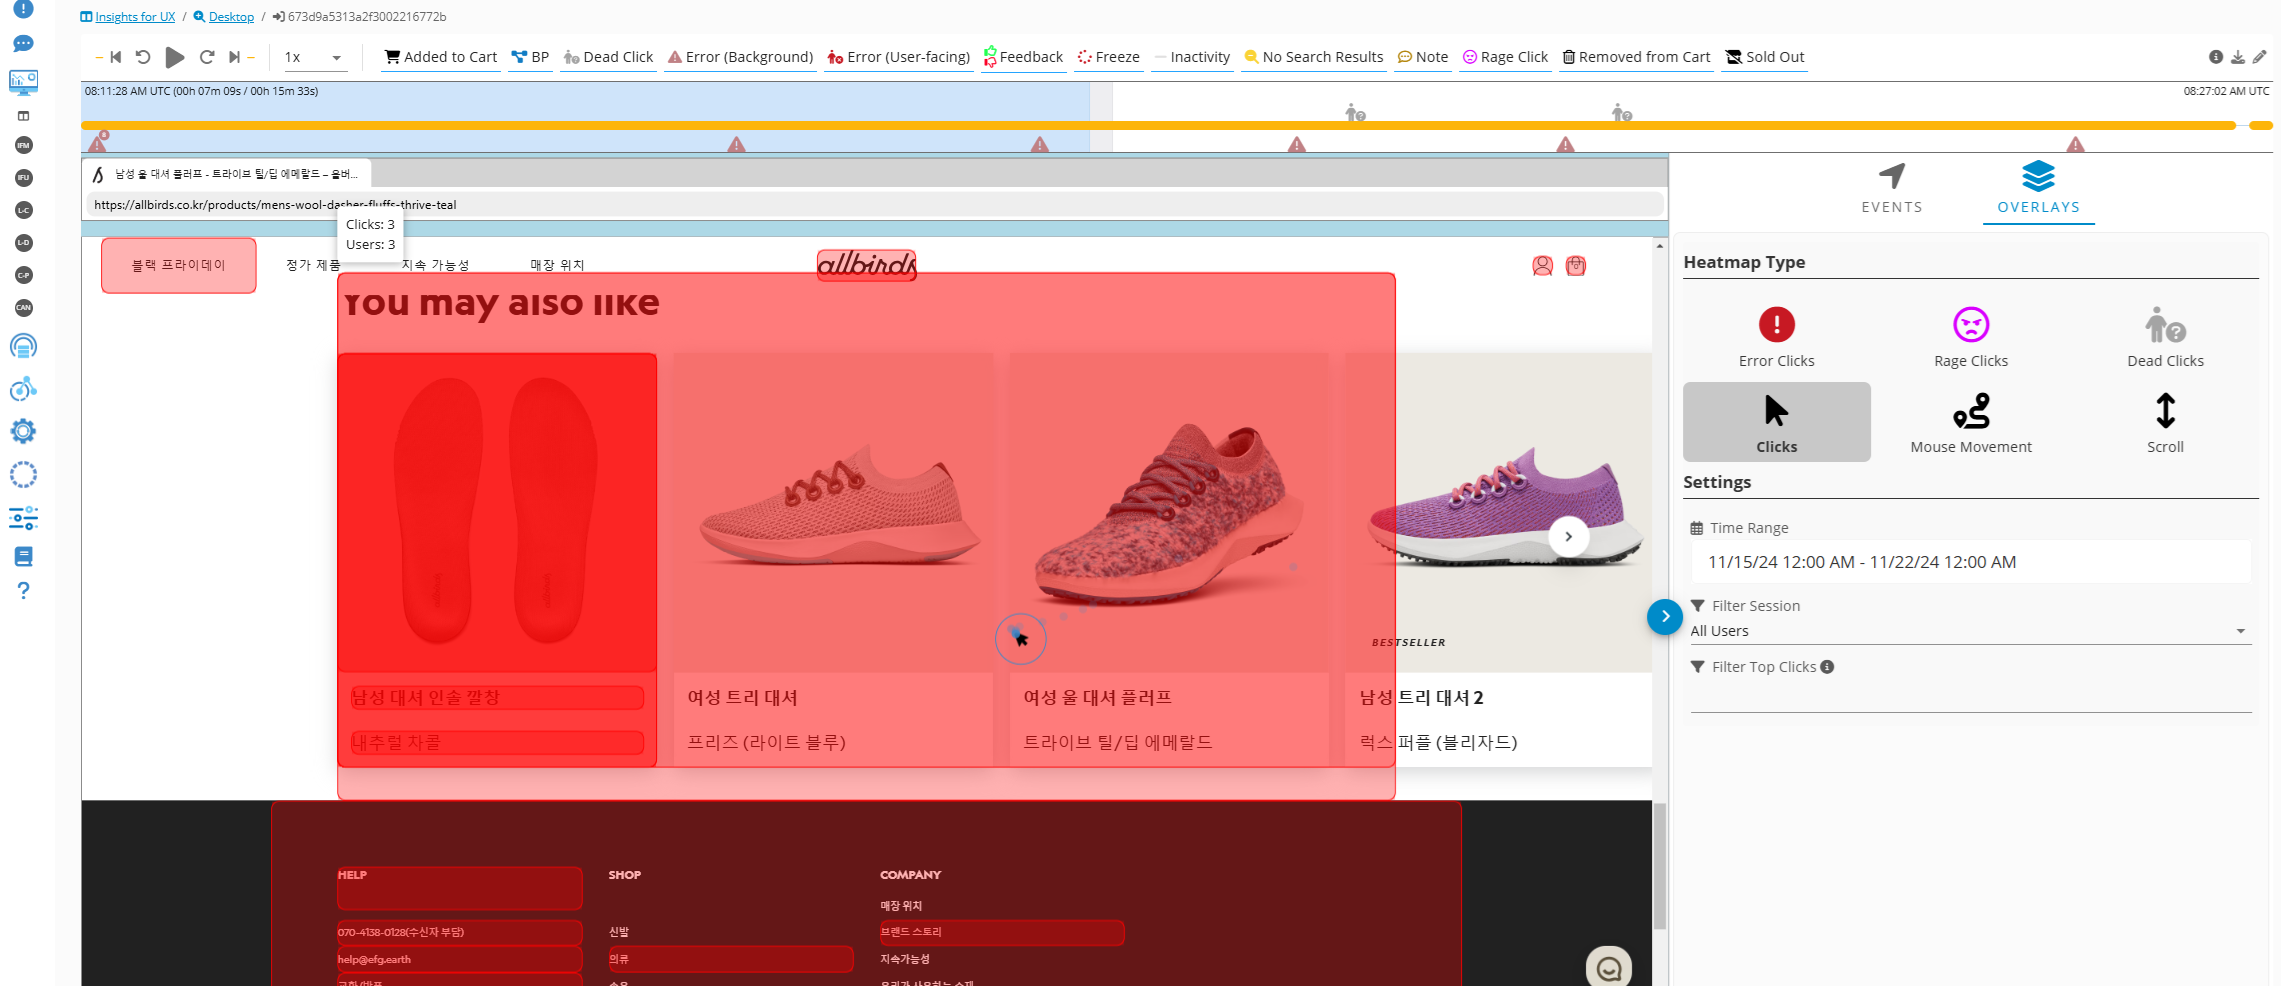
Clicks Heatmap
Displays all user clicks on a page, providing an overview of how users engage with your content and navigation.
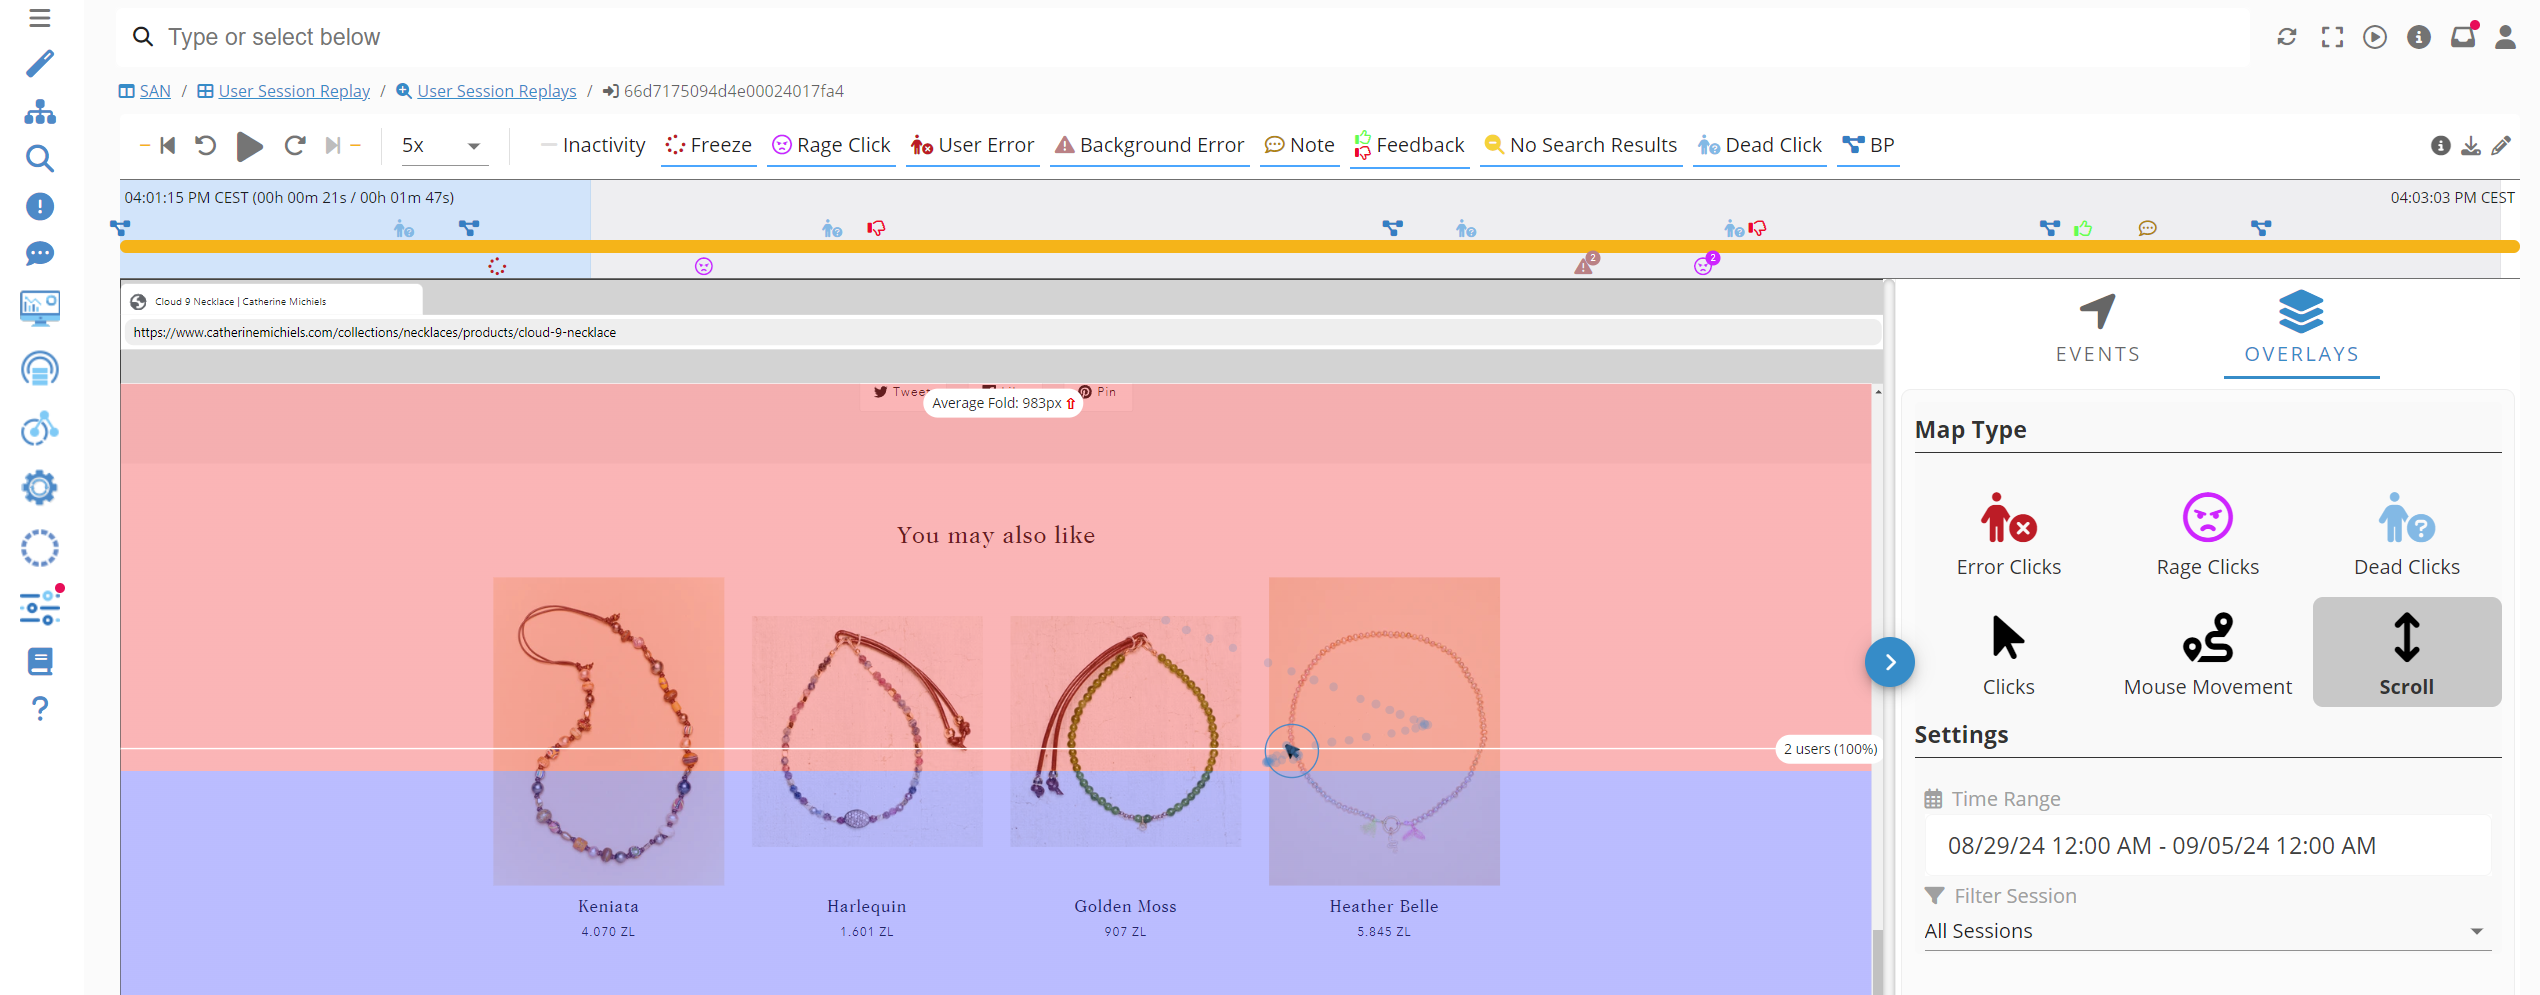
Scroll Heatmap
Visualizes how far users scroll down a page, showing you the content that captures attention versus what goes unnoticed.
Where to find Heatmaps
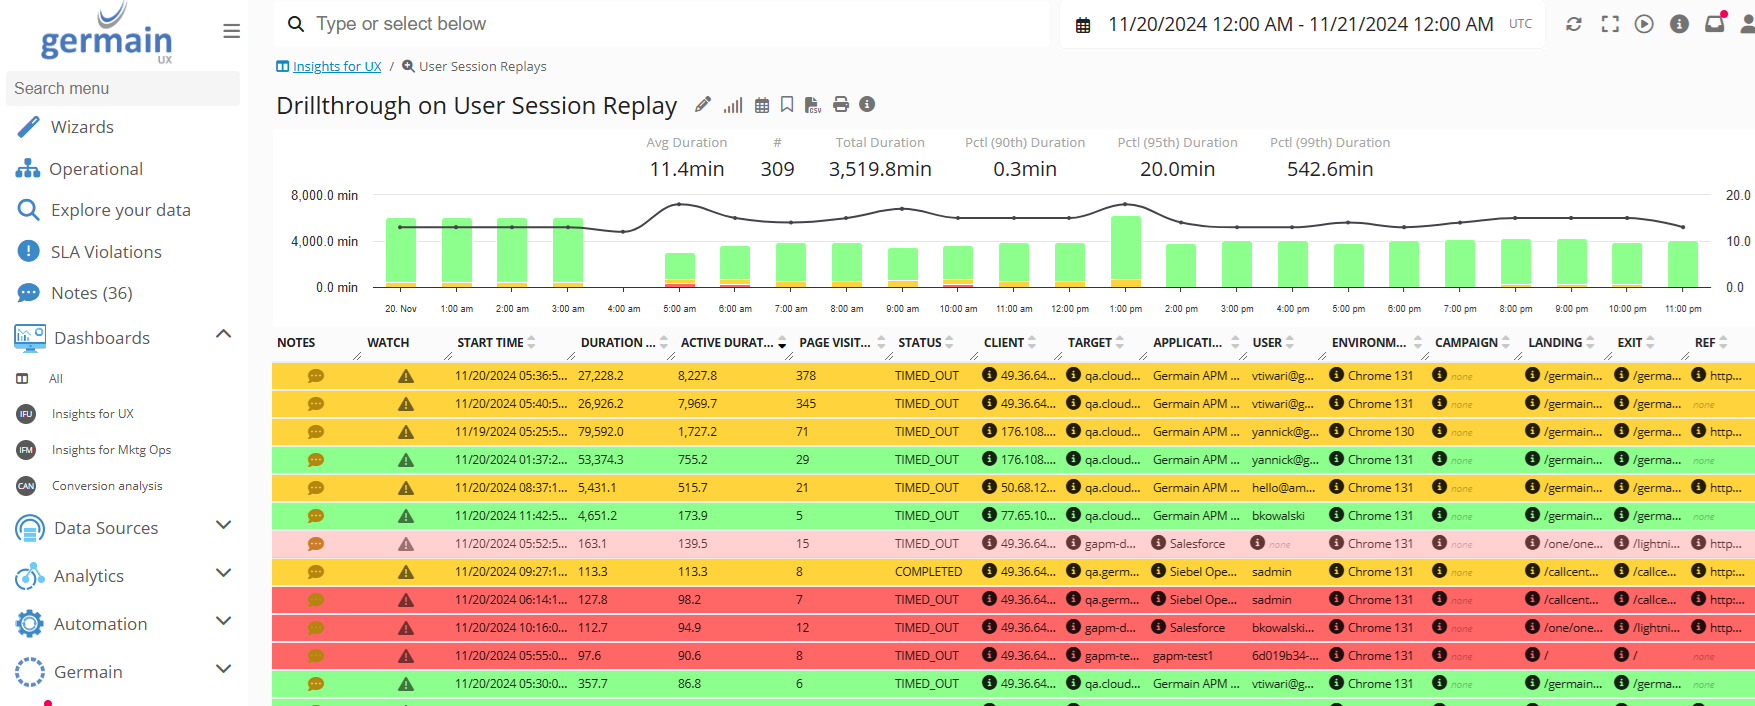
Heatmaps are tied to the [User Session Replay] KPI and visible after a drilldown on the 4th level dashboard called “User Session Replay RCA”.
From any portlet that displays [User Session Replay] KPI on an aggregate dashboard (1th level dashboard), you can simply drilldown onto the RCA. Several options are available:
-
Select “The Worst (RCA)”
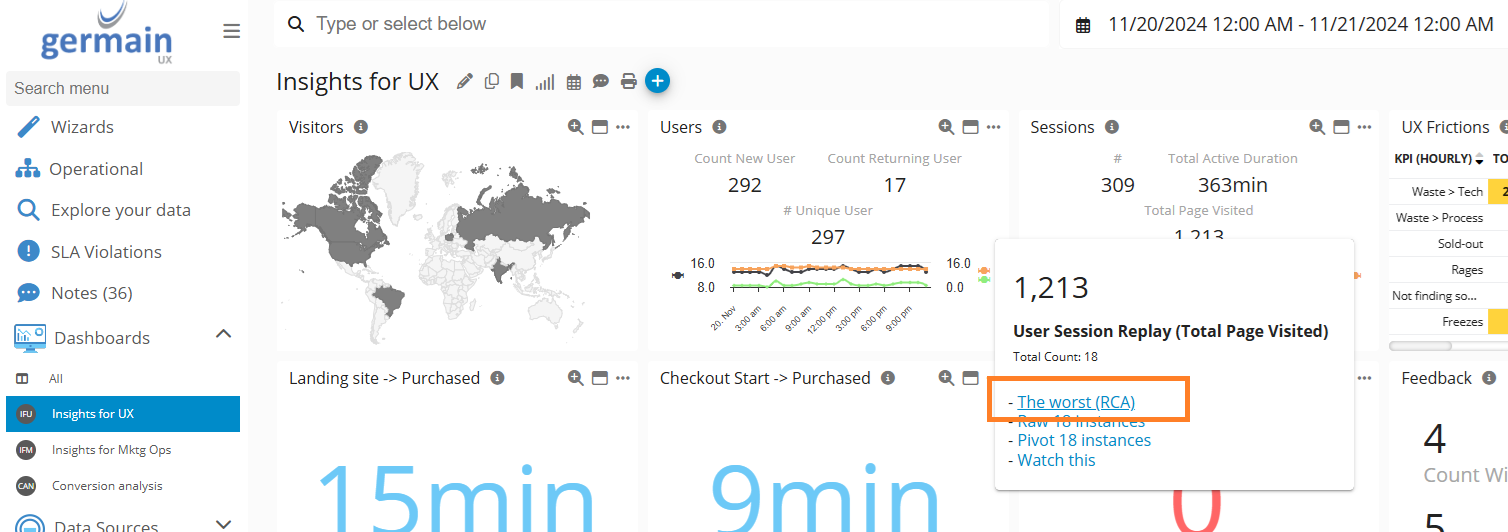
-
or Select “Raw … instances”
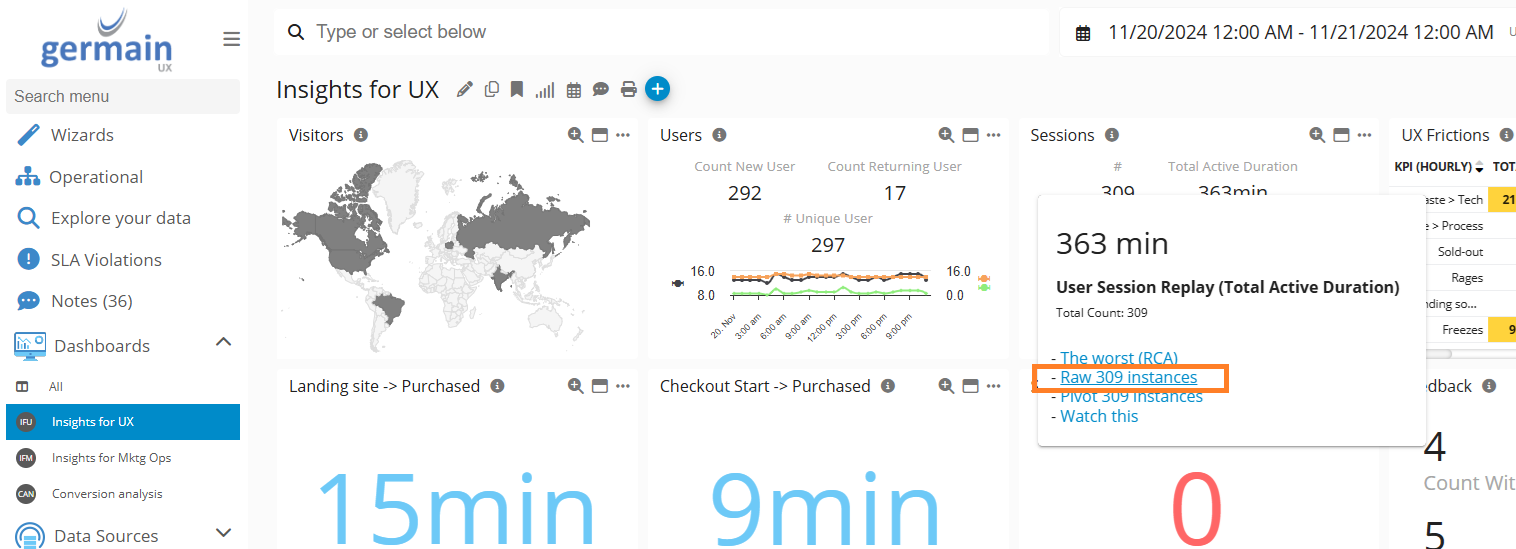
Select Raw Instances - Germain UX Then click on one the instances:
Click on one Raw Instance - Germain UX
-
Click on Overlays tab (on the right of the page)
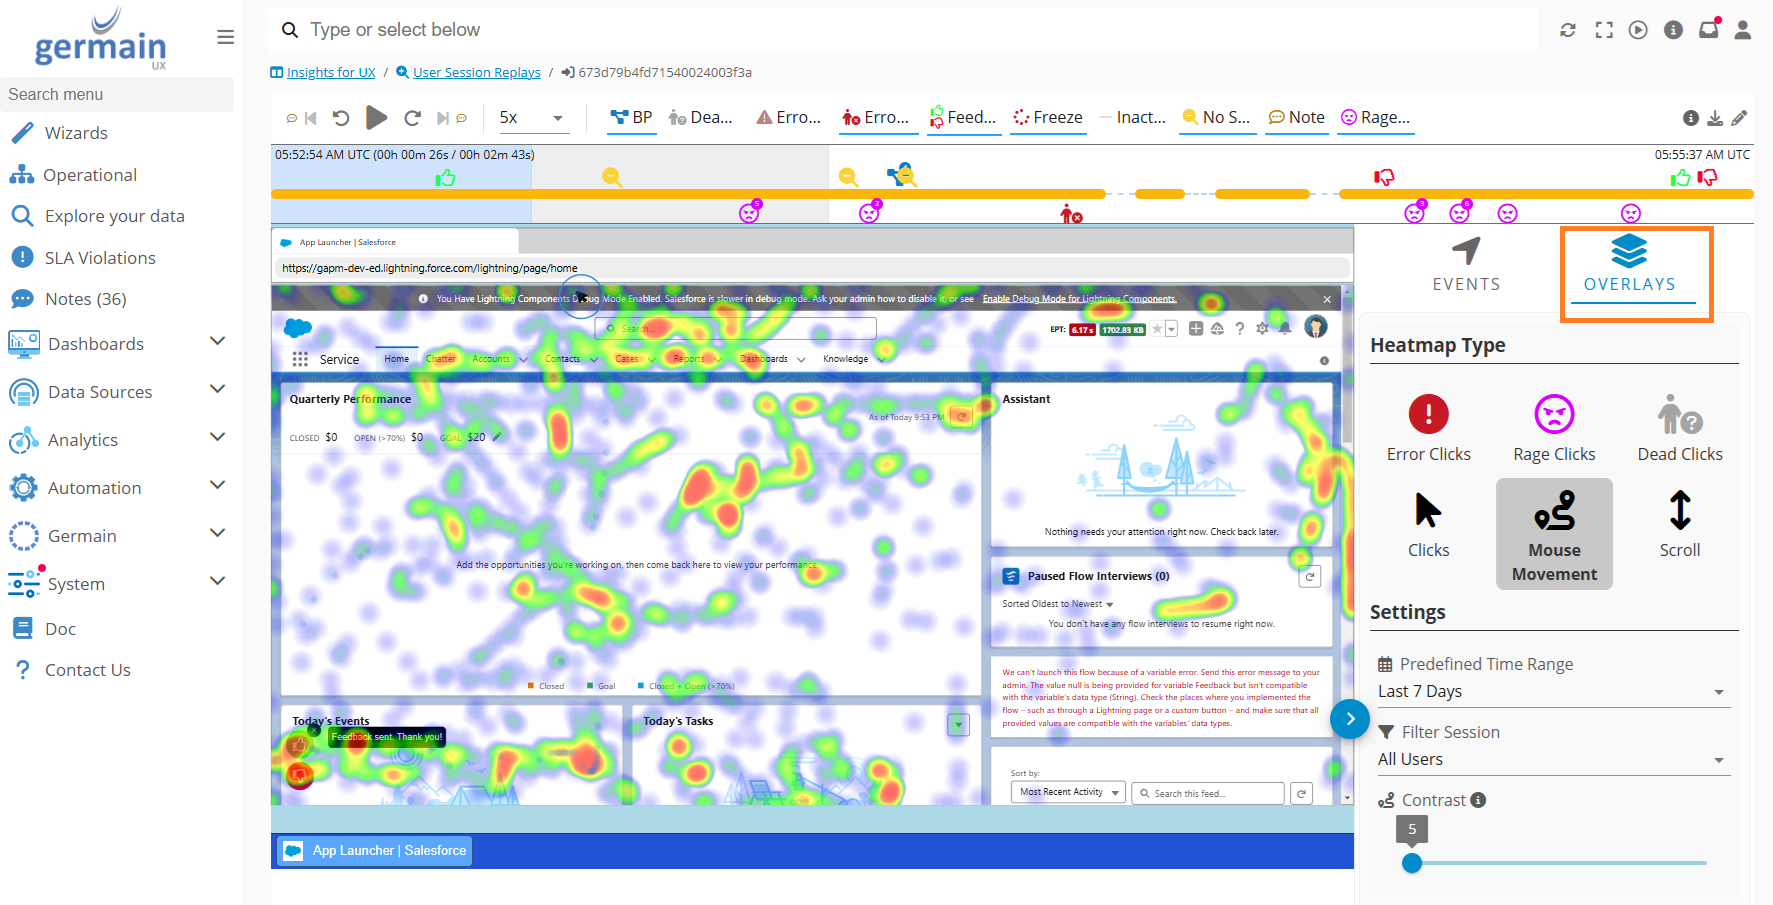
Click on Overlays tab - Germain UX
For any other questions, please contact us.
Service: Analytics
Feature Availability: 8.6.0 or later