Features for Apache Tomcat
Germain provides monitoring capabilities for Apache Tomcat, allowing you to track the uptime, performance, and user experience of your Tomcat applications. Germain monitors Tomcat from various standpoints and leverages multiple data sources, such as logs, portal, and JavaScript injection, to gather insights into its performance and user experience.
Here are some key aspects of Germain's monitoring capabilities for Apache Tomcat:
Uptime Monitoring
Germain continuously monitors the availability and uptime of your Apache Tomcat server. It ensures that the server is up and running, responding to requests, and serving your applications without any disruptions.
Performance Monitoring
Germain tracks the performance metrics of your Apache Tomcat applications. It captures data related to response times, throughput, resource utilization (CPU, memory), and other performance indicators. This information helps you identify performance bottlenecks, optimize resource allocation, and ensure smooth application operation.
Response Time
Track the response time of the Tomcat server to ensure it is within acceptable limits. Monitoring response time helps identify performance issues and potential bottlenecks.
Request Rate
Monitor the rate at which requests are being received by the Tomcat server. Tracking the request rate helps identify sudden spikes in traffic or unexpected changes in usage patterns.
Thread Pool Usage
Monitor the usage of the Tomcat thread pool, including the number of active threads and the size of the thread pool. Monitoring thread pool usage helps identify thread contention issues or thread pool exhaustion.
Memory Usage
Monitor the memory usage of the Tomcat server, including heap and non-heap memory. High memory usage can lead to performance degradation and potential out-of-memory errors.
Garbage Collection
Monitor the frequency and duration of garbage collection cycles. Analyzing garbage collection logs helps optimize memory management and identify potential memory leaks.
Error Logs
Regularly check the Tomcat server's error logs for any reported errors, warnings, or exceptions. Analyzing the error logs can help identify potential issues, misconfigurations, or application errors.
Connection Pool Usage
If your Tomcat server uses connection pooling (e.g., with a database), monitor the usage of the connection pool. This includes tracking the number of active connections, connection timeouts, and connection errors.
Servlet/JSP Execution Time
Monitor the execution time of Servlets and JSP pages to identify any performance bottlenecks or slow-running components.
Log File Monitoring
Monitor Tomcat's log files, including access logs and application logs, for relevant information, such as HTTP status codes, error messages, or custom log entries.
For more detailed information, please reach out to us. We will provide you with specific guidance and assistance tailored to your needs.
Configuration
-
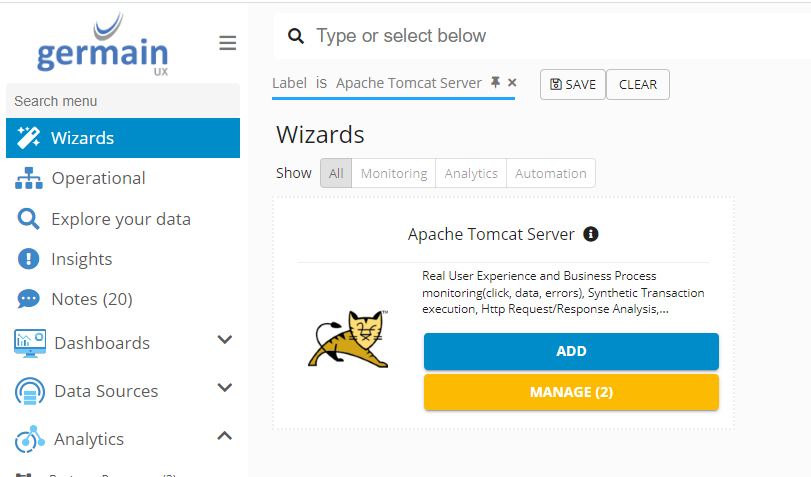
Go to Germain Workspace > Left Menu > Wizards > Apache Tomcat Server
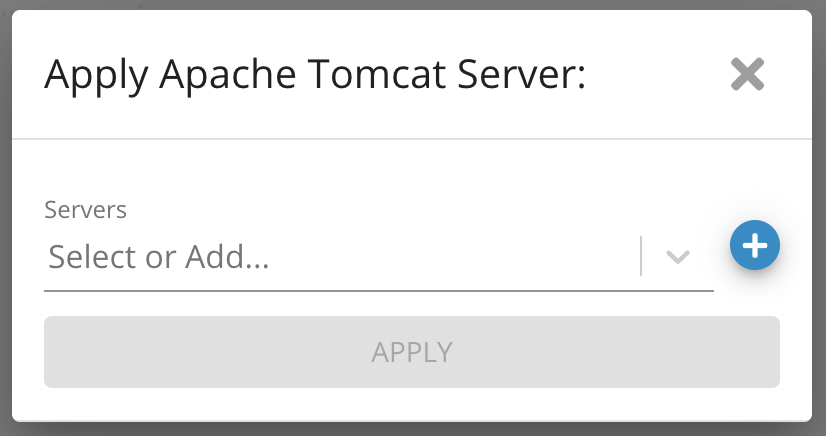
2. Select a server or create a new one
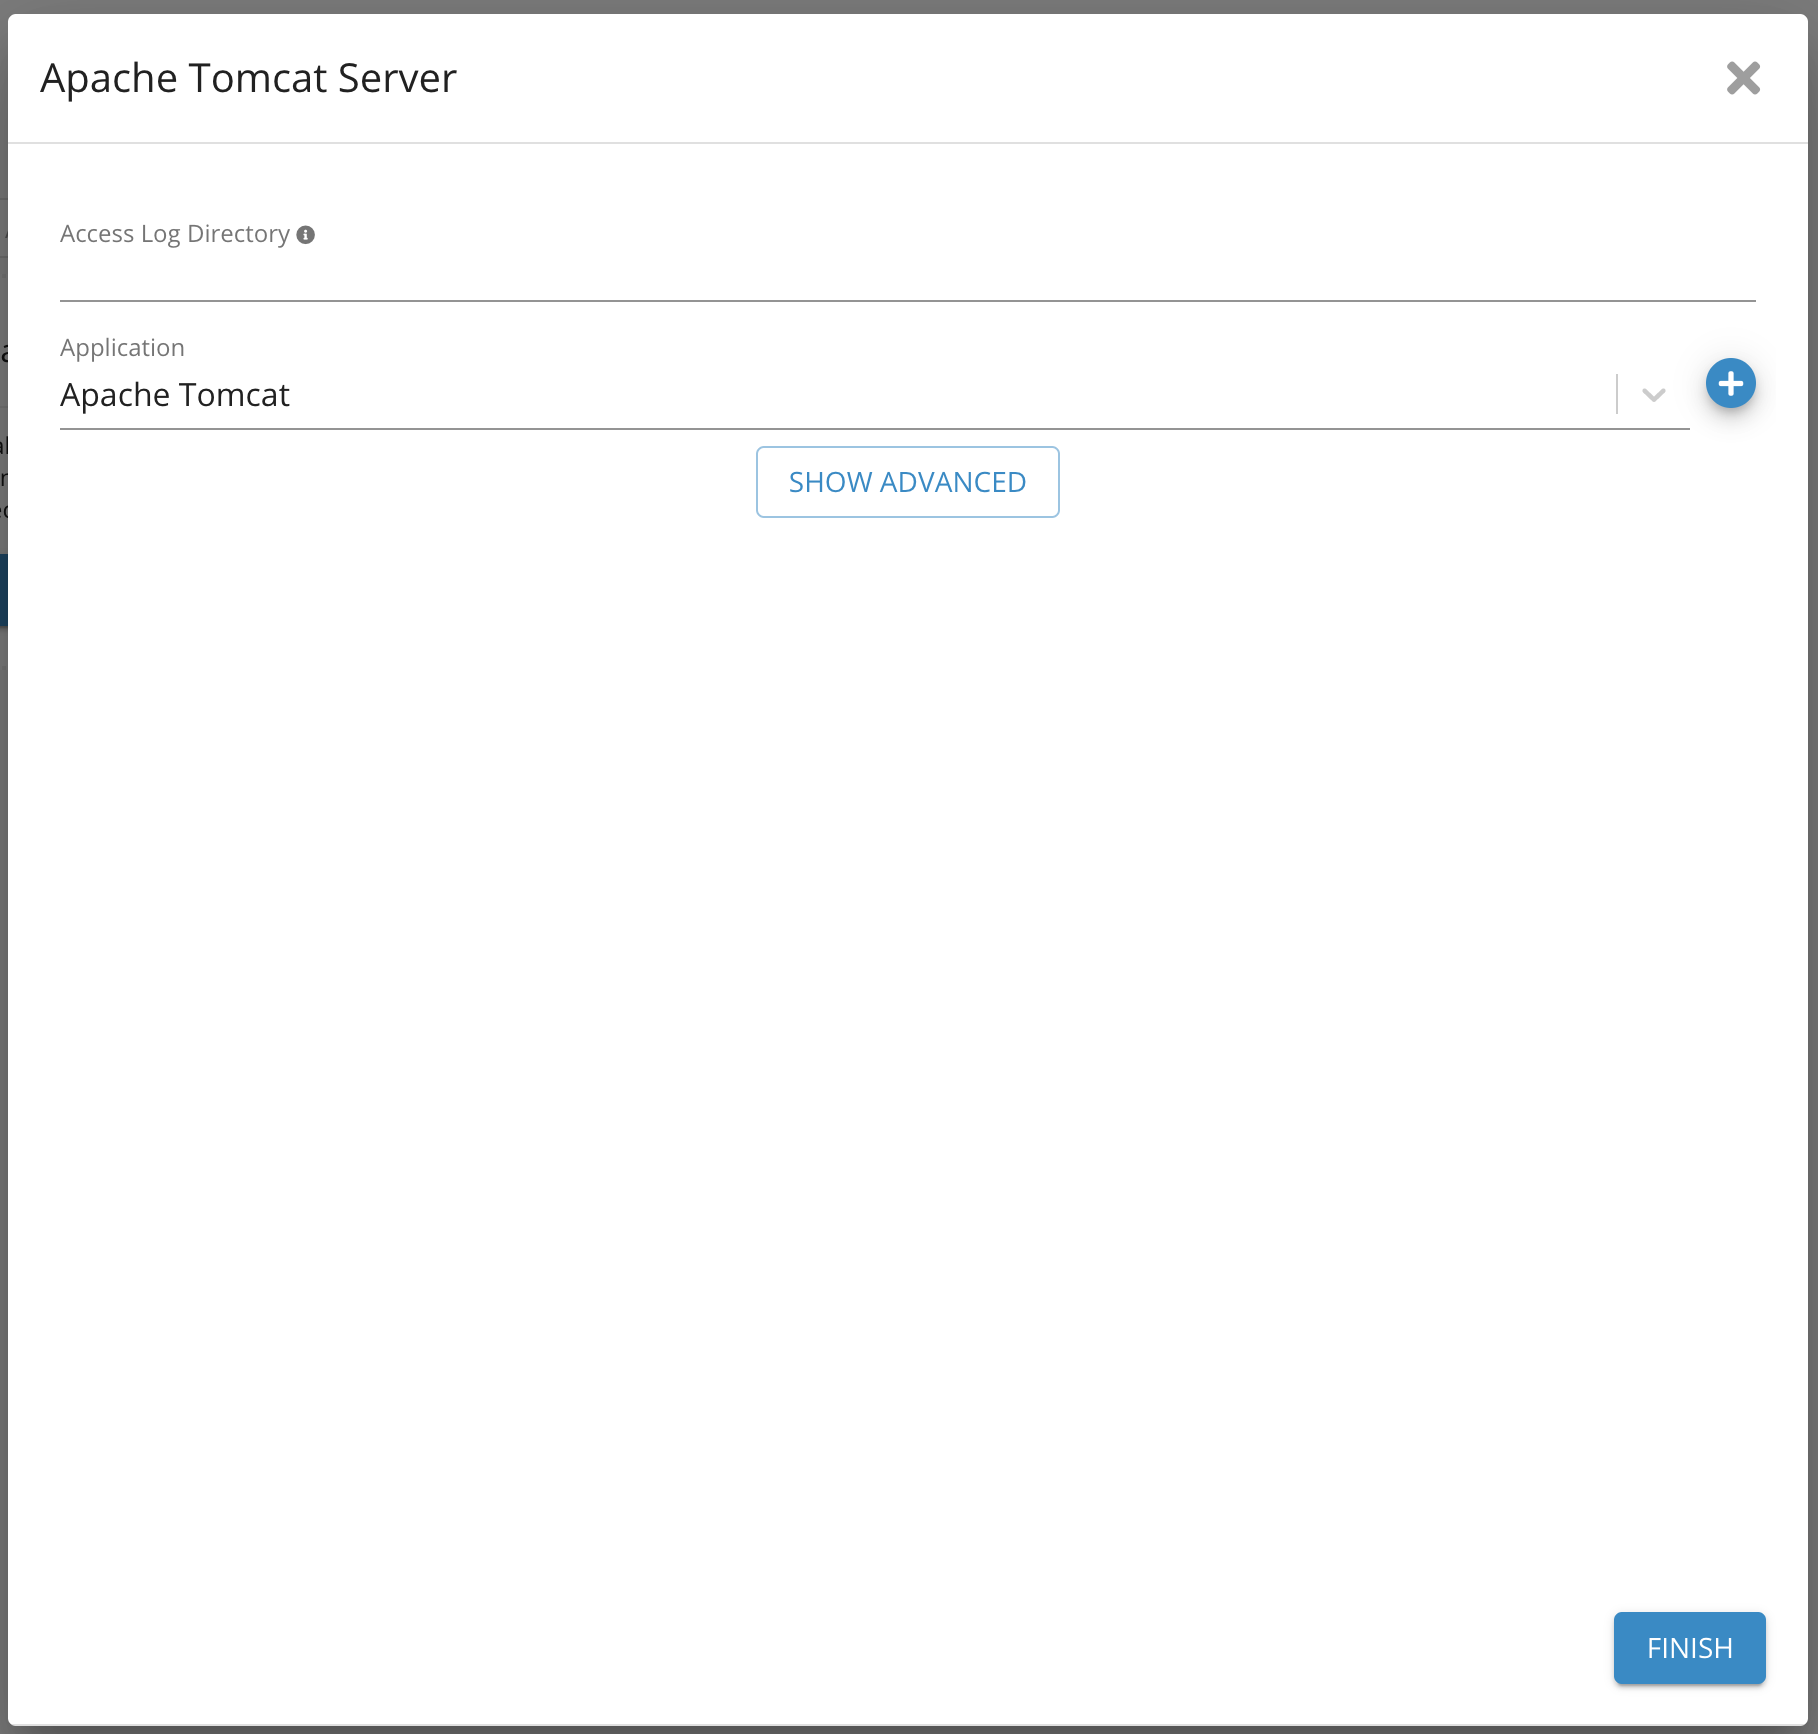
3. Provide path to your Tomcat log files location
Apache HTTP Server
-
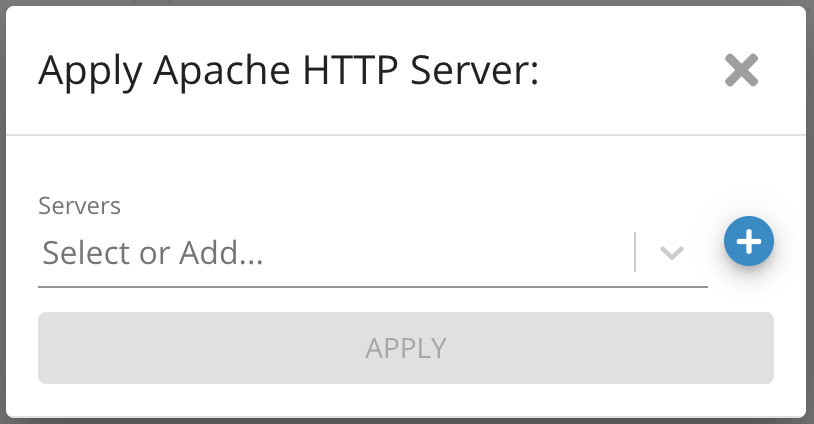
Go to Germain Workspace > Left Menu > Wizards > Apache HTTP Server
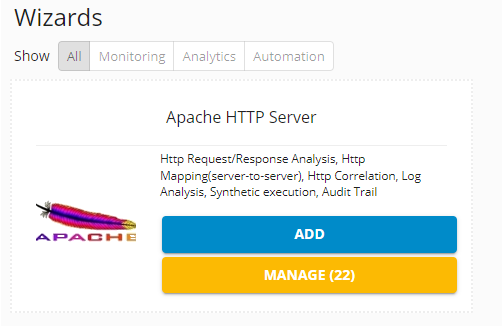
Apache HTTP Server Wizard - Germain UX
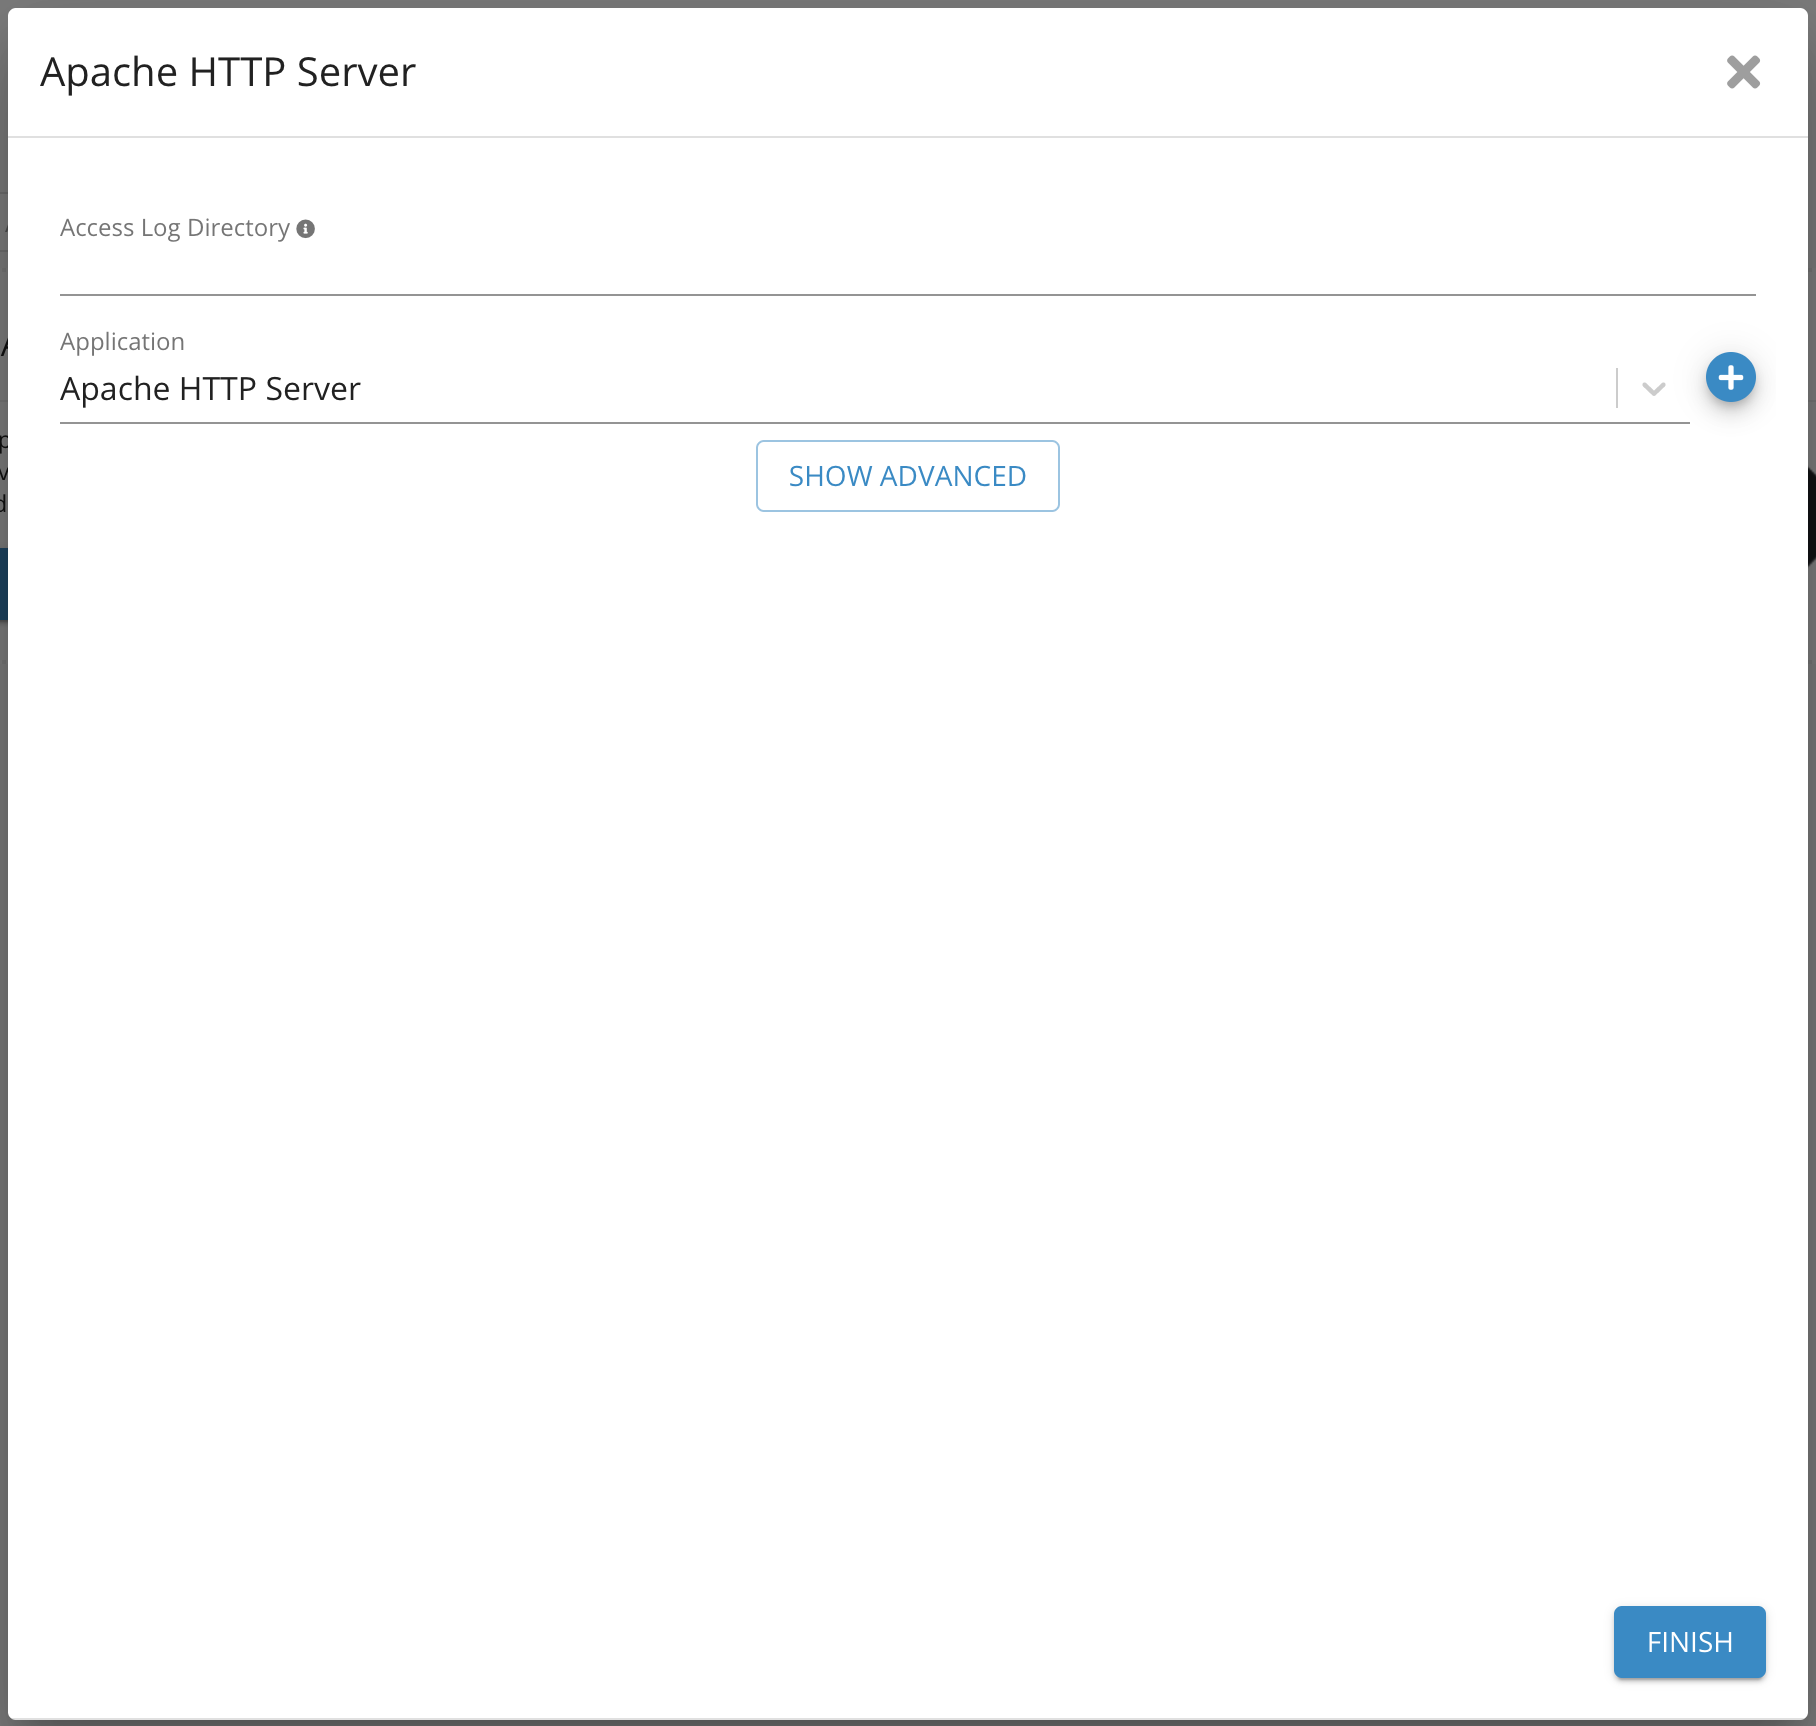
2. Select a server or create a new one
3. Provide path to HTTP log files location
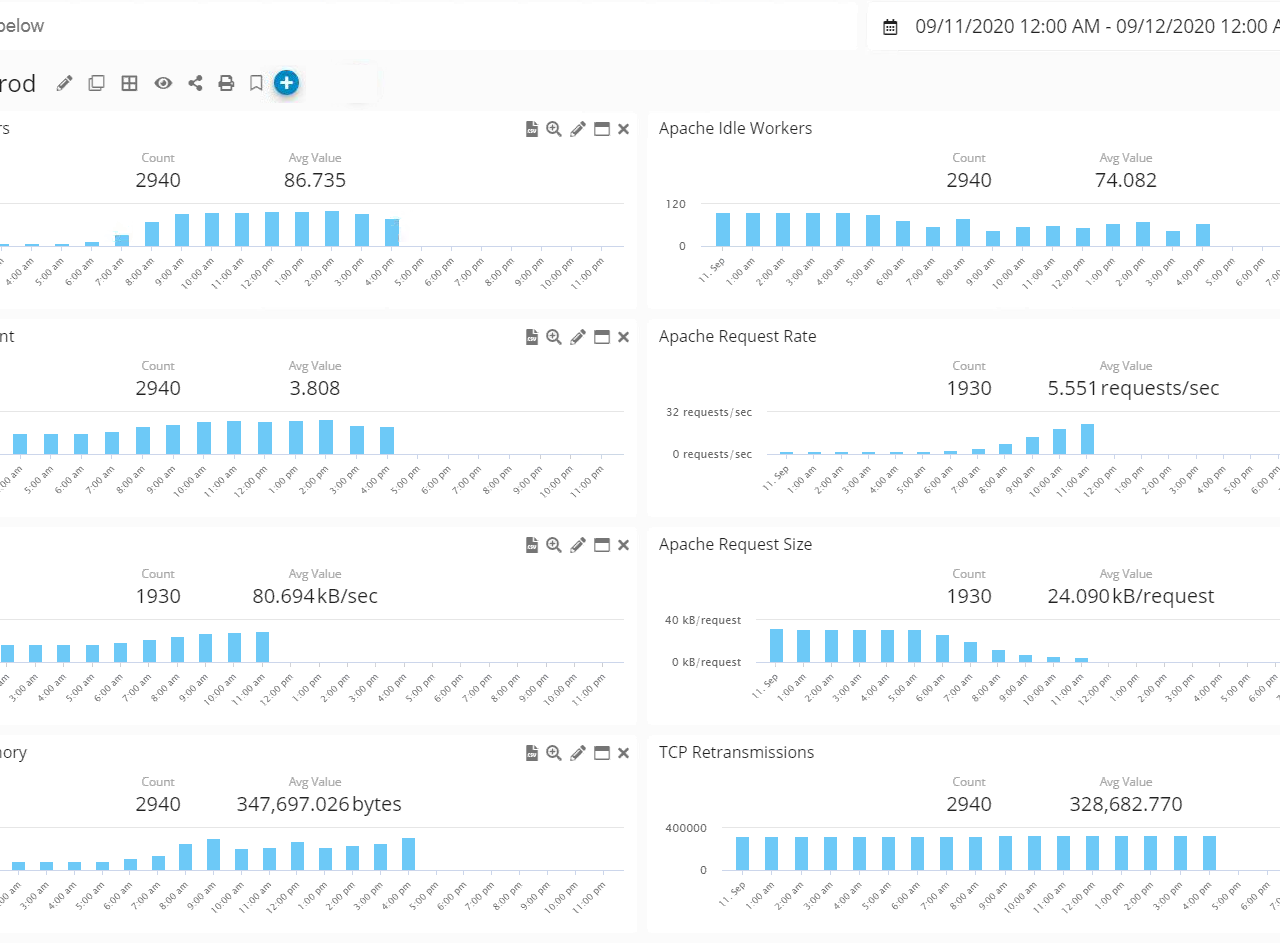
Example
Component: Engine
Feature Availability: 8.6.0 or later