
⚙️ Configure Error Monitoring for Oracle Siebel CRM
GermainUX detects, classifies, correlates, and analyzes errors affecting Oracle Siebel CRM users and business processes.
The objective is to separate operationally important failures from expected validation feedback and other low-value noise. GermainUX can then identify:
-
Which errors affect users
-
How many users and sessions are affected
-
Which screens, views, applets, and commands are involved
-
Which errors are new or recurring
-
Which business processes are interrupted
-
Whether the source is the browser, network, Siebel component, integration, or database
-
How error volume changes over time
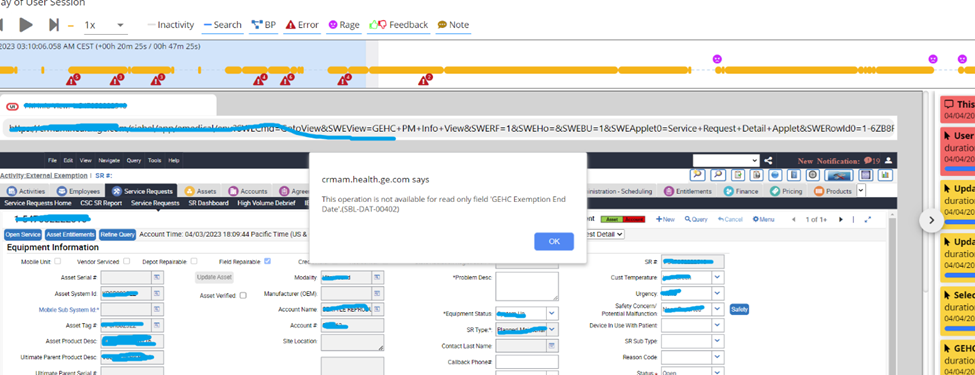
🏷️ Error classification
Use clear categories so expected user feedback is not mixed with application failures.
|
Category |
Definition |
Example |
|---|---|---|
|
User-facing application error |
The software is not operating as intended, and the failure is visible to the user. |
A Siebel popup reports a server, integration, or database failure. |
|
Silent application error |
The software is not operating as intended, but no error is displayed to the user. |
A JavaScript exception prevents a control from responding. |
|
User validation |
Siebel provides expected feedback because an entry or action does not satisfy a business rule. |
A required field is missing or a value is invalid. |
|
Technical warning |
A technical condition worth collecting but not necessarily affecting a user. |
A recoverable warning appears in an Object Manager log. |
User-facing and silent application errors are of direct technical interest. User validations can still reveal confusing design, training needs, or inefficient workflows, but they should not be counted as broken software.
The legacy GermainUX attribute
userErrormay identify an error displayed to a user. It does not necessarily mean that the user caused the error. Confirm its semantics in the installed GermainUX version before using it in reports.
📋 Prerequisites
Before configuring error monitoring:
-
Deploy RUM JS for browser-side and user-facing error monitoring.
-
Deploy the GermainUX Engine for Object Manager, server, integration, and log monitoring.
-
Configure the Siebel Open UI UX Monitoring Profile.
-
Configure Siebel Object Manager log collection and parsing.
-
Confirm that user sessions and server-side facts reach GermainUX.
-
Identify custom Siebel error codes.
-
Define which validations should be tracked separately.
-
Review sensitive-data and retention requirements.
See:
🔍 Error sources
GermainUX can collect Siebel errors from several sources.
|
Source |
Examples |
|---|---|
|
Popup dialogs |
Siebel alerts, |
|
JavaScript console |
Exceptions, rejected promises, and console errors |
|
Network requests |
Failed HTTP requests, unsuccessful responses, and integration failures |
|
Siebel response bodies |
Error messages returned within otherwise successful HTTP responses |
|
Object Manager logs |
Server-side errors, warnings, exceptions, and error codes |
|
Server Manager |
Component, task, process, and availability failures |
|
Crash evidence |
Core dumps, FDR files, and crash-related errors |
|
Synthetic scenarios |
Failed steps, missing controls, timeouts, and validation failures |
Collecting multiple sources makes it possible to correlate what the user saw with the underlying technical failure.
🔧 Configure the Siebel UX Monitoring Profile
Go to:
Workspace > Analytics > UX Monitoring Profiles > Siebel OpenUI
Depending on the GermainUX version, this may appear under:
Workspace > Settings > Analytics > UX Monitoring Profiles
Select the profile used by the monitored Siebel environment.
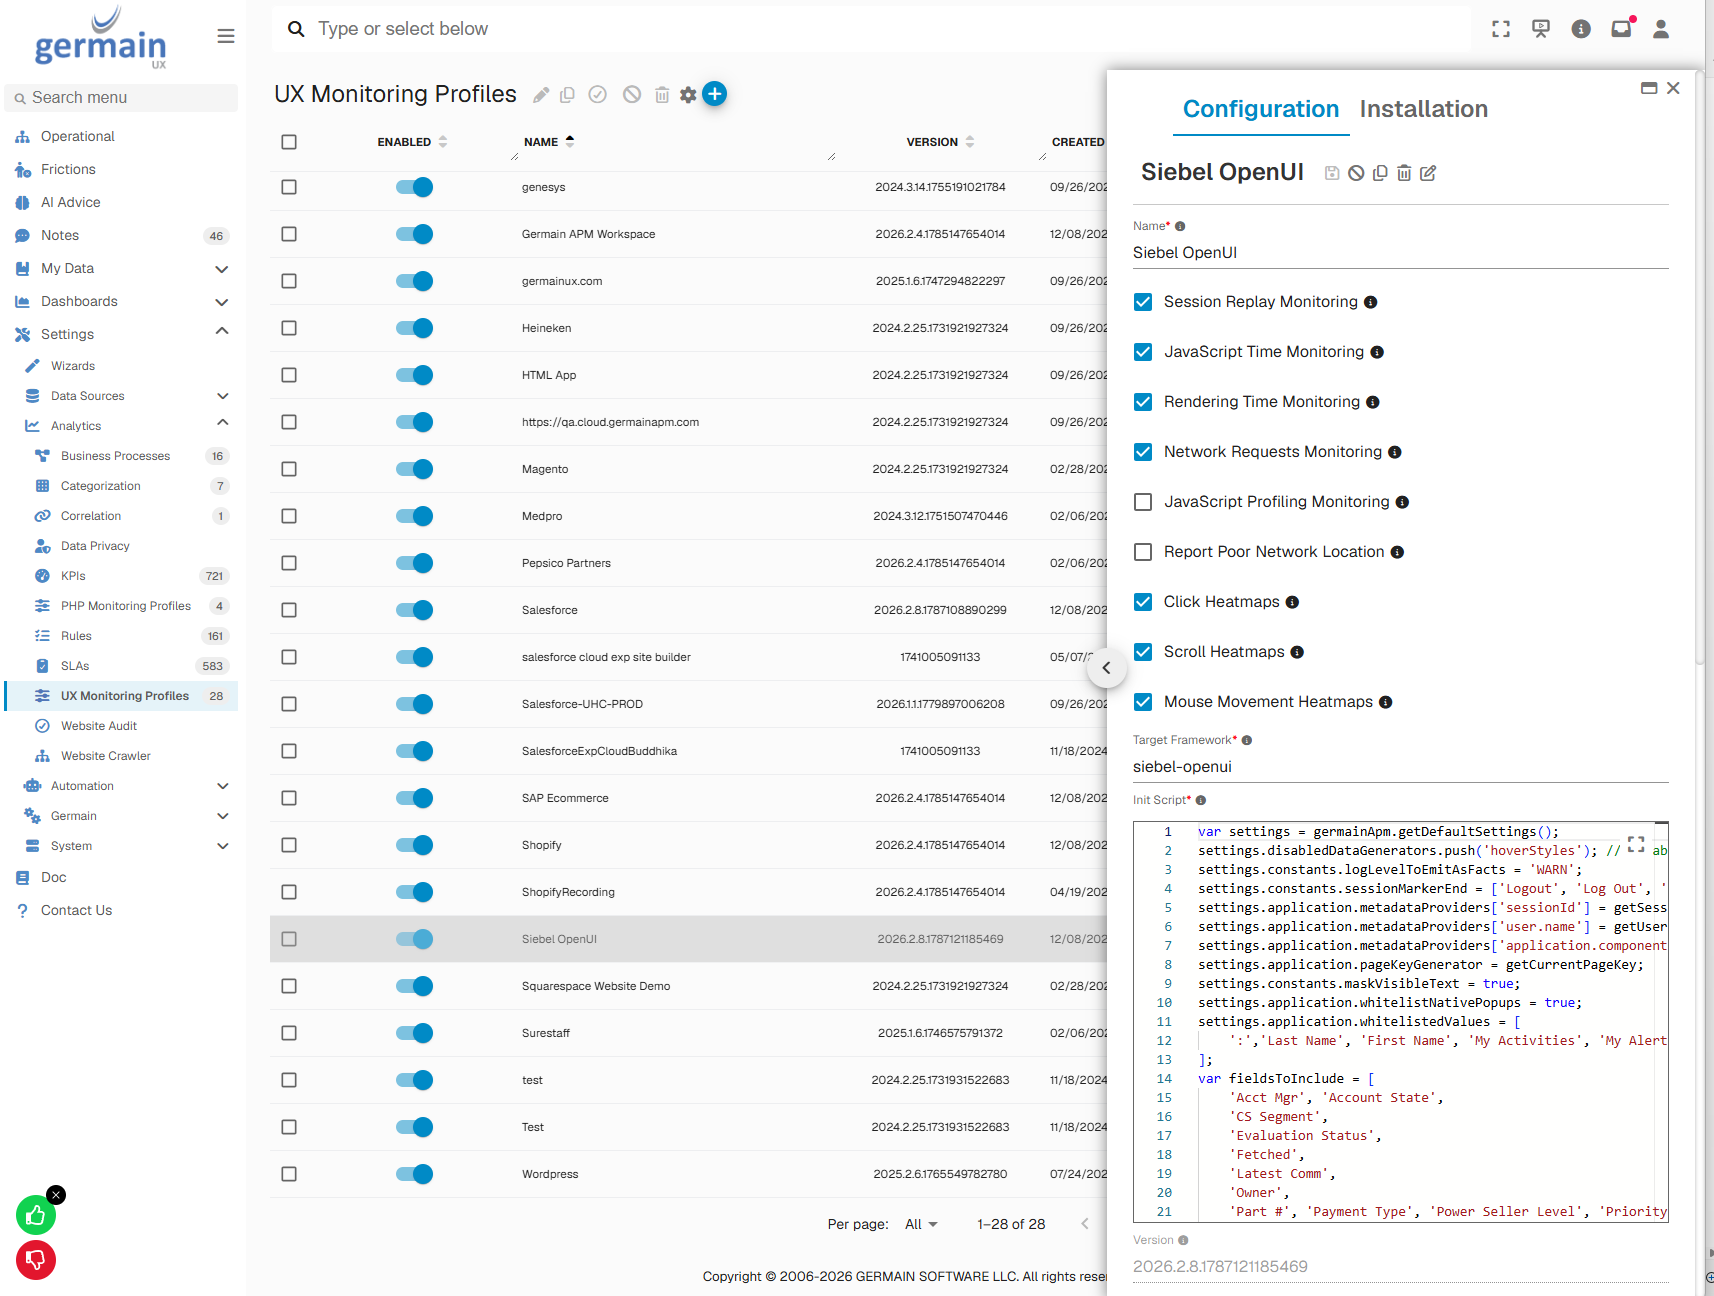
The standard Siebel Open UI profile provides Siebel-specific processing for:
-
User identification
-
Session identification
-
Siebel application component
-
Screen, view, applet, and command hierarchy
-
Popup categorization
-
SBL-*error extraction -
JavaScript error normalization
-
Network-request enrichment
-
Logout detection
-
Siebel-specific KPI types
-
Service Request business-process events
Use the standard Siebel configuration as the baseline. Preserve a backup before modifying its custom JavaScript.
💡 Recommended RUM settings
Review the following settings in the Siebel UX Monitoring Profile:
|
Setting |
Recommendation |
|---|---|
|
Session end markers |
Include Siebel logout labels such as |
|
Username provider |
Retrieve the current username through the supported Siebel application API |
|
Application component |
Retrieve the active Siebel application title or configured component |
|
Popup monitoring |
Enable and categorize |
|
JavaScript console monitoring |
Enable error-level console collection |
|
Network monitoring |
Capture and enrich relevant Siebel HTTP requests |
|
Response-body inspection |
Limit to required requests and protect sensitive data |
|
Hover-style monitoring |
Disable when it creates unnecessary Siebel browser overhead |
|
Logout handling |
Close the GermainUX session when Siebel logout is detected |
|
Privacy rules |
Mask or exclude confidential values before enabling production monitoring |
🔗 Capture Siebel context
Enrich browser-side errors with the active Siebel hierarchy:
|
Dimension |
Siebel context |
|---|---|
|
|
Screen |
|
|
View |
|
|
Applet |
|
|
Command or method |
The configuration can derive this context from:
-
The active Siebel application
-
The active view
-
The active applet
-
Siebel network-request parameters
-
Commands such as
SWEMethodandSWECmd
This allows errors to be analyzed by the exact screen, view, applet, and action involved.
💬 Detect popup errors
Configure popup monitoring to determine whether a Siebel alert represents an error.
A standard initial rule is:
Message contains "SBL-" → classify as an error
Do not assume that every SBL-* message represents a software failure. Apply additional categorization to separate:
-
Application failures
-
Expected business-rule validations
-
Security or permission messages
-
Informational messages
-
Custom organization-specific messages
For example, the standard Siebel configuration can identify:
SBL-EXL-00151
as a custom validation error.
📨 Detect errors in HTTP responses
Some Siebel requests can return an HTTP response successfully while the response body contains an application error.
Configure response inspection for the relevant Siebel requests and identify error content such as:
>Error Message</td>
Restrict response-body capture to the requests required for error analysis. Apply masking and exclusions because response bodies can contain customer or business data.
🔁 Normalize JavaScript errors
Normalize common browser exceptions so variations of the same problem can be analyzed together.
Examples include:
-
TypeError: Unable to get property -
TypeError: Object doesn't support property or method -
TypeError: Cannot read property -
Error: Cannot call method -
Error: No such method -
ReferenceError: ... is undefined -
TypeError: ... is not a function -
TypeError: Cannot read property ... of null -
Server busy or experiencing difficulties
Retain the original message and stack trace in the event details while using the normalized name for grouping and trend analysis.
📊 Apply Siebel-specific KPI types
The Siebel profile can transform general browser facts into Siebel-specific types.
Examples include:
Browser:User Click:Siebel
Browser:JS Console:Siebel
Browser:User Click:Siebel Cluster
Outbound browser requests can also be converted into the Siebel-specific request data model so they retain the corresponding screen, view, applet, user, and session context.
🗄️ Configure Object Manager error monitoring
Configure the GermainUX Engine to collect and parse Object Manager logs.
Verify that:
-
Siebel Log Directory Monitoris enabled. -
The correct log directories are configured.
-
Siebel Object Manager Parseris assigned. -
The correct localized parser resource is selected.
-
Application, environment, server, and component values are populated.
-
SBL-*codes and messages are extracted. -
Errors reach the intended Siebel KPIs.
For English Object Manager logs, the parser resource is:
/com/germainsoftware/apm/localization/parser-siebel-objmgr-enu.properties
📁 Map Siebel error codes to messages
Siebel stores standard and custom error messages in resource catalog files such as:
-
core.cat -
apps.cat -
vsia.cat -
inst.cat
On Windows, use the Siebel errmsg.exe utility to extract the error-code mappings.
For an English catalog:
%SIEBEL_ROOT%\bin\errmsg.exe /l ENU enu\core.cat > errors.txt
Repeat the extraction for every catalog containing relevant standard or custom error codes.
Example output:
SBL-GEN-02011 Error parsing Siebel message file header: incorrect facility name
Review the extracted mappings and add the required custom codes to the GermainUX SIEBEL_ERROR_CODE_MAPPING table.
Example for MySQL:
INSERT INTO SIEBEL_ERROR_CODE_MAPPING (CODE, MESSAGE)
VALUES (
    'SBL-GEN-02011',
    'Error parsing Siebel message file header: incorrect facility name'
);
Before updating the table:
-
Back up the existing mapping.
-
Use the database-specific SQL syntax.
-
Escape special characters correctly.
-
Avoid inserting duplicate codes.
-
Confirm whether an administrative import mechanism is available.
-
Test the mapping outside production.
-
Restart or refresh the relevant processing component if required by the GermainUX version.
Repeat this process after Siebel upgrades or changes to custom resource catalogs.
🗂️ Categorize errors
For Siebel, GermainUX is splittingCreate categorization rules that group equivalent errors and identify new errors.
Useful matching inputs include:
-
Siebel error code
-
Normalized message
-
JavaScript exception name
-
Stack trace
-
Screen
-
View
-
Applet
-
Object Manager
-
Integration endpoint
-
Response status
-
User-visible versus silent
-
Application failure versus validation
Categorization should produce stable groups even when messages contain changing values such as:
-
Record IDs
-
Usernames
-
Timestamps
-
Hostnames
-
Transaction IDs
-
Customer names
-
Numeric values
Remove or normalize those variable values before generating the category.
📈 Configure KPIs
Common KPIs for Siebel error analysis include:
-
User-Facing Error
-
Siebel FDR Crash
-
Siebel Core Crash
-
Siebel Errors
-
Siebel AI Errors
-
Siebel Gateway Error
-
Siebel Task Errors
-
Siebel SR Broker Errors
-
Siebel JavaScript Popup Dialog
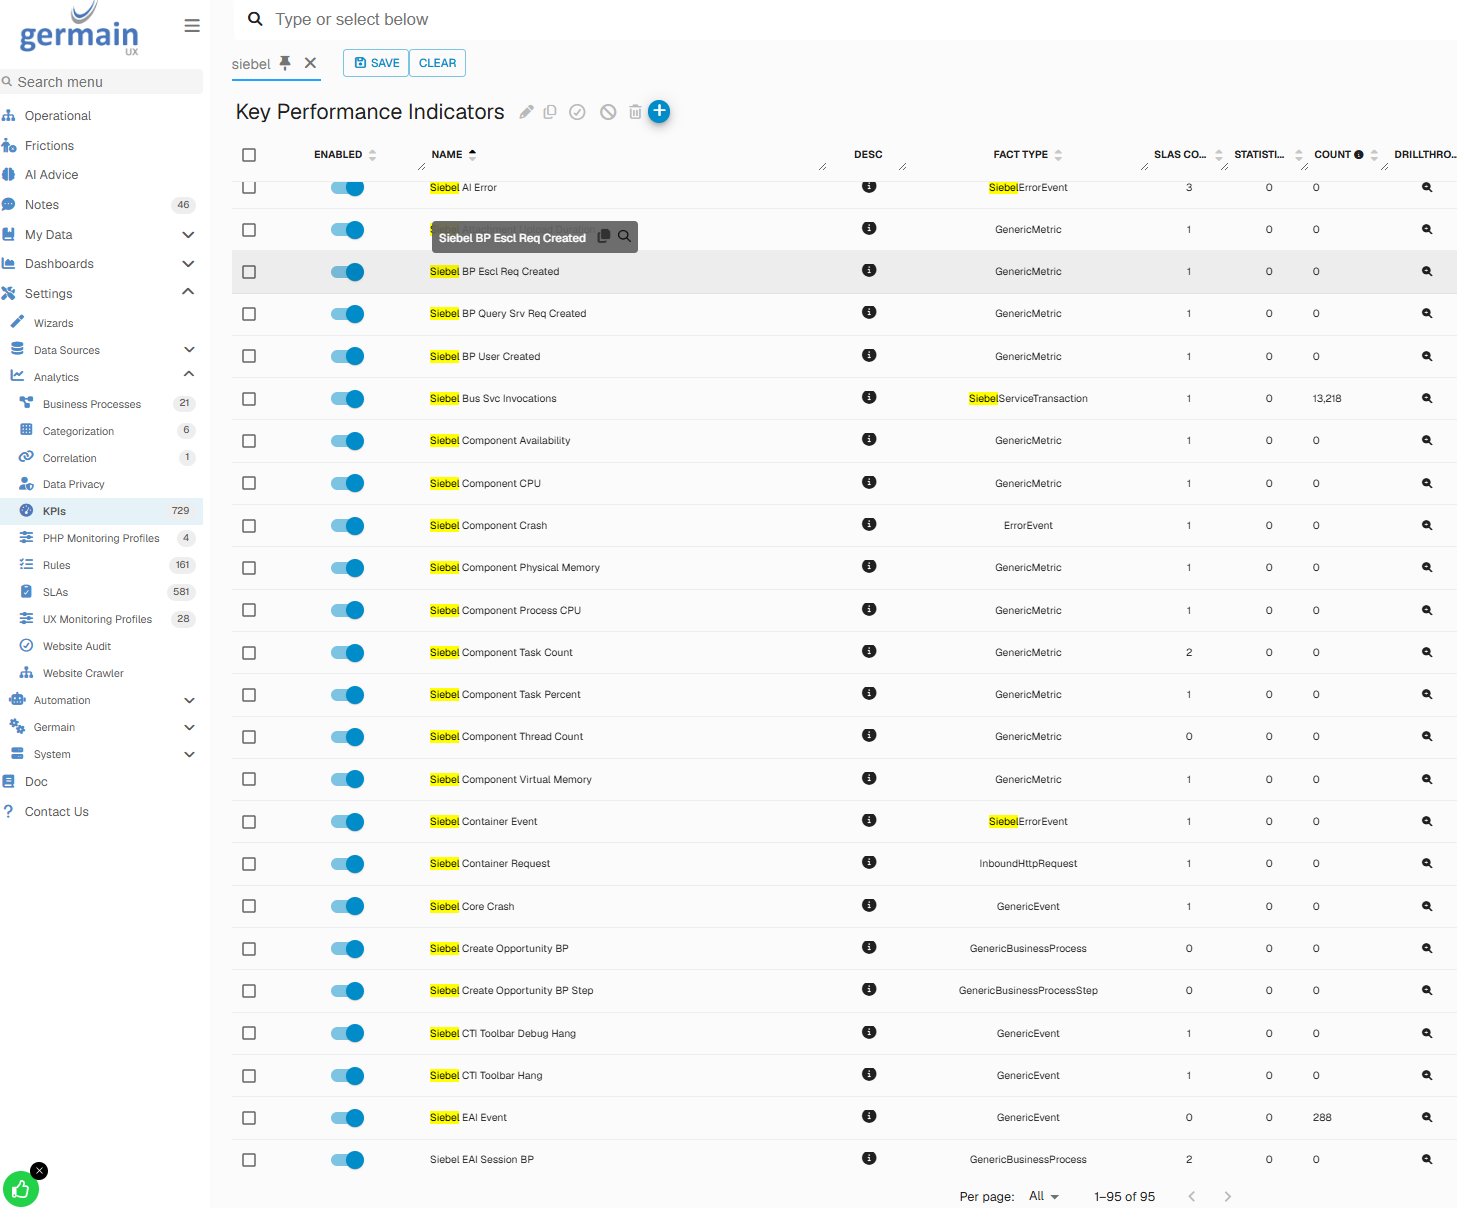
See KPIs for Oracle Siebel CRM.
🧩 Build an error-analysis portlet
Create a portlet using one or more error-related KPIs.
🧮 Measures
Useful measures include:
-
Count
-
Count Unique User
-
Count Unique Session
-
Error rate
-
Affected process count
-
Affected user percentage
📐 Pivots
Useful pivots include:
-
Name
-
Message
-
Error code
-
Category
-
Screen
-
View
-
Applet
-
User
-
Team
-
Application component
-
Server
-
Browser
-
New versus known
🔎 Filters
To analyze errors displayed to users in older configurations, use the available legacy field:
User Error = true
or:
userError = true
The exact field depends on the GermainUX version and data model.
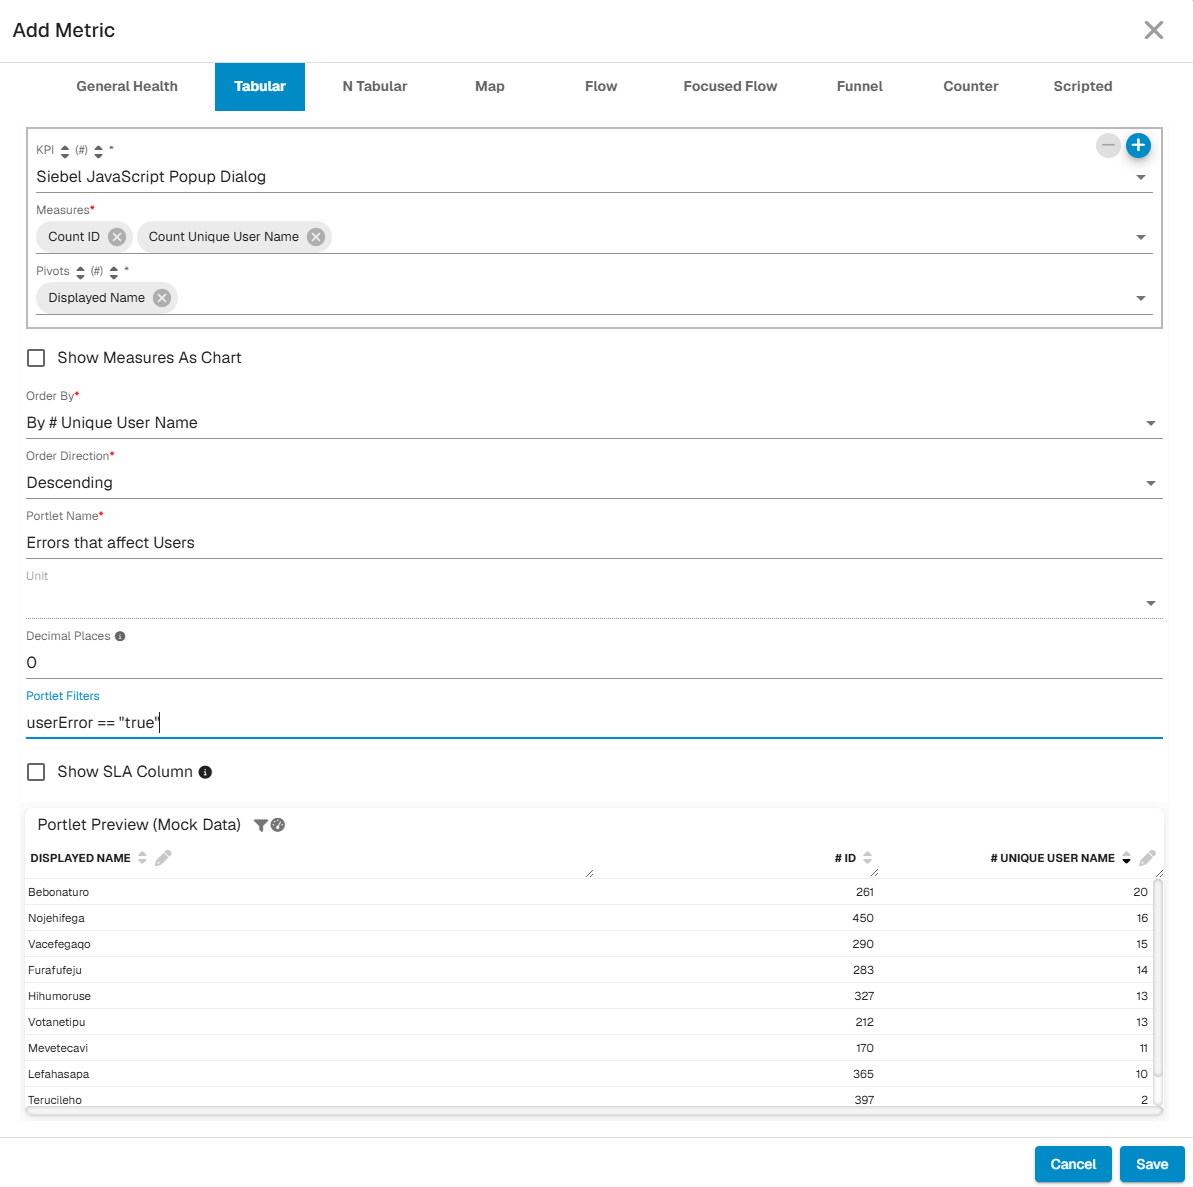
Treat this as a “displayed to user” attribute unless the configuration explicitly establishes that the user caused the condition.
Add category filters to separate:
Error Classification = User-facing application error
from:
Error Classification = User validation
🚫 Exclude low-value errors
Exclude an error only after verifying that it is:
-
Expected
-
Benign
-
Not affecting users or workflows
-
Not masking a broader operational issue
-
Already monitored through a more appropriate KPI
Prefer filtering or reclassification over deleting the source data. This preserves evidence if the error later becomes relevant.
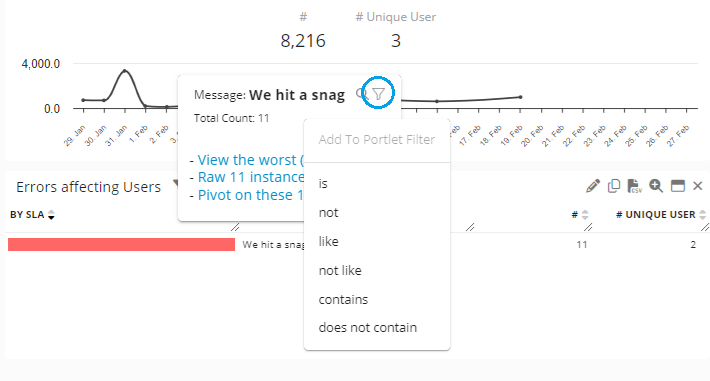
Document:
-
Error code or matching condition
-
Reason for exclusion
-
Approving owner
-
Date added
-
Review date
Review exclusions after Siebel releases and configuration changes.
❗ Critical error codes to review
Critical errors are automatically detected and categorized by GermainUX, yet that often needs to be adjusted to each siebel environment.
-
User-Facing Error KPI: the errors produced by the browser that the siebel user sees.
-
The following Object Manager errros have historically been treated as important in some Siebel environments:
-
SBL-SVR-01042 -
SBL-SRM-00016 -
SBL-OSD-00034 -
SBL-GDB-00001 -
SBL-NET-01205
-
These codes may not be critical or applicable in every environment. Review their meaning, frequency, affected components, and operational impact before assigning alert severity.
🔔 Configure alerts and reports
Configure immediate alerts for:
-
New critical errors
-
Sudden error-volume increases
-
Errors affecting many users
-
Errors interrupting a critical process
-
Repeated integration failures
-
Critical Object Manager errors
-
Errors correlated with component unavailability
-
Previously resolved errors that recur
Configure scheduled reports for:
-
Error volume trends
-
New versus known errors
-
Most affected users
-
Most affected screens, views, and applets
-
Most frequent error codes
-
Errors by component or server
-
User validations by workflow step
-
Errors correlated with lost productivity
-
Resolved and recurring categories
Avoid sending a separate incident notification for every occurrence of the same known error. Use grouping, thresholds, affected-user counts, and time windows to control noise.
See:
✅ Validate the configuration
Test representative examples of each category.
 User-facing application error
Confirm that:
-
The popup is captured.
-
The
SBL-*code is extracted. -
The screen, view, applet, user, and session are attached.
-
The event is classified as an application failure.
-
The related server-side evidence is correlated.
⚪ User validation
Confirm that:
-
The message is captured when required.
-
It is classified separately from application failures.
-
It does not inflate the technical error rate.
-
It remains available for workflow or design analysis.
👻 Silent JavaScript error
Confirm that:
-
The console or runtime exception is collected.
-
The stack trace is retained.
-
The exception name is normalized.
-
The affected click and session are correlated.
📄 Object Manager error
Confirm that:
-
The log file is collected.
-
The parser extracts the error code and message.
-
Custom code mappings resolve correctly.
-
The application, server, and component are correct.
🧰 Troubleshooting
🔎 Popup errors are missing
Verify that:
-
RUM JS is loaded.
-
Popup monitoring is enabled.
-
The Siebel UX Monitoring Profile is assigned.
-
The categorizer is active.
-
The popup occurs in a monitored browser context.
-
The user and URL are within the capture scope.
❓ Errors appear without Siebel context
Check:
-
Access to
SiebelApp -
Active application, view, and applet detection
-
Network-event enrichment
-
URL and query parsing
-
Timing of metadata-provider initialization
-
Whether the event occurs before Siebel has initialized
⚙️ Custom error codes show no message
Verify that:
-
The correct catalog was extracted.
-
The correct language was used.
-
The code exists in
SIEBEL_ERROR_CODE_MAPPING. -
The transaction updating the table was committed.
-
Quotes and special characters were escaped.
-
The processing component refreshed the mapping.
🔥 Error volume is too high
Review:
-
Expected user validations
-
Repeated console messages
-
Duplicate RUM initialization
-
Retry activity
-
Benign network requests
-
Overly broad response-body matching
-
Known errors that require categorization rather than individual alerts
📚 Related Documentation
-
Other Analytics Features
-
Other Automation Features
ℹ️ Get Help
The Germain Team can help you set this up. Contact GermainUX Support.
Component: Engine, JS Profiler, Mobile App, RPA Bot Recorder, RUM JS
Feature Availability: 2014.1 or later