
⚙️ Configure Salesforce Audit Monitoring
GermainUX collects Salesforce audit information to help teams identify administrative and configuration changes that may affect security, performance, reliability, or user experience.
🔎 Audit Monitoring helps answer:
-
Question
-
What changed in Salesforce?
-
Who made the change?
-
When did it occur?
-
Which Salesforce environment was affected?
-
Did the change coincide with a new error or performance regression?
-
Did it affect user access, workflows, integrations, or application behavior?
Audit Monitoring is performed by the GermainUX Engine and is enabled automatically when Salesforce monitoring is deployed through the Salesforce Application wizard.
📦 What Audit Monitoring Provides
Depending on the audit information available through Salesforce and the permissions granted to the integration user, GermainUX can monitor changes related to:
-
Area
-
Salesforce configuration
-
Users, profiles, permission sets, and access
-
Connected Apps and authentication settings
-
Objects and fields
-
Workflows, flows, and automation
-
Apex classes and triggers
-
Lightning and Visualforce configuration
-
Reports and dashboards
-
Sharing and security settings
-
API and integration configuration
-
Other administrative changes recorded by Salesforce
Each audit record may include available attributes such as:
-
Attribute
-
Change timestamp
-
User or administrator
-
Action
-
Configuration area
-
Description
-
Salesforce organization
-
Environment
-
Related object or component
✅ Prerequisites
Before configuring Audit Monitoring, confirm that:
-
A GermainUX Engine is deployed and running.
-
Salesforce monitoring has been deployed through the Salesforce Application wizard.
-
The Salesforce OAuth connection is active.
-
The integration user can access the required Salesforce audit information.
-
The selected GermainUX Engine can reach Salesforce APIs.
-
The Salesforce organization has sufficient API capacity for the selected collection frequency.
For the initial integration, see Deploy GermainUX for Salesforce.
🚀 Enable Audit Monitoring
Audit Monitoring is enabled automatically during the initial Salesforce Application wizard deployment.
To deploy it:
-
Open GermainUX Workspace.
-
Open the left navigation menu.
-
Select Wizards.
-
Select Salesforce Application.
-
Choose the GermainUX Engine that will monitor Salesforce.
-
Enter the Salesforce connection and authentication settings.
-
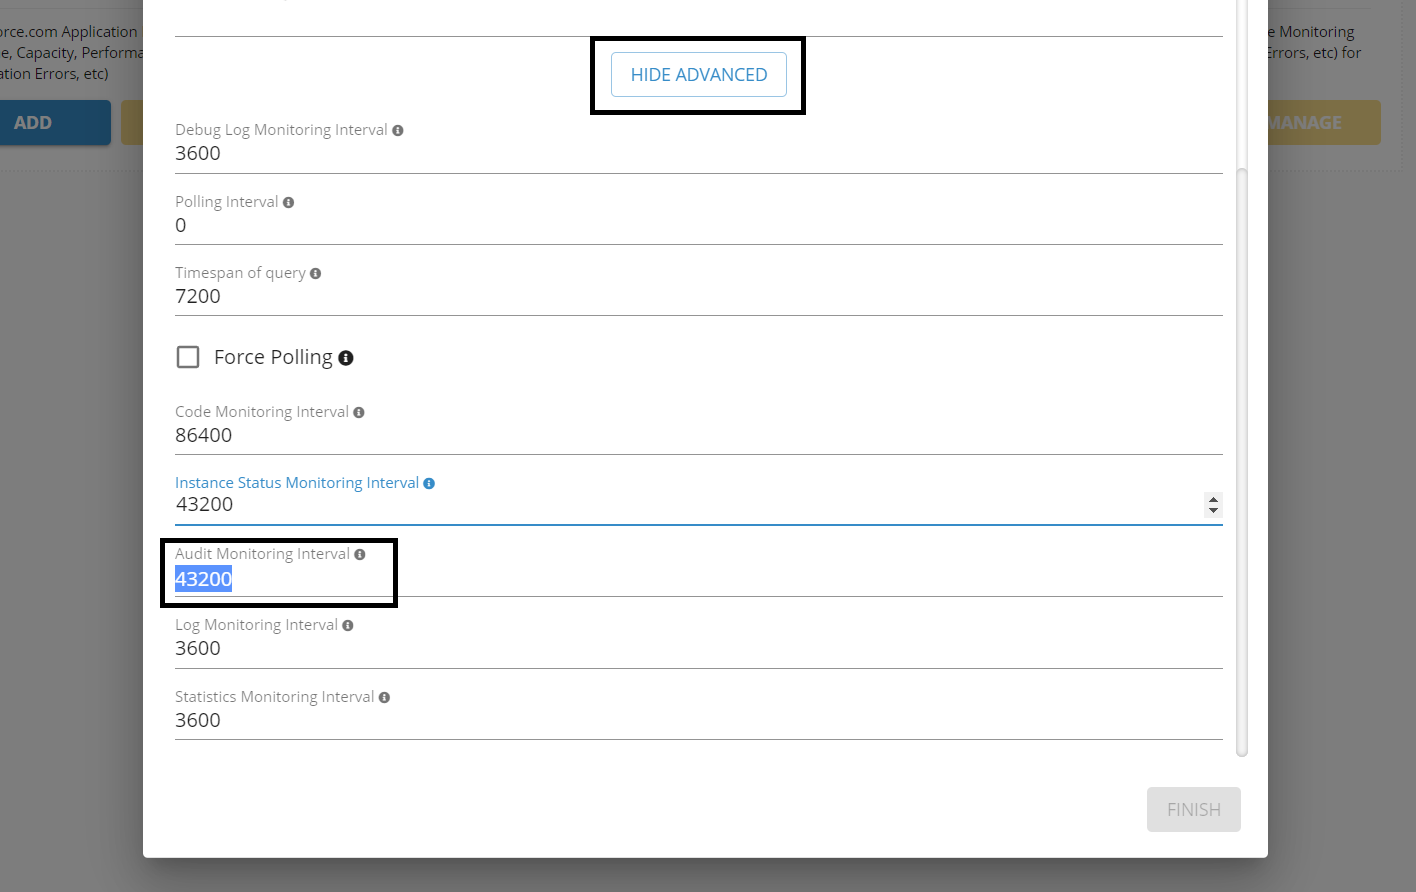
Expand Show Advanced if you want to customize the audit collection interval.
-
Set Audit Monitoring Interval.
-
Complete the wizard.
The wizard creates a component with this type:
Salesforce Audit Monitor
📅 Default Collection Frequency
By default, Salesforce Audit Monitoring runs every 12 hours.
This schedule is appropriate for general configuration-change tracking. Use a shorter interval when faster detection is required, while considering:
-
Consideration
-
Salesforce API consumption
-
Number of monitored organizations
-
Audit-event volume
-
Required alerting speed
-
GermainUX processing and storage
For immediate security or activity detection, Salesforce Real-Time Event Monitoring may also be required because scheduled audit collection is not designed as a real-time security feed.
🔧 Configure the Frequency During Deployment
During the initial Salesforce Application wizard:
-
Select Show Advanced.
-
Locate Audit Monitoring Interval.
-
Enter the required frequency.
-
Complete the wizard.
🔁 Change the Frequency After Deployment
To update the schedule of an existing audit monitor:
-
Open GermainUX Workspace.
-
Open the left navigation menu.
-
Select Germain.
-
Open the State tab.
-
Search for:
Type Name = Salesforce Audit Monitor
Salesforce Audit Monitoring component -
Select the monitor associated with the intended Salesforce organization.
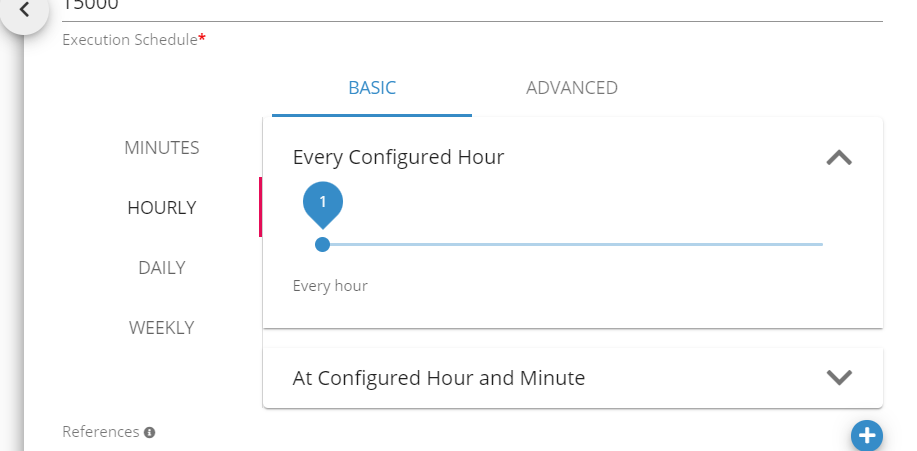
-
Update Execution Schedule.
-
Save the change.
The revised schedule applies to subsequent executions.
⛔ Disable Audit Monitoring
To stop ongoing collection without removing the entire Salesforce integration:
-
Open GermainUX Workspace.
-
Open the left navigation menu.
-
Select Germain.
-
Open the State tab.
-
Search for:
Type Name = Salesforce Audit Monitor -
Locate the appropriate monitor.
-
Turn off the toggle in the Enabled column.
-
Save the change if prompted.
Disabling the monitor stops future collection. Previously collected audit records remain available according to the applicable GermainUX retention policy.
▶️ Re-enable Audit Monitoring
To resume collection:
-
Return to Germain → State.
-
Search for
Salesforce Audit Monitor. -
Turn on the Enabled toggle.
-
Confirm the execution schedule.
-
Save the configuration.
-
Allow the next scheduled execution to run.
📊 View Salesforce Audit Data
Open:
Dashboards → IT → Application → Salesforce → Salesforce
Review the portlets related to Audit.
The dashboard can help analyze:
-
Analysis
-
Recent Salesforce changes
-
Changes by administrator
-
Change categories
-
Affected components
-
Change frequency
-
Changes by organization or environment
-
Configuration activity preceding an issue
Select an audit metric or record to open its details and related evidence.
🎯 Salesforce Audit KPIs
See Salesforce Audit KPIs.
These KPIs can be used to:
-
KPI
-
Count configuration changes
-
Track trends
-
Segment changes by administrator or category
-
Identify unusual administrative activity
-
Compare environments
-
Correlate changes with application regressions
🔗 Correlate Changes With Salesforce Issues
Audit data becomes particularly useful when analyzed alongside other Salesforce telemetry.
For example:
-
Salesforce response time degrades.
-
GermainUX identifies when the degradation began.
-
Audit records show that a Flow, Apex class, permission, or integration setting changed shortly beforehand.
-
Related errors, debug logs, user sessions, and Session Replay provide additional evidence.
-
The team confirms whether the change caused or contributed to the regression.
Audit records can be correlated with:
-
Apex exceptions
-
Debug logs
-
Salesforce errors
-
API and integration failures
-
User-facing errors
-
Slow interactions
-
Failed workflows
-
Session Replay
-
Salesforce deployments
-
Instance-status events
A temporal correlation is evidence for investigation, but it does not by itself prove causation.
🔔 Configure Alerts
Create alerts for audit activity that requires timely review.
Useful alert conditions include:
-
A critical Salesforce configuration changes.
-
A high-risk security setting changes.
-
A Connected App or OAuth configuration changes.
-
A user, profile, or permission changes unexpectedly.
-
Multiple administrative changes occur within a short period.
-
A change occurs outside an approved maintenance window.
-
A new performance or error regression follows a configuration change.
-
An unauthorized or unexpected administrator performs a change.
Alert recipients may include:
-
Salesforce administrators
-
Security teams
-
Application owners
-
Operations teams
-
Change-management teams
Avoid generating an alert for every routine change. Categorize and prioritize changes according to their operational and security significance.
📋 Validate Audit Monitoring
After the first scheduled execution, verify that:
-
Salesforce Audit Monitoris enabled. -
Its last execution completed successfully.
-
Its next execution matches the configured schedule.
-
Audit records appear in the Salesforce dashboard.
-
The correct organization and environment are assigned.
-
Timestamps and administrator identities are accurate.
-
Expected configuration changes are present.
-
Details are sufficient for investigation.
-
Alerts fire only for the intended conditions.
For controlled validation:
-
Make a harmless, approved configuration change in a non-production Salesforce environment.
-
Wait for the next monitor execution.
-
Confirm that the change appears in GermainUX.
-
Verify its user, timestamp, action, and organization.
-
Reverse the test change if appropriate.
❓ No Audit Data Appears
If the monitor runs but no audit records appear:
-
Confirm that the correct Salesforce organization is configured.
-
Verify the OAuth connection.
-
Confirm that the integration user can access Salesforce audit information.
-
Check that
Salesforce Audit Monitoris enabled. -
Review its last execution and next scheduled execution.
-
Confirm that the selected GermainUX Engine is running.
-
Check connectivity from the Engine to Salesforce.
-
Review Engine logs for authentication, authorization, API, and parsing errors.
-
Check Salesforce API usage and limits.
-
Confirm that audit records exist for the selected time range.
-
Verify dashboard filters, organization, environment, and timezone.
⏳ Audit Data Is Delayed
Audit Monitoring is scheduled rather than instantaneous.
If records arrive later than required:
-
Review the current Execution Schedule.
-
Confirm that recent executions completed successfully.
-
Reduce the interval if faster collection is operationally justified.
-
Review the effect on Salesforce API consumption.
-
Consider Real-Time Event Monitoring for use cases requiring immediate detection.
🔒 Security and Retention
Audit records can contain sensitive information about:
-
Administrators
-
Security configuration
-
Permissions
-
Connected Apps
-
Internal components
-
Integration endpoints
-
Organizational changes
Before production use:
-
Limit access to audit dashboards and records.
-
Use a dedicated Salesforce integration account.
-
Grant only required permissions.
-
Protect user and administrator identifiers.
-
Configure appropriate retention.
-
Align alerts with incident-response and change-management procedures.
-
Avoid exposing credentials, secrets, or OAuth tokens.
📚 Related Documentation
-
Other Analytics Features
-
Other Automation Features
ℹ️ Get Help
The Germain Team can help you set this up. Contact GermainUX Support.
Component: Engine, Mobile App, RUM Ext, RUM JS
Feature Availability: 2017.1 or later