Linux (RedHat, Suse) Monitoring
Features for Linux
Germain is configured to monitor the uptime and performance of Linux servers. To access this information, Germain utilizes either a Germain UX Engine(s) or Germain UX Agent(s) that establish an SSH connection to the monitored system at regular intervals and execute a series of commands. These commands help gather critical data for monitoring and analysis, including:
System Uptime
Monitor the duration of system uptime, which indicates the availability and stability of the Linux server.
CPU Usage
Monitor the CPU utilization of the server to assess the overall system load and identify any potential bottlenecks or high resource consumption.
Memory Usage
Monitor the memory usage of the server to ensure efficient utilization and identify any memory-related issues or constraints.
Disk Space
Monitor the available disk space on the server's storage devices to ensure sufficient space for application data and system operations.
Network Connectivity
Monitor the network connectivity of the server to ensure uninterrupted communication and identify any network-related issues or performance degradation.
System Processes
Monitor the running processes on the server to identify any anomalies, excessive resource consumption, or potential performance bottlenecks.
System Logs
Monitor the system logs for errors, warnings, and other relevant information that can help diagnose issues and ensure the smooth operation of the Linux server.
Service Status
Monitor the status of critical services running on the server to ensure their availability and identify any service-related issues or failures.
By monitoring these aspects of Linux servers, Germain provides valuable insights into the uptime, performance, and health of the Linux environment. This allows for proactive monitoring, timely issue detection, and efficient troubleshooting, ensuring optimal performance and stability of the Linux servers.
Configure
In order to access this information, a Germain UX Engine(s) or Germain UX Agent(s) establishes an SSH connection to the monitored system periodically and execute a series of commands:
Command |
|---|
/bin/cat /proc/meminfo |
sar –B 1 1 |
vmstat 1 2 |
vmstat 1 2 |
df –l |
iostat –d –x |
netstat –inet –na --tcp |
sar –n DEV 1 3 |
/proc/uptime |
ps –A |
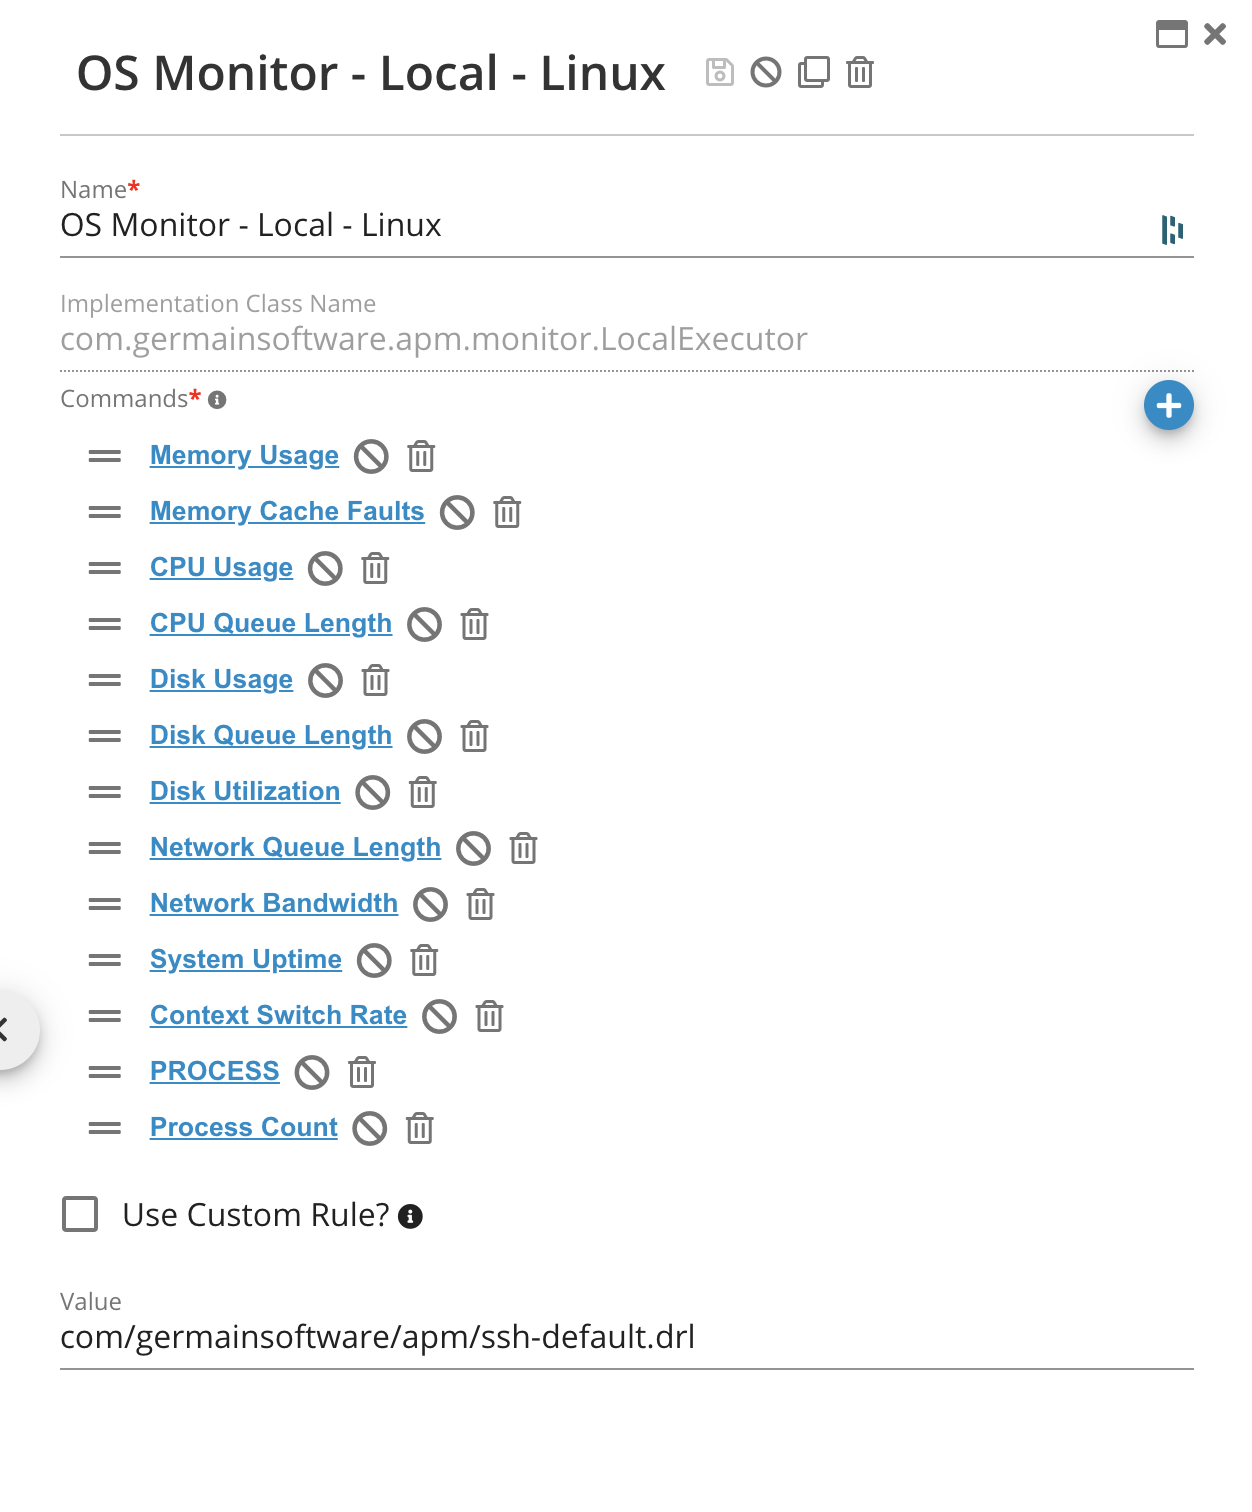
OS Monitor Local Linux - Germain UX
Each of these commands can be individually configured and also disabled, if for some reason it is undesirable to collect any one of the OS metrics.
Germain Workspace > Left Menu > Wizard > Monitor Server
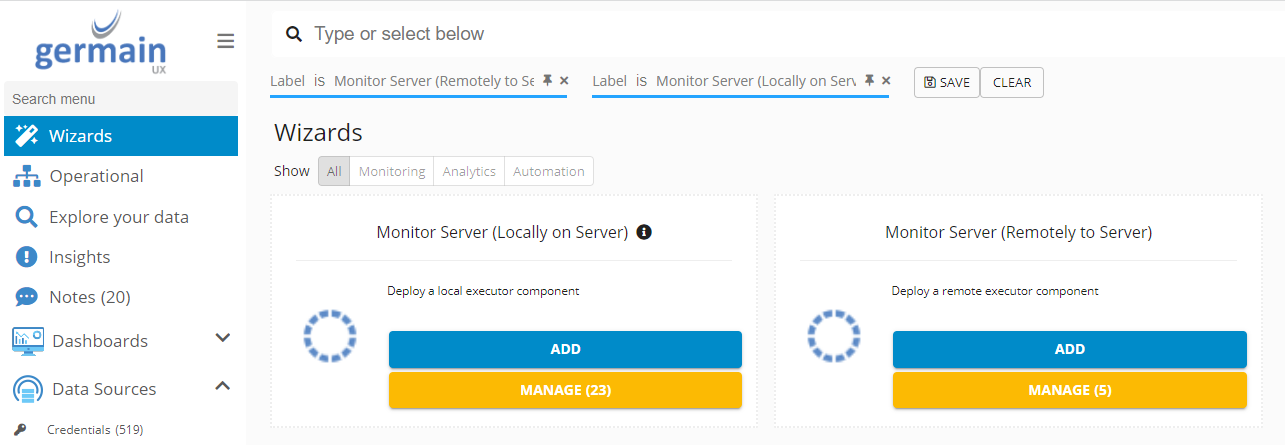
Monitor Server (Locally or Remotely) - Germain UX
Local Monitoring
1. Select Component Type from the drop-down list
2. Search for OS Monitor - Local. Choose appropriate component based on OS type (Linux, Windows)
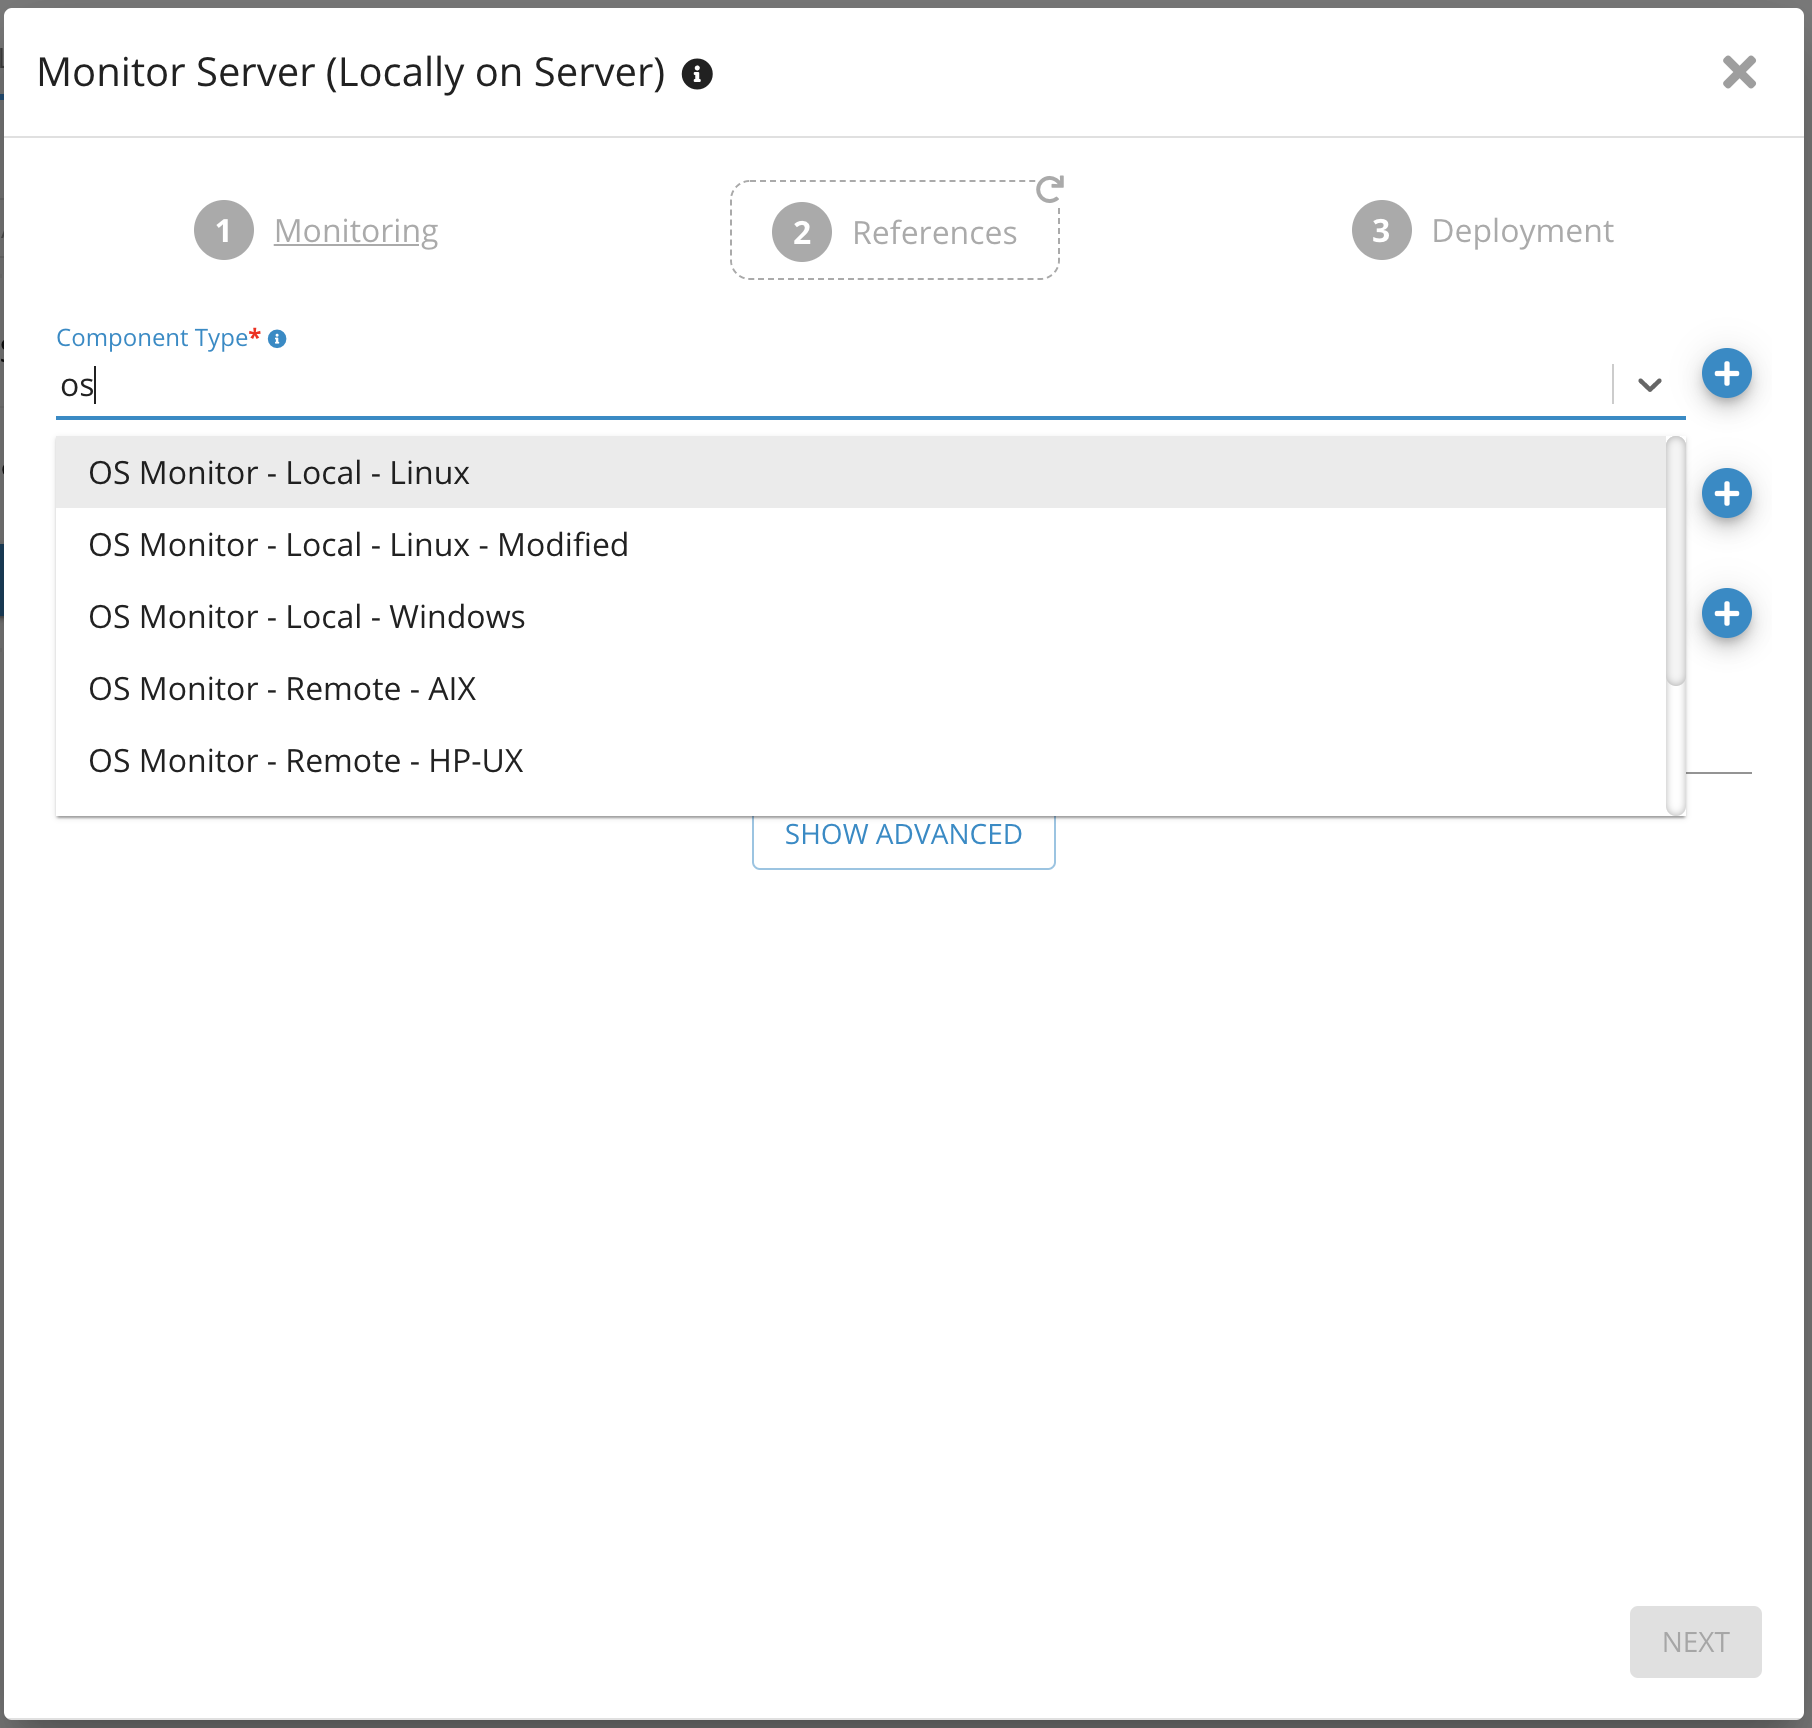
Monitor Server (locally) - Germain UX
3. Select Monitored server from the drop-down list (This is the server that will be monitored)
4. Choose Operating System from Monitored Application
5. Click Next
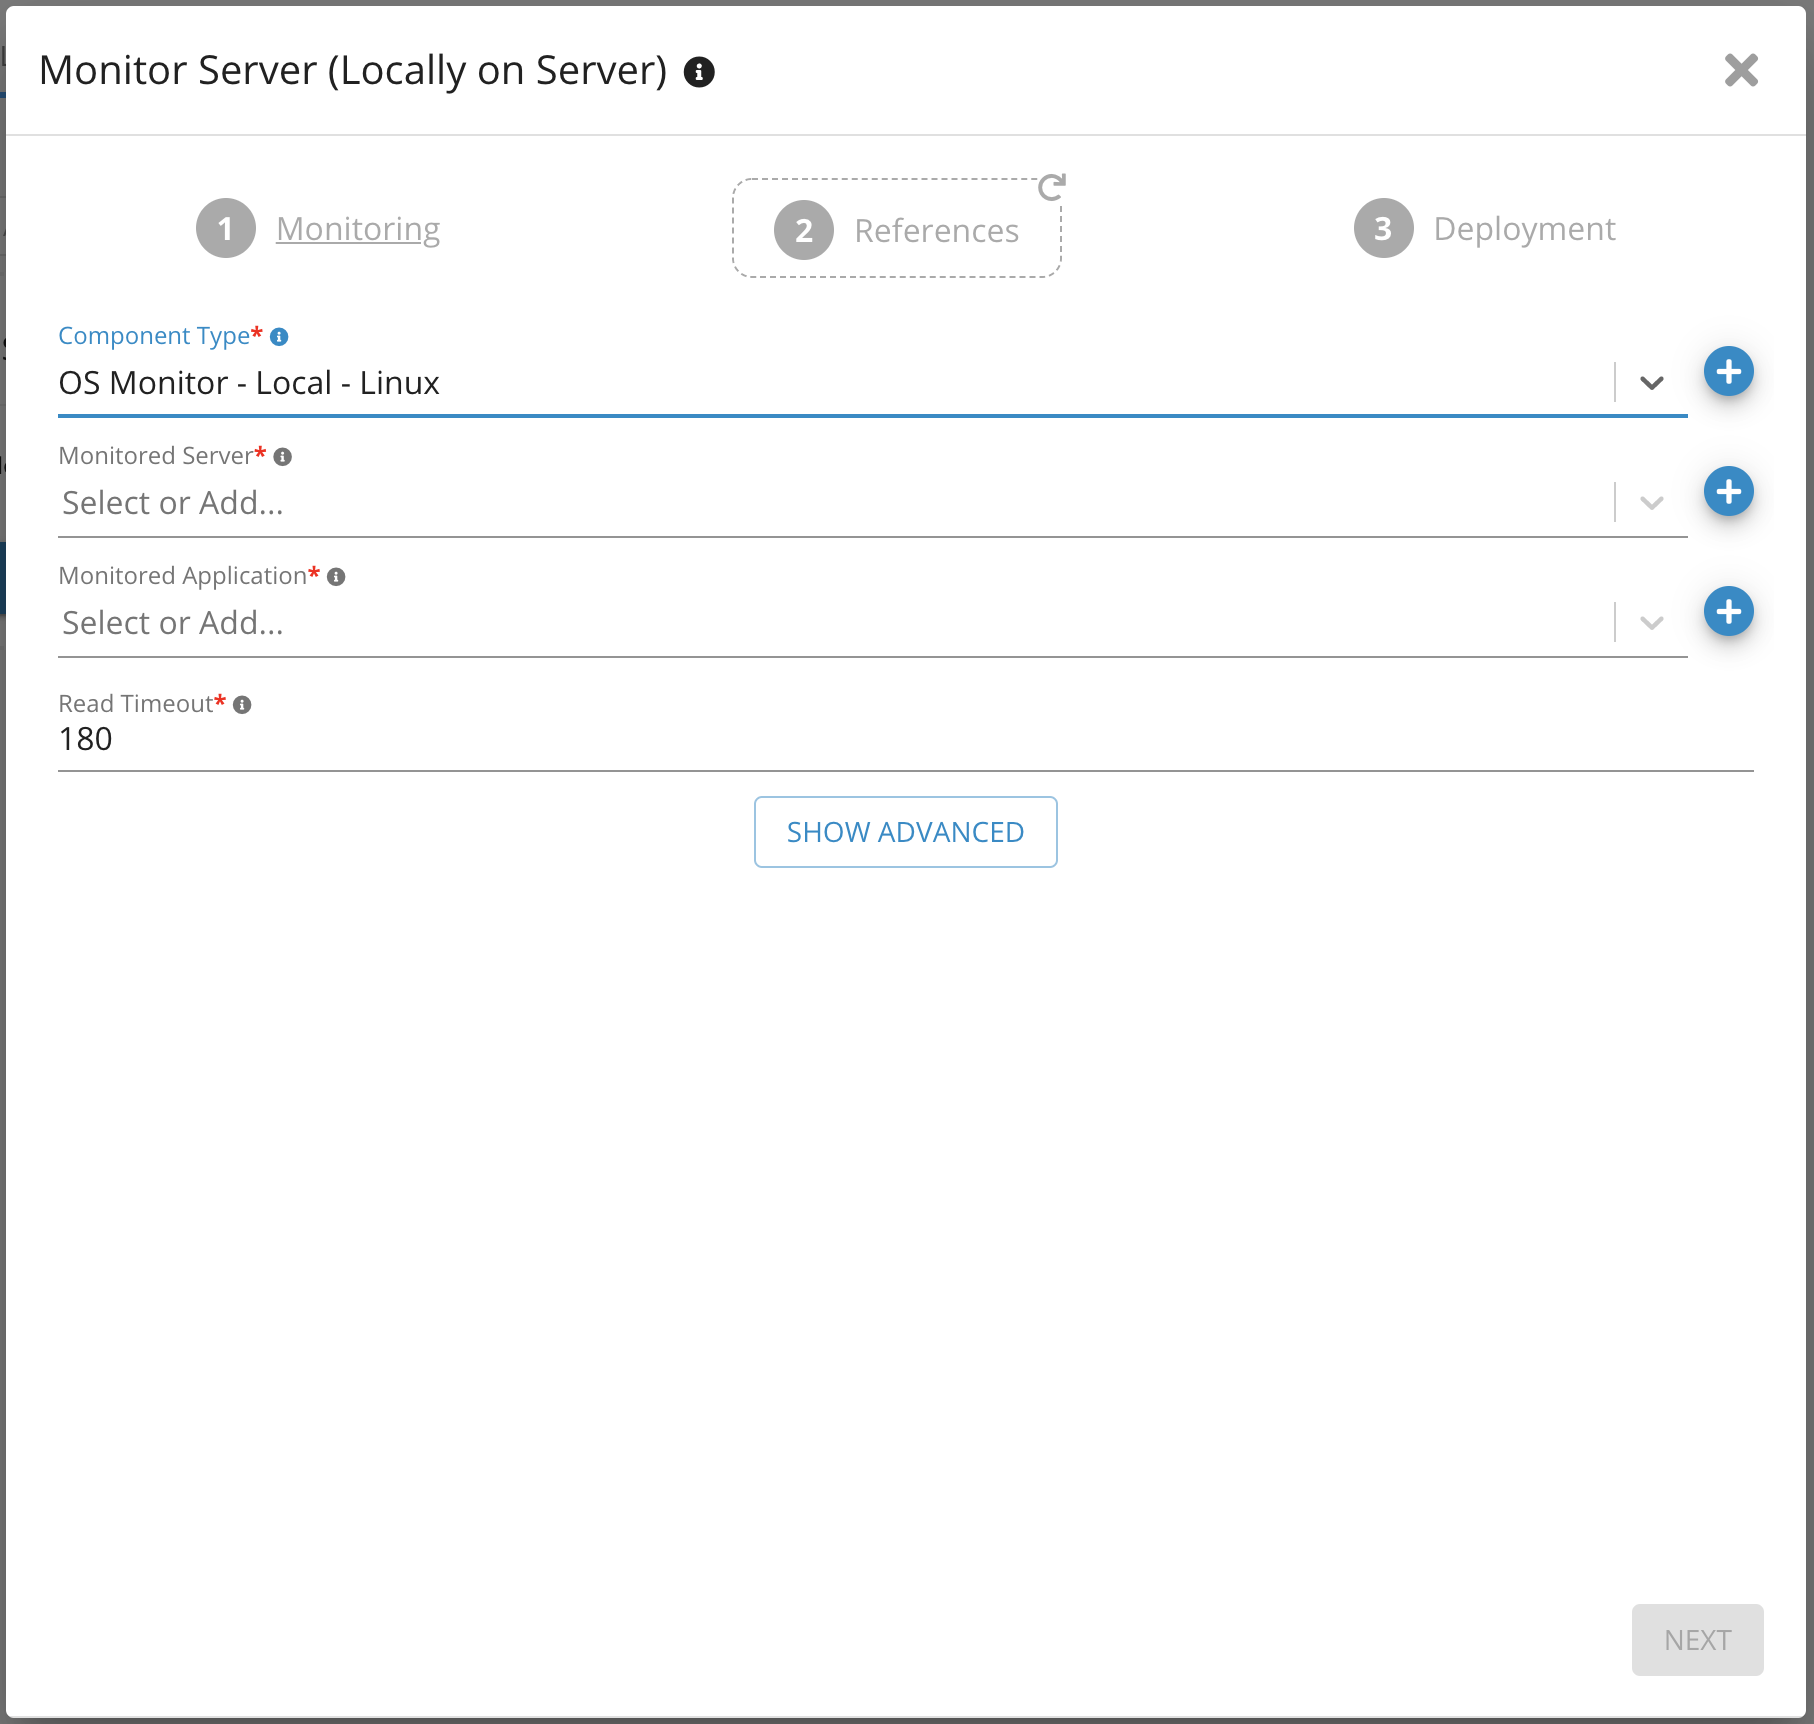
Parameters on Monitor Server (locally) - Germain UX
6. Click Skip
7. Provide a name for the monitor
8. Select Monitoring Node and engine from the drop-down list
9. Set schedule for how frequently the component should run
10. Click finish
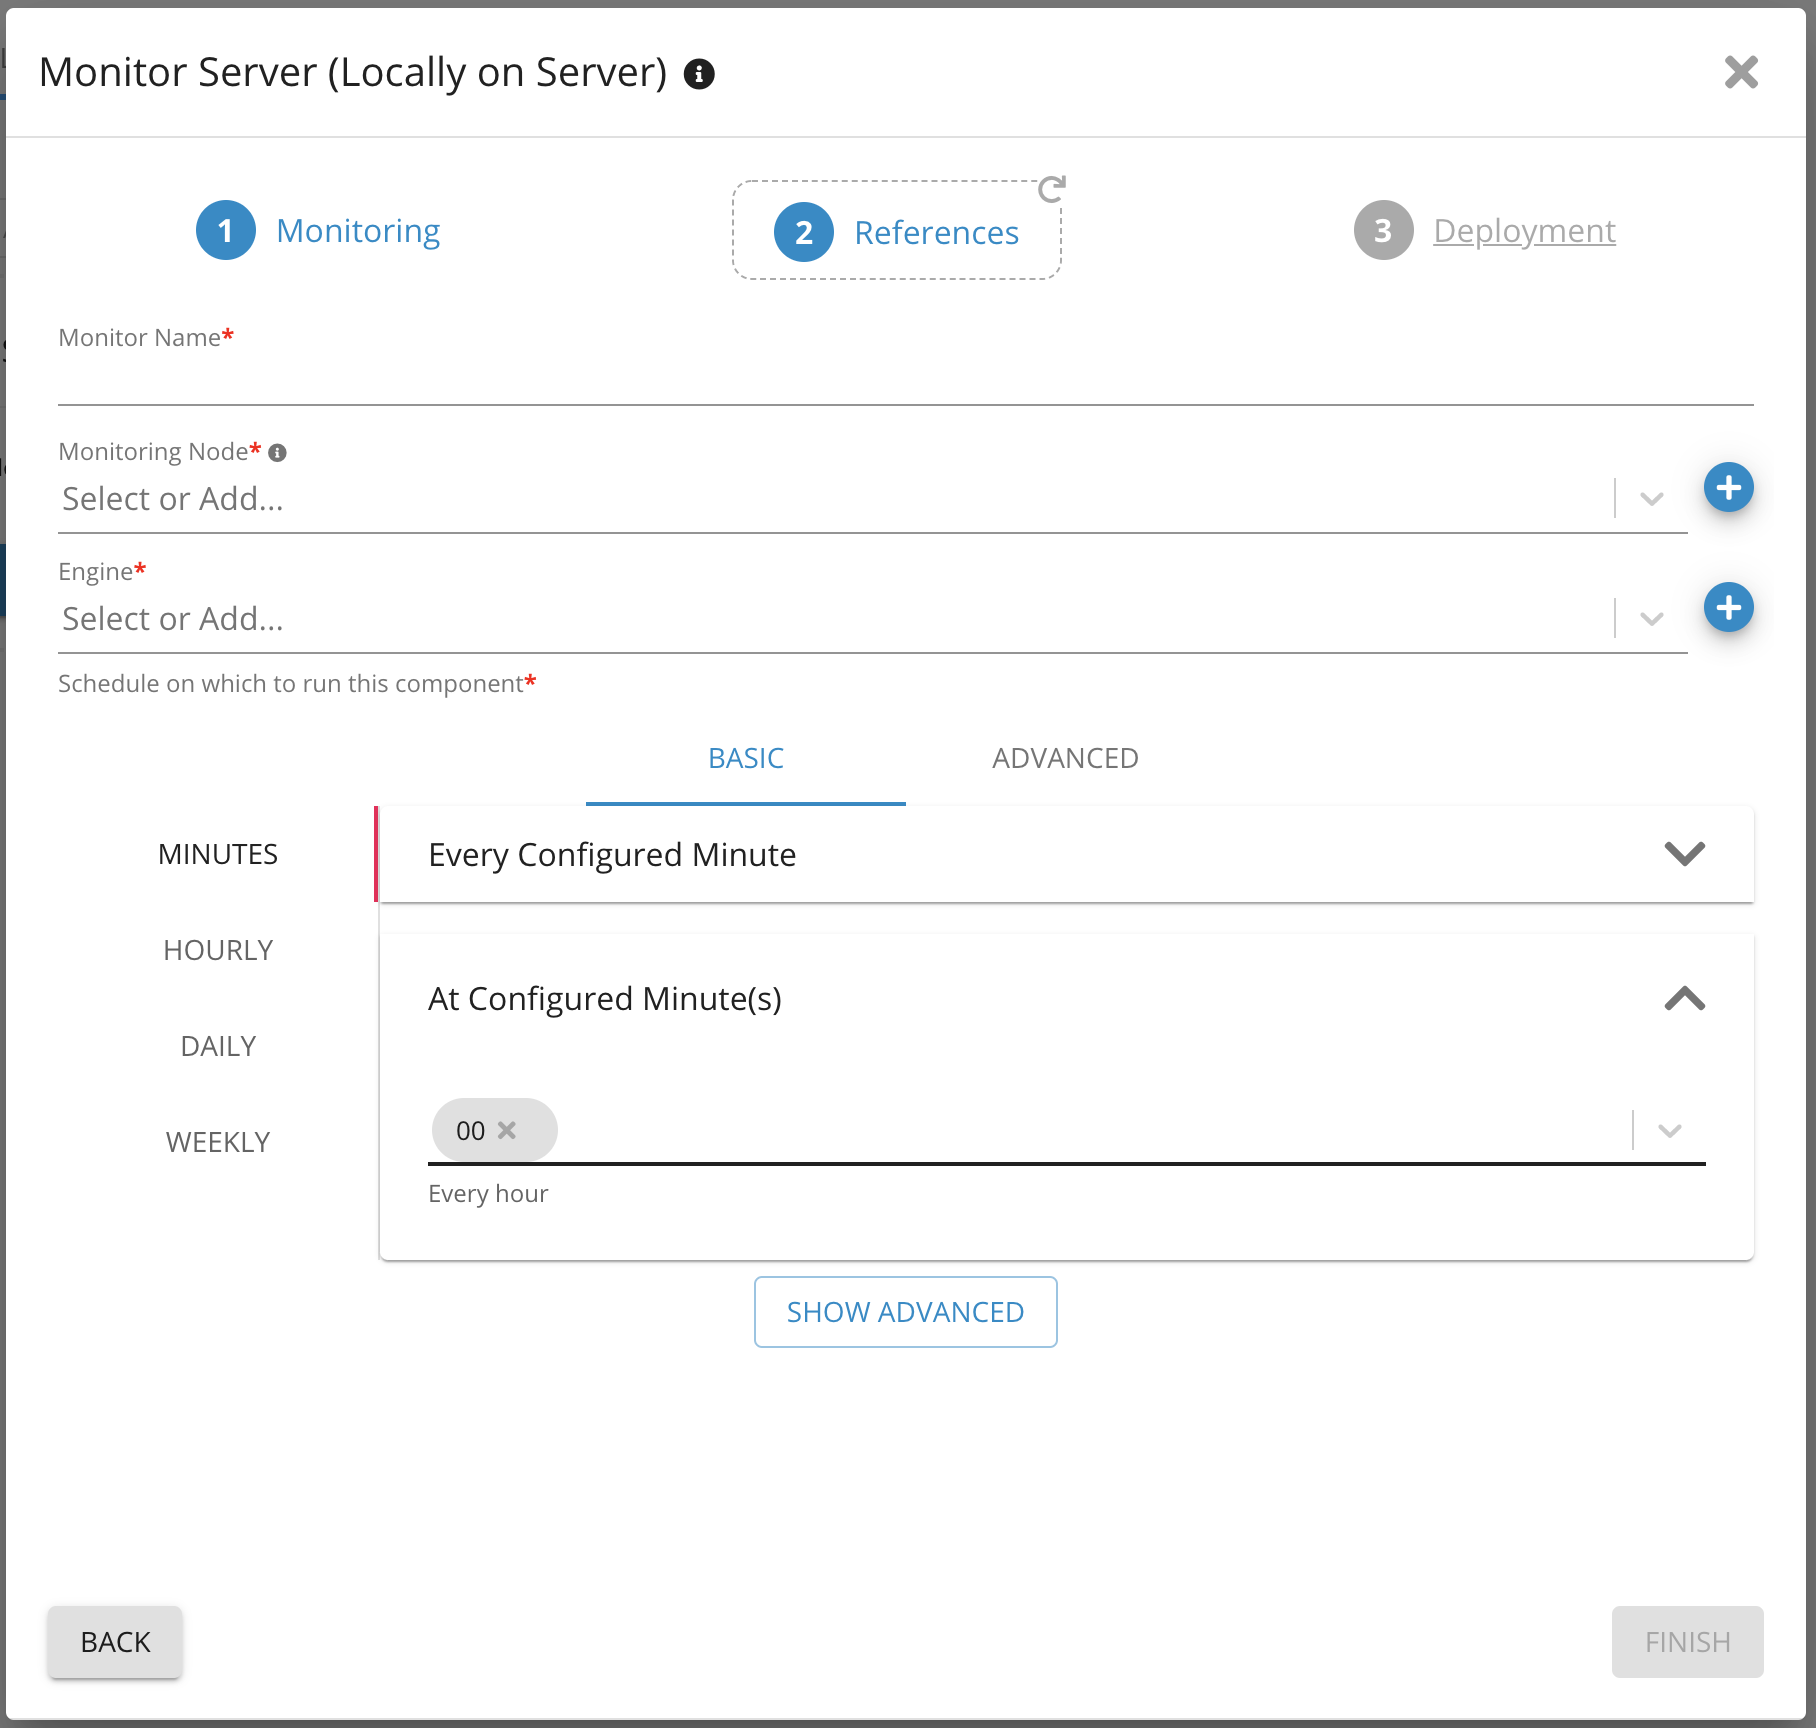
Parameters on Monitor Server (locally) 2 - Germain UX
Remote Monitoring
1. Select Component Type from the drop-down list
2. Search for OS Monitor - Remote. Choose appropriate component based on OS type (Linux, Windows)
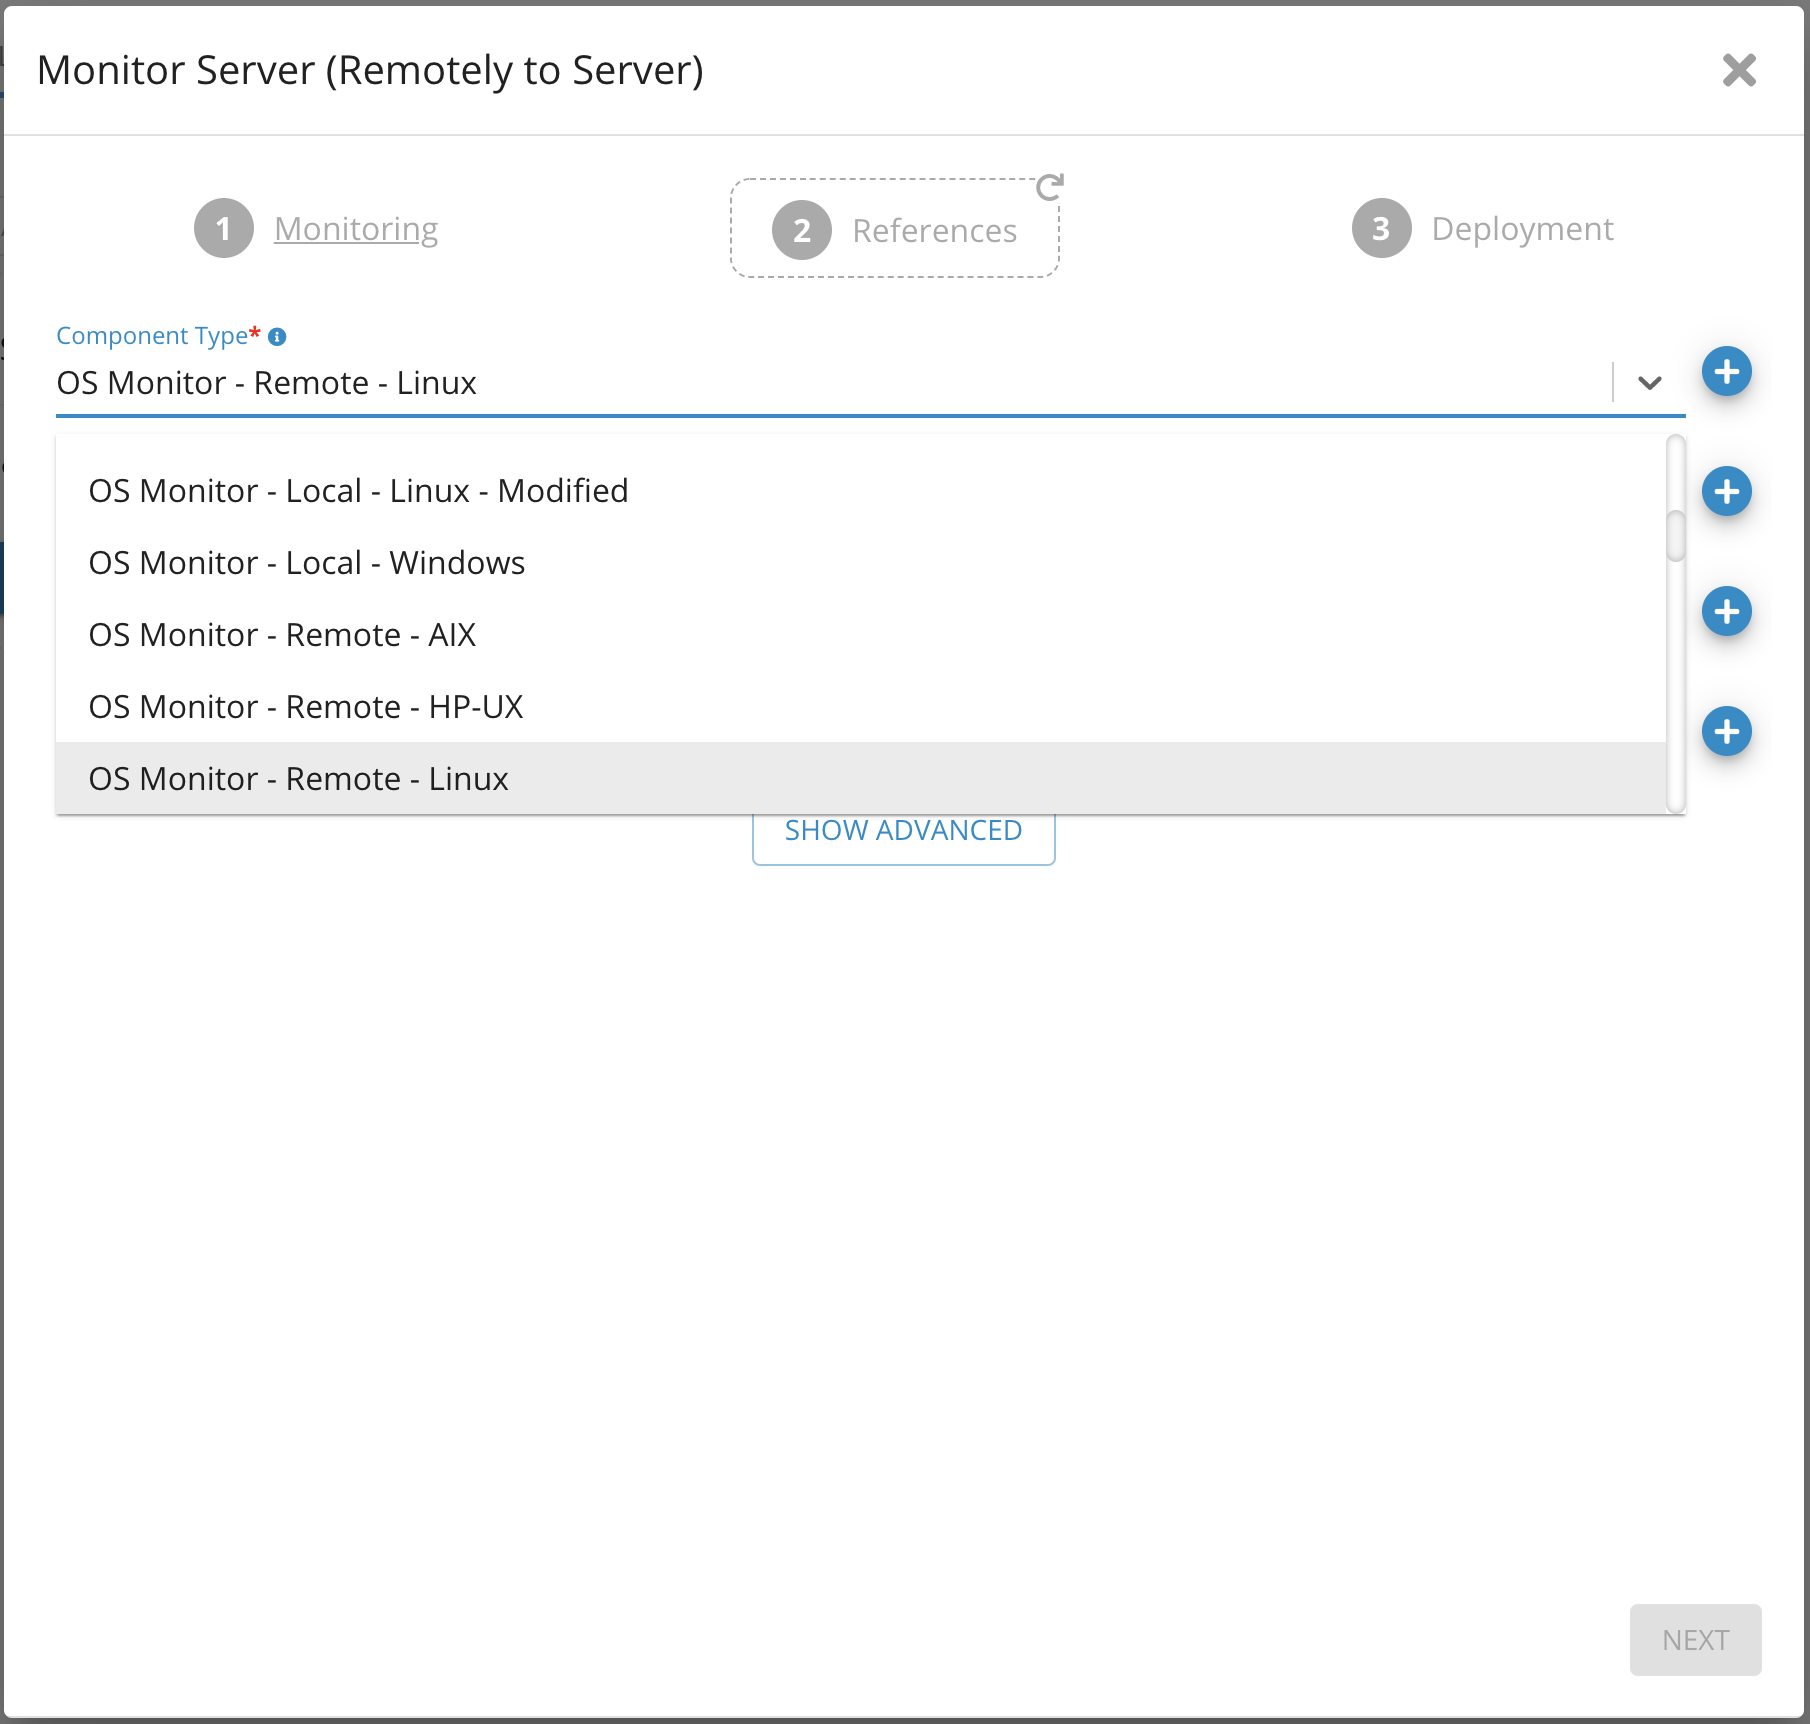
Parameters on Monitor Server (Remote) - Germain UX
3. Select Monitored server from the drop-down list (This is the server that will be monitored)
4. Choose Operating System from Monitored Application
5. Provide SSH credentials
6. Click Next
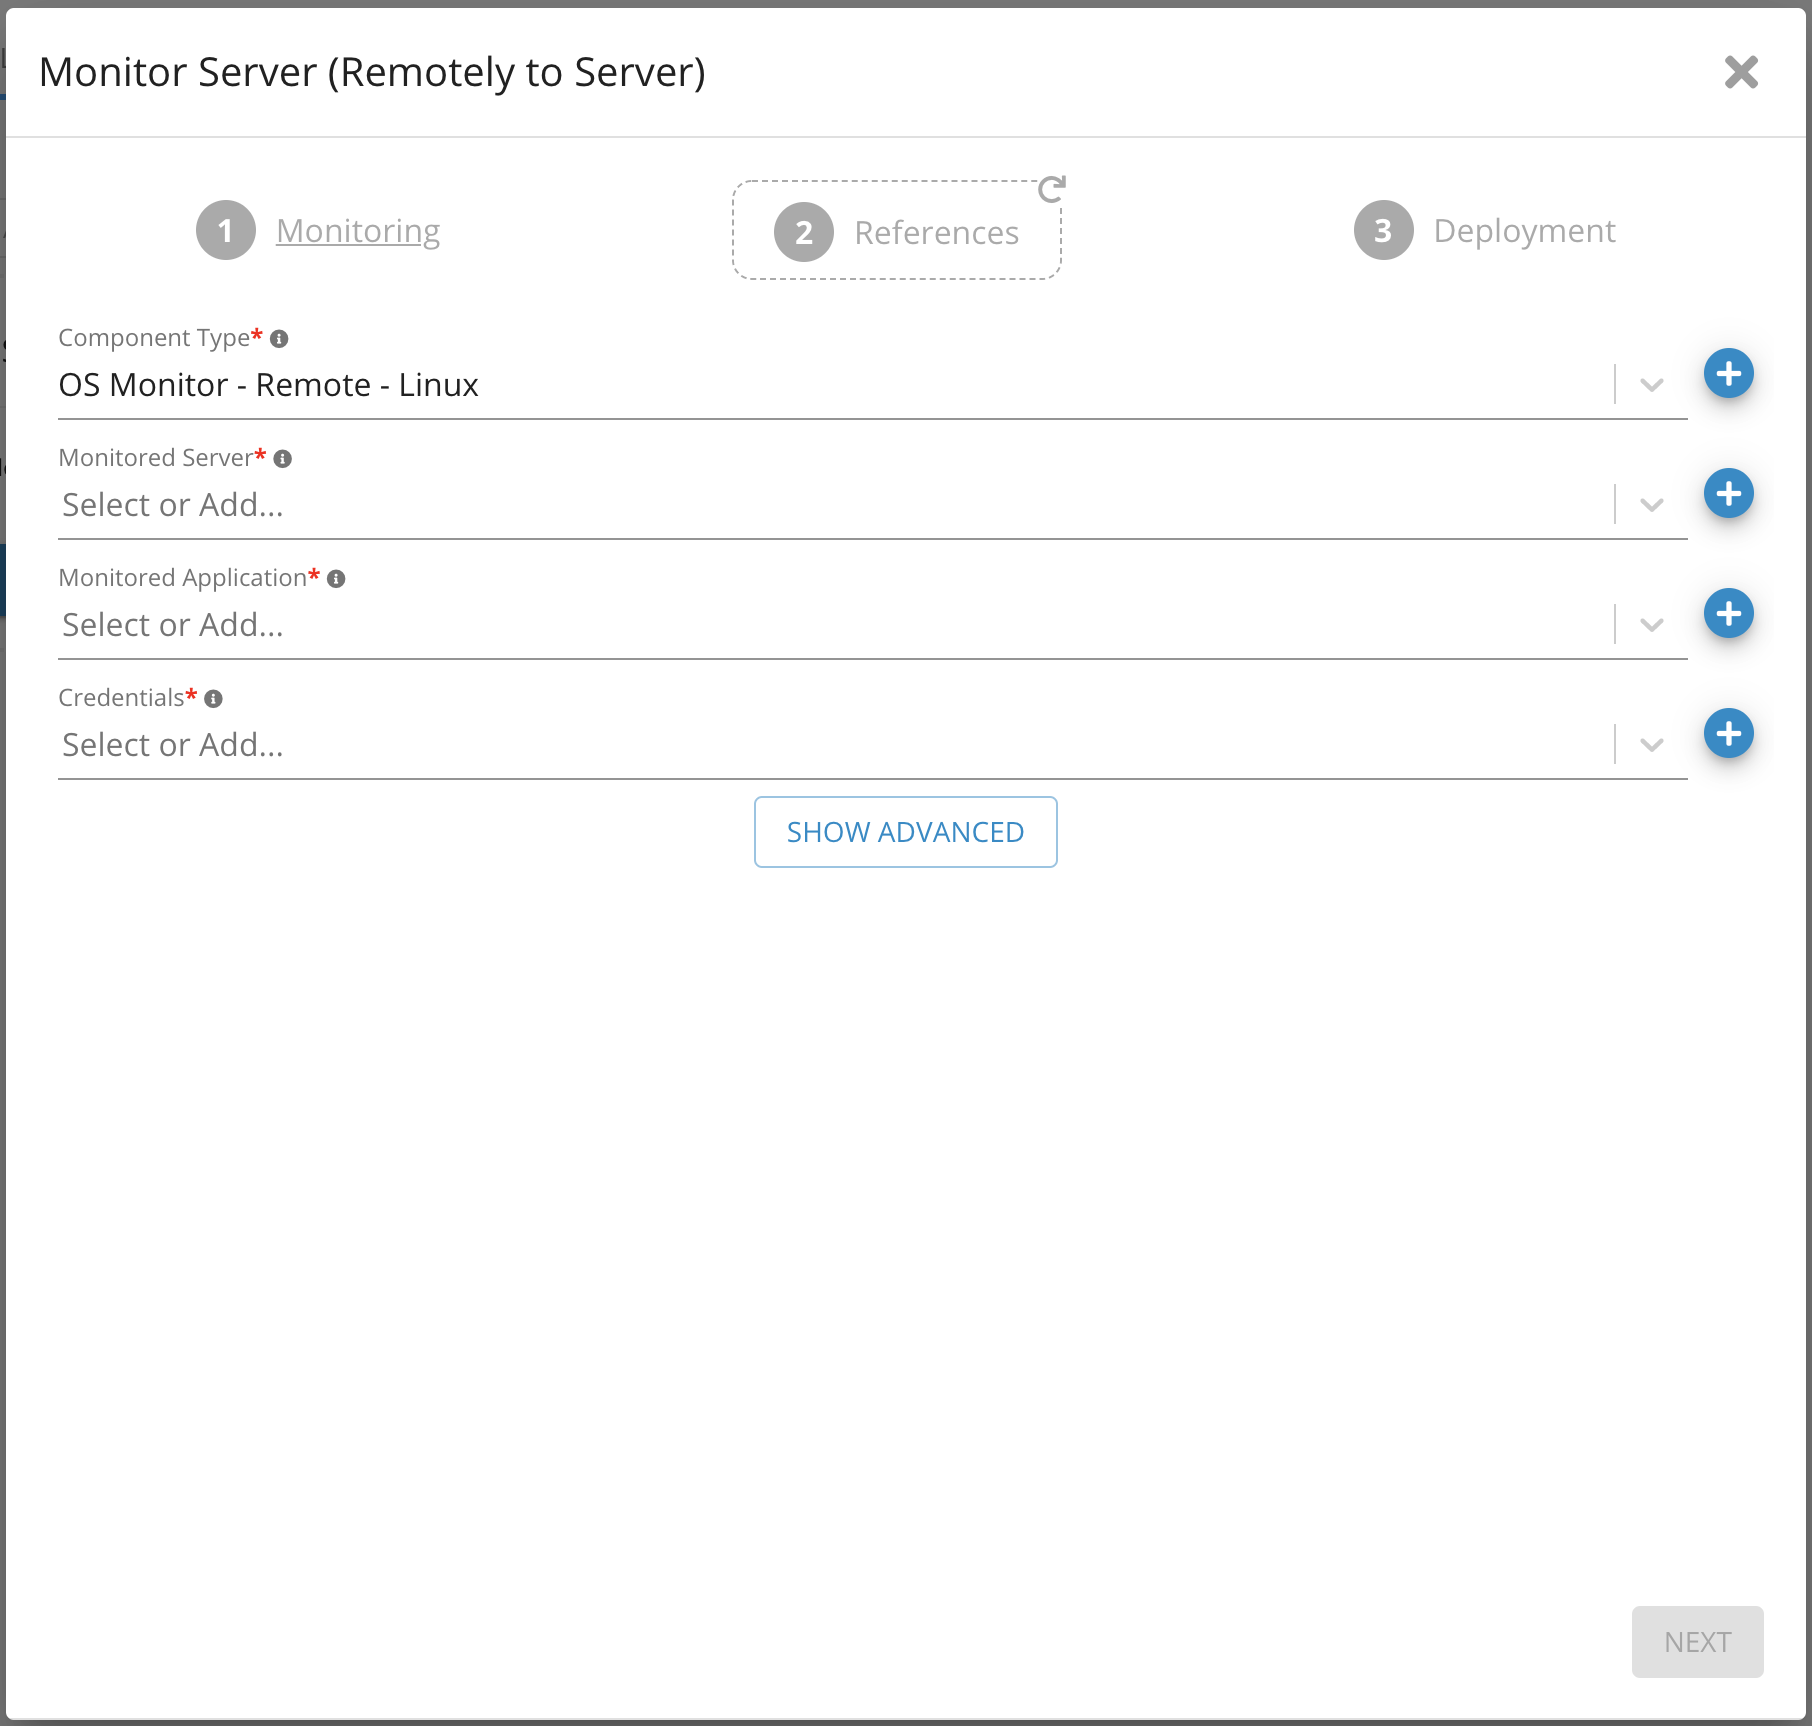
Parameters on Monitor Server (Remote) 2 - Germain UX
7. Click Skip
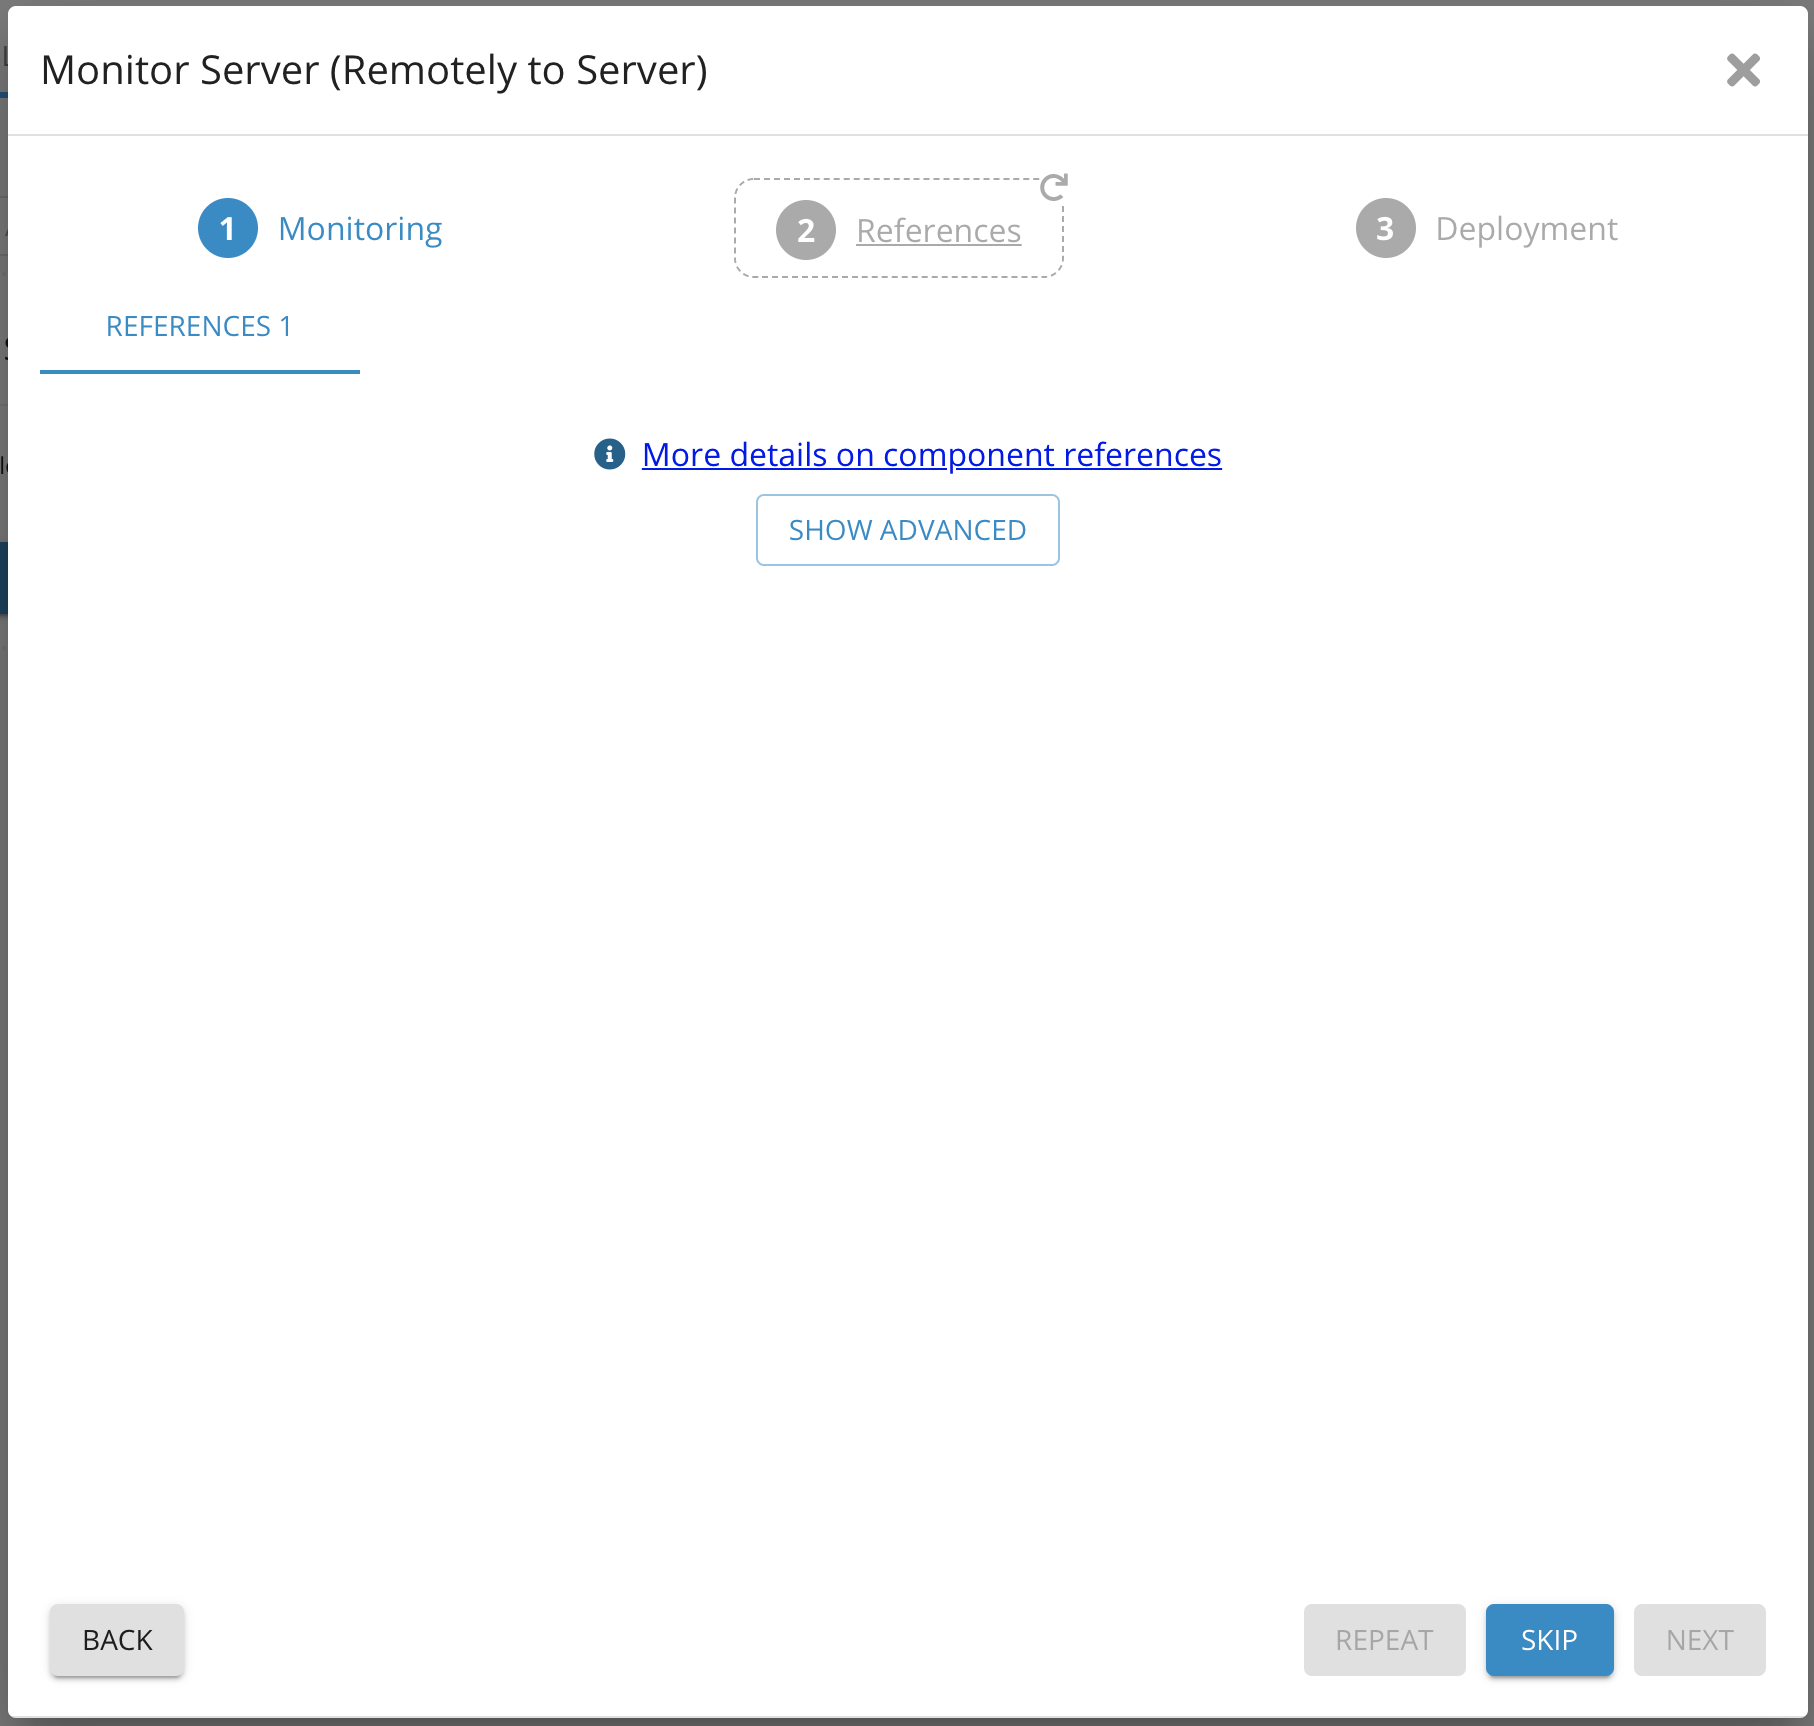
Parameters on Monitor Server (Remote) 3 - Germain UX
8. Provide a name for the monitor in Monitor Name
9. Select Monitoring Node and engine from the drop-down list
10. Set a schedule for how frequently the component should run
11. Click finish
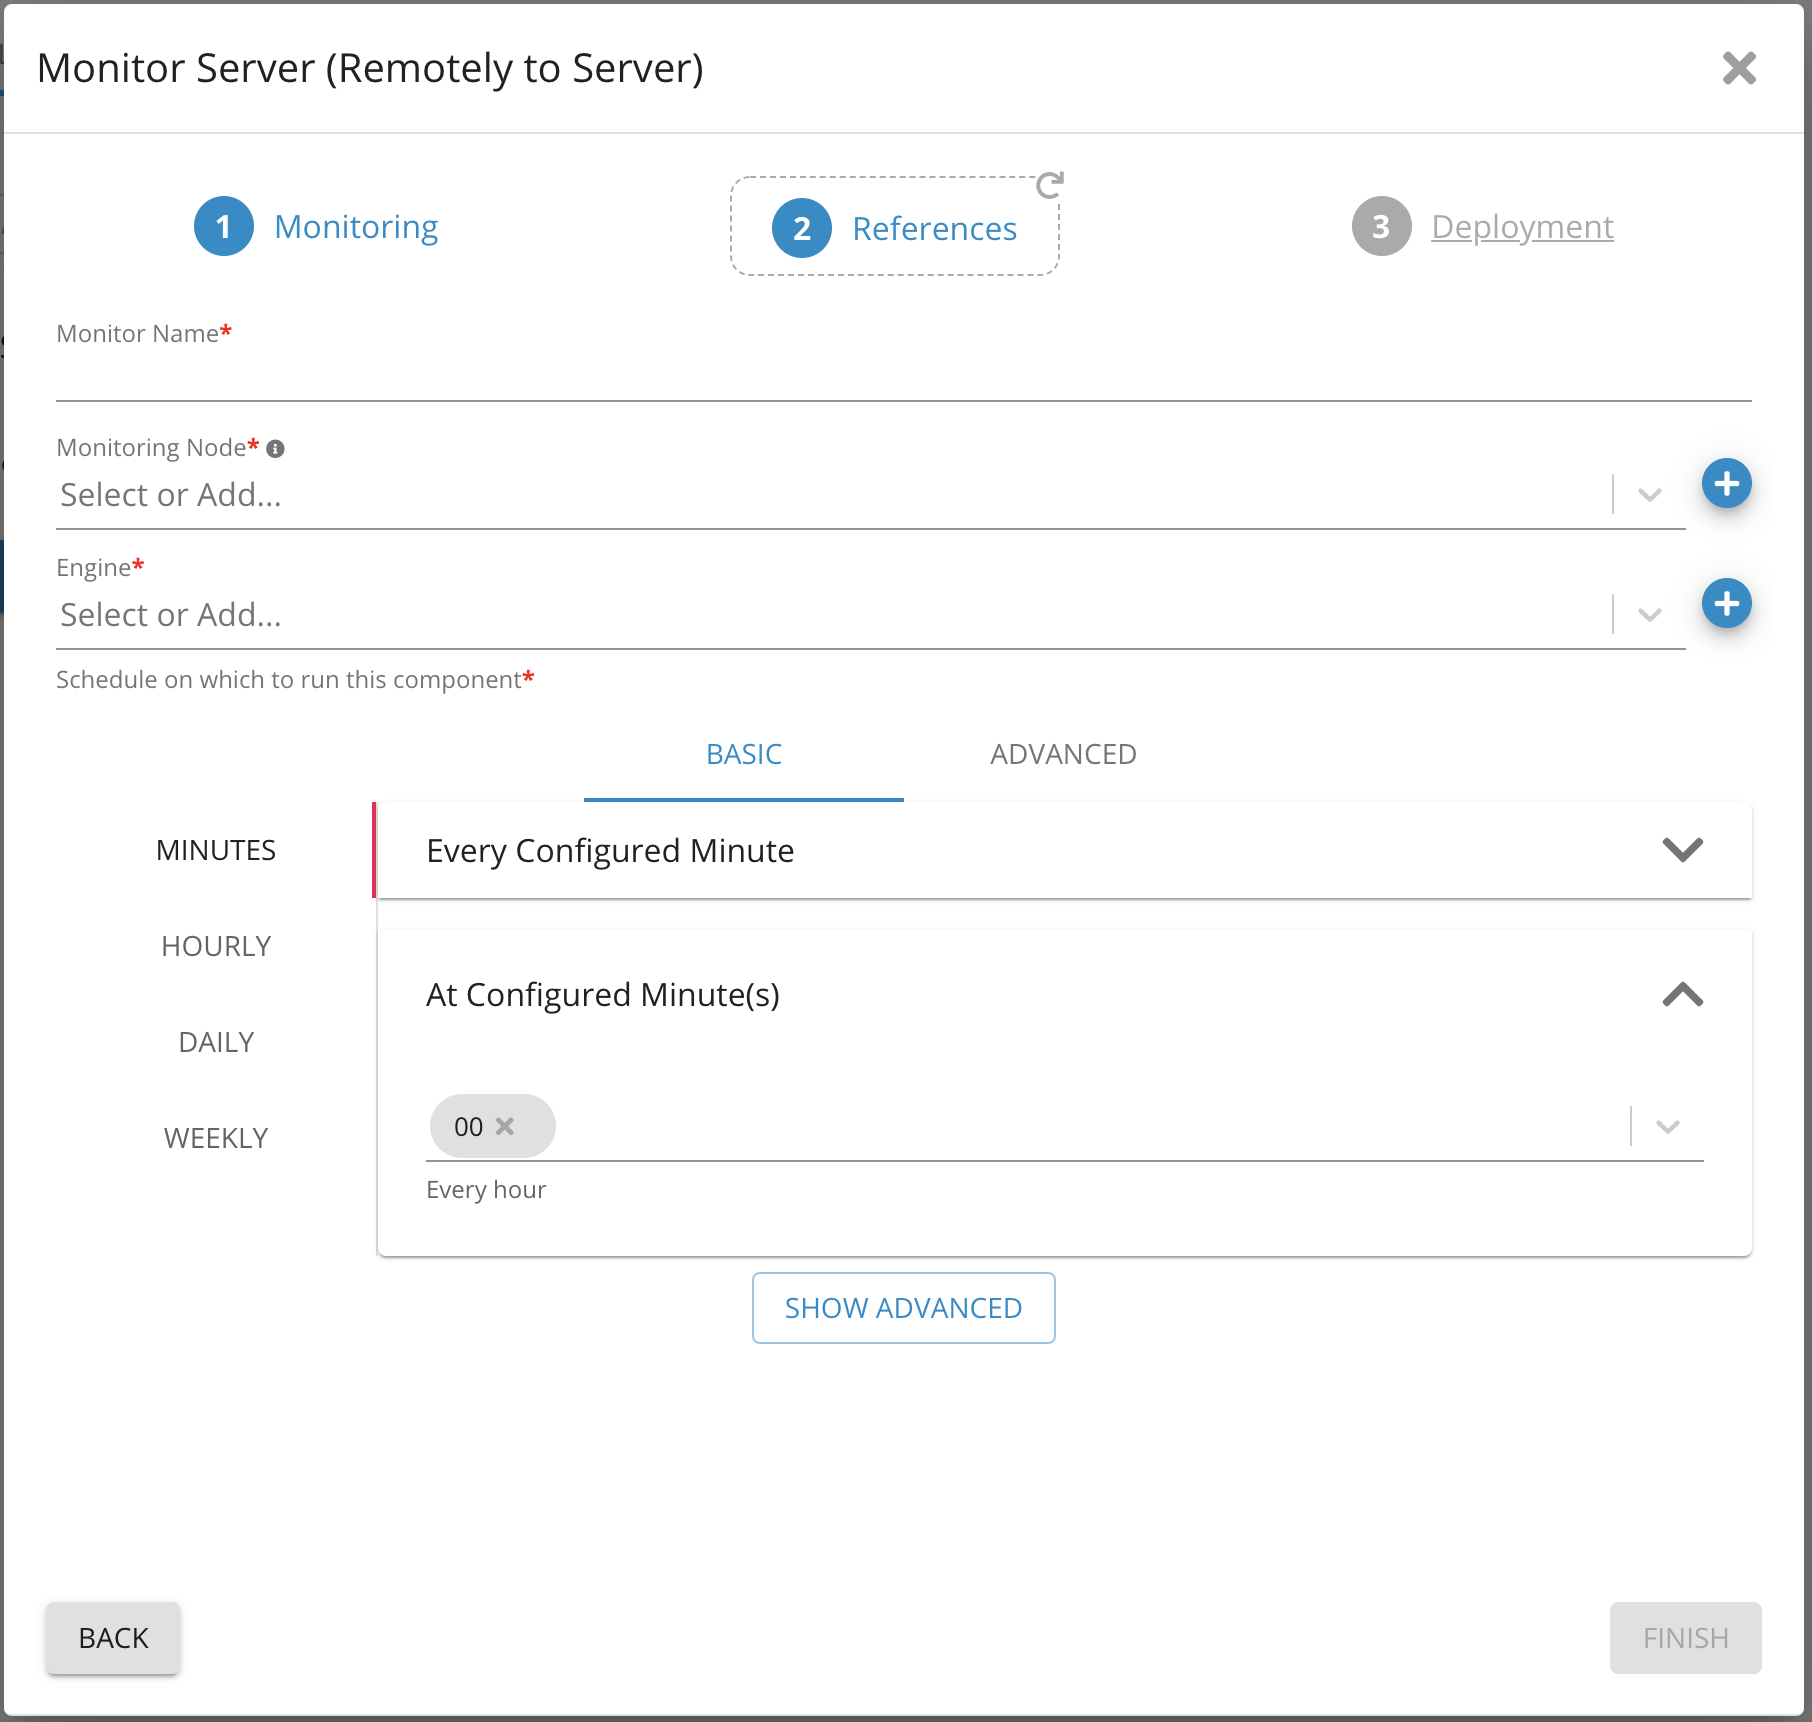
Parameters on Monitor Server (Remote) 4 - Germain UX
For more detailed information, please reach out to us. We will provide you with further guidance and assistance tailored to your needs.
Component: Engine
Feature Availability: 8.6.0 or later
