

Monitoring And Analytics Features
Maintenance Features
Marketplace
Security Fixes
Monitoring and Analytics Features
Browser freeze (or javascript long task)
Description This enhancement aims to make [Javascript Long Tasks] visible on [Replay of User Session] dashboard, on the GermainUX workspace. And it is now called [Browser Freeze] The ability to detect Long Tasks has existed in GermainUX for several years now, yet most did not know what a “Javascript Long Task” really was. What the Chrome team says about Javascript Long Task: https://web.dev/long-tasks-devtools/.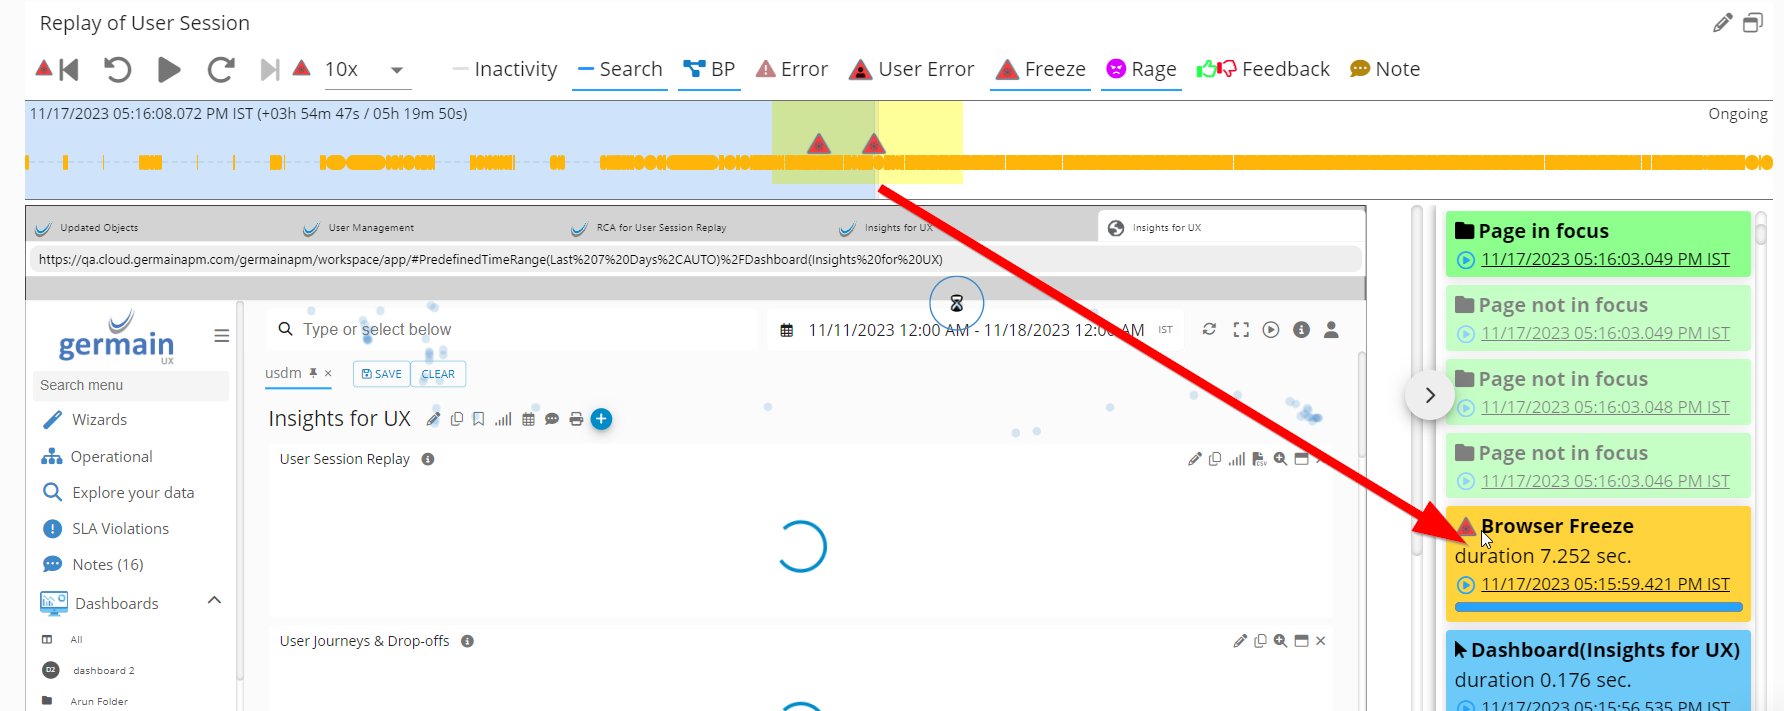
Browser Freeze detected and displayed on GermainUX Session Replay
- More details on how to enable Javascript Long Task / Browser Freeze.
Down and up trends finding made easier
Issue Comparing time periods in the General Health portlet (Trend graph) was initially challenging, and other portlets lacked insights into trends. Solution/Enhancement All portlets and dashboards now feature automatic relative red and green percentages. This makes it convenient to identify increases or decreases in any KPI relative to different time ranges. How to Use- Select a time range on any dashboard.
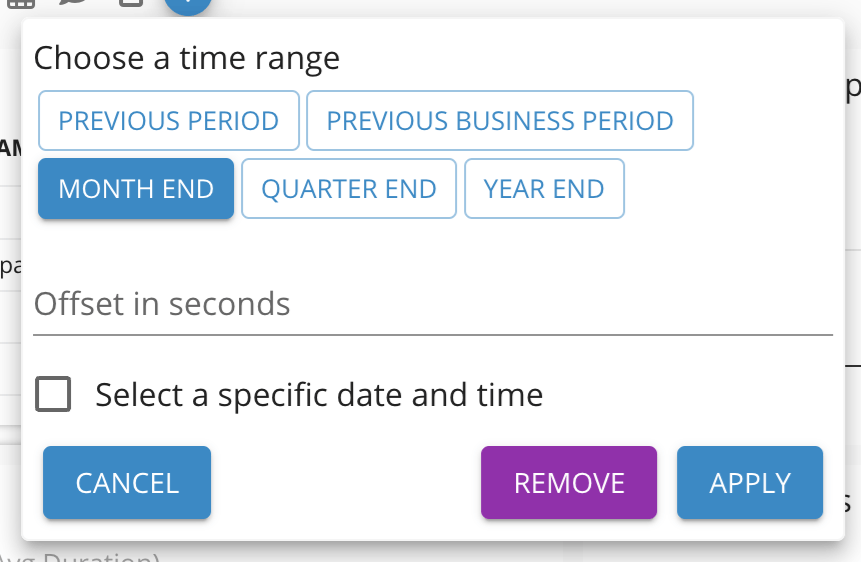
Choose a Period to Compare with - GermainUX
- Increases and decreases will automatically display relative to the selected time range.
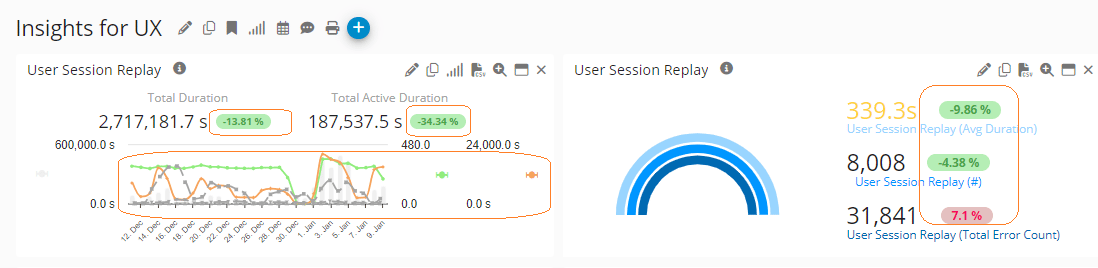
Up and down trends highlights - GermainUX
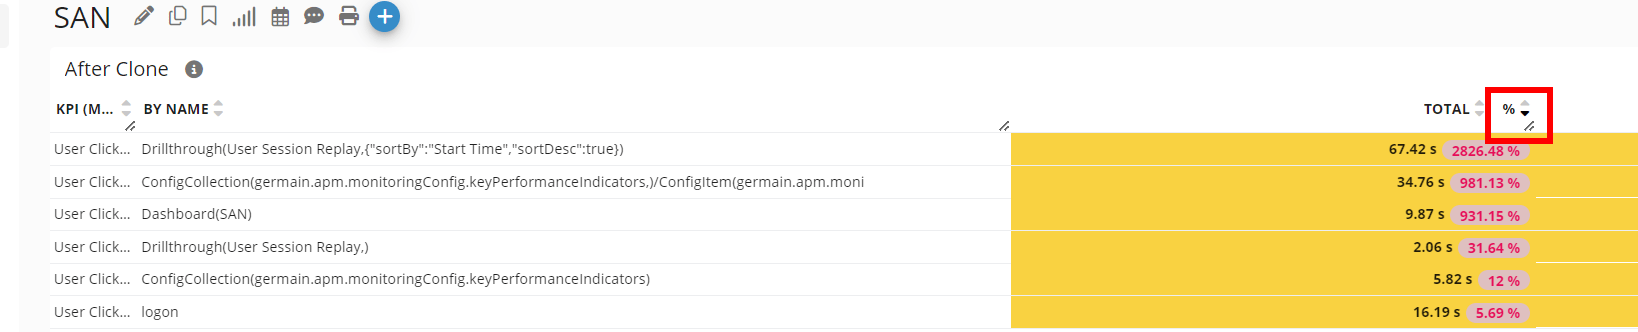
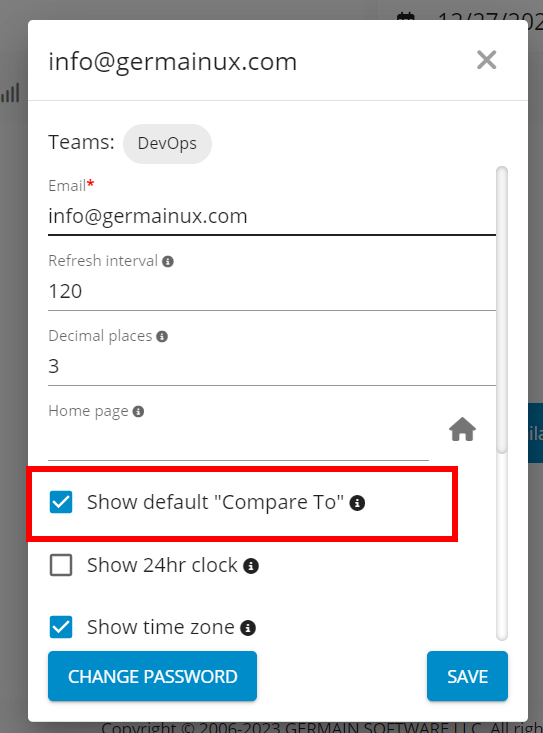
Show Default Compare To on User Setting - GermainUX
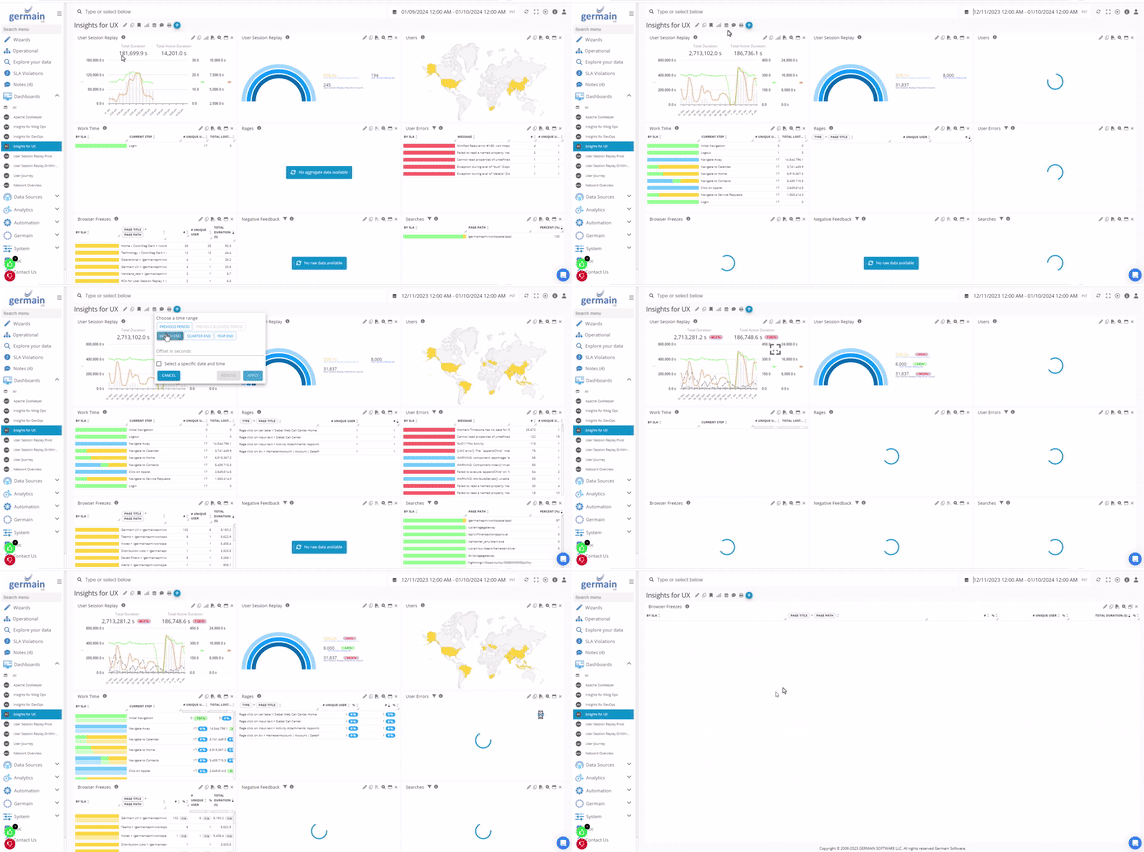
Example of Comparing 2 time periods - GermainUX
Filters
Problem Previously, our client grappled with efficiently analyzing hundreds of error types on a portlet—some benign, others critical. The inability to exclude non-critical errors further complicated the process. Solution/Feature Introducing our new filtering capability! Quickly apply filters like ‘is,’ ‘is not,’ ‘is like,’ ‘is not like,’ ‘contains,‘or’does not contain’ for a specific string, such as ‘Error%.’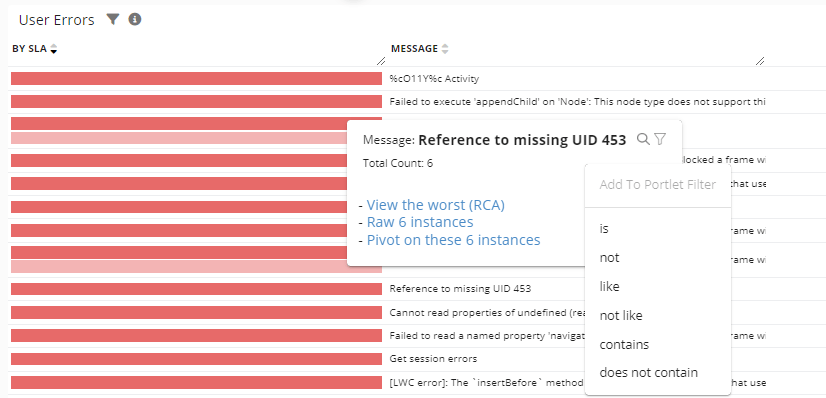
Filter on GermainUX
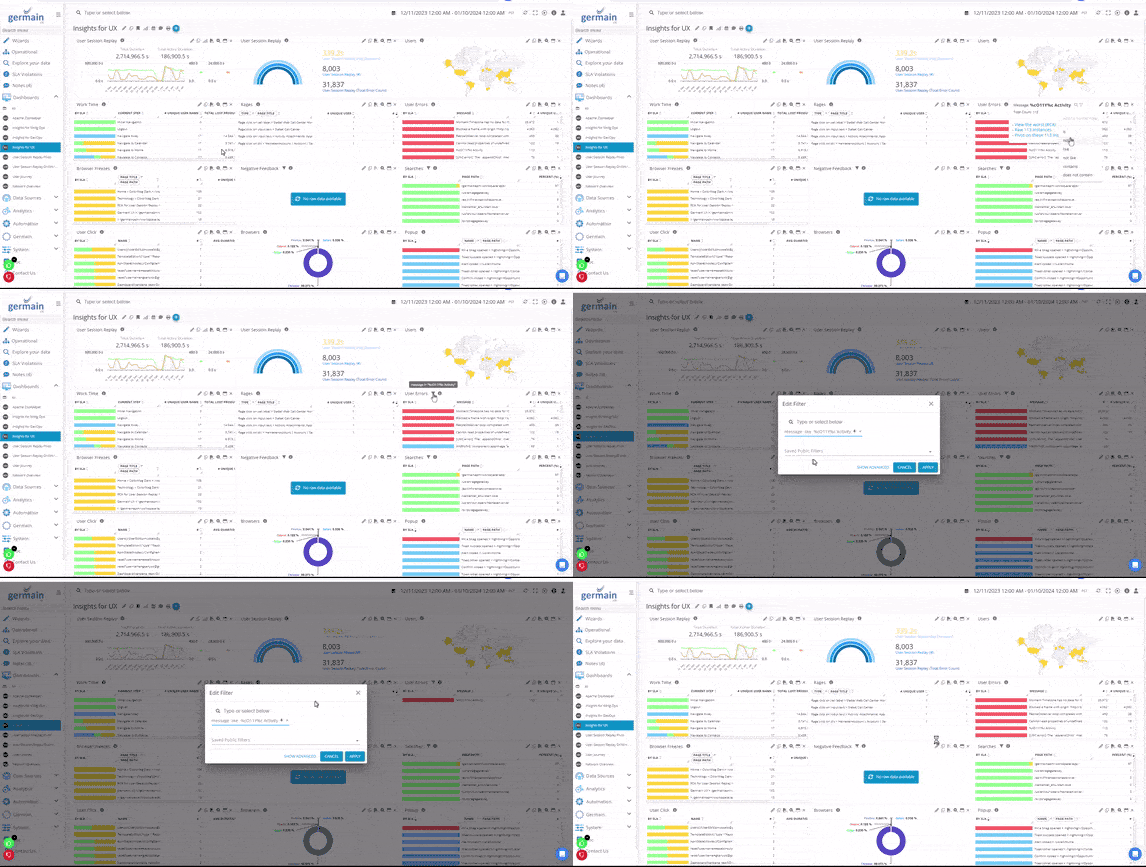
Filtering Errors - GermainUX
Graph in report
Description Reports automatically generated by GermainUX can now include different types of graphs, which are customizable. More details on reports. More details on the template editor.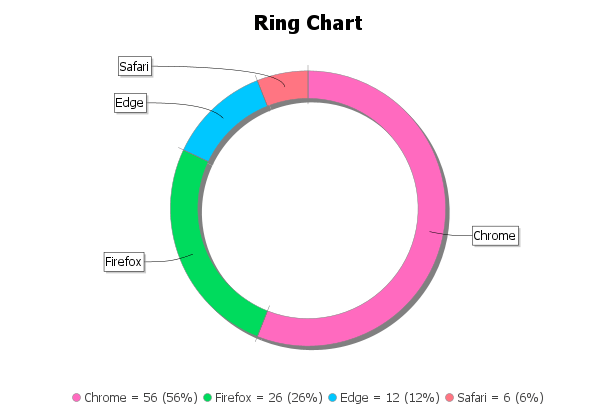
Ring Chart in Report automated by GermainUX
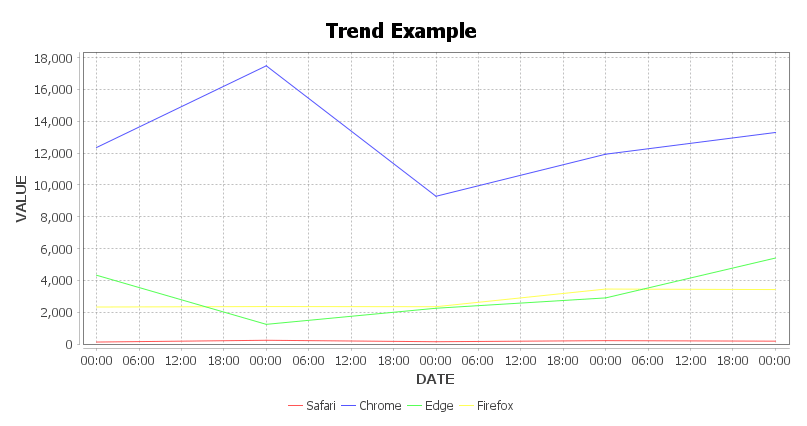
Trend Graph in Report automated by GermainUX
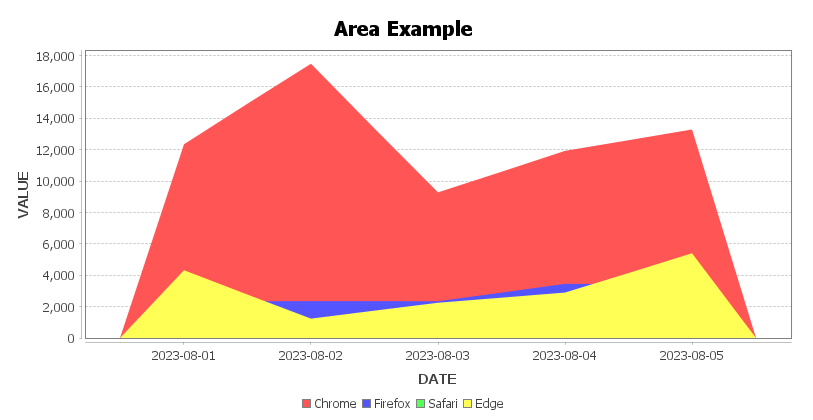
Area Graph in Report automated by GermainUX
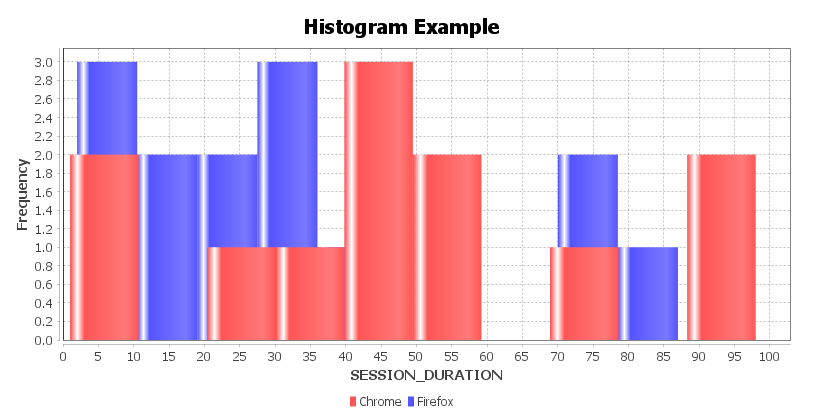
Histogram in Report automated by GermainUX
Nested CORS iframes monitoring and session replay
Description This enhancement enables the monitoring of deeply nested CORS/3rd-party iframes through the latest GermainUX - RUM Extension or RUM JS.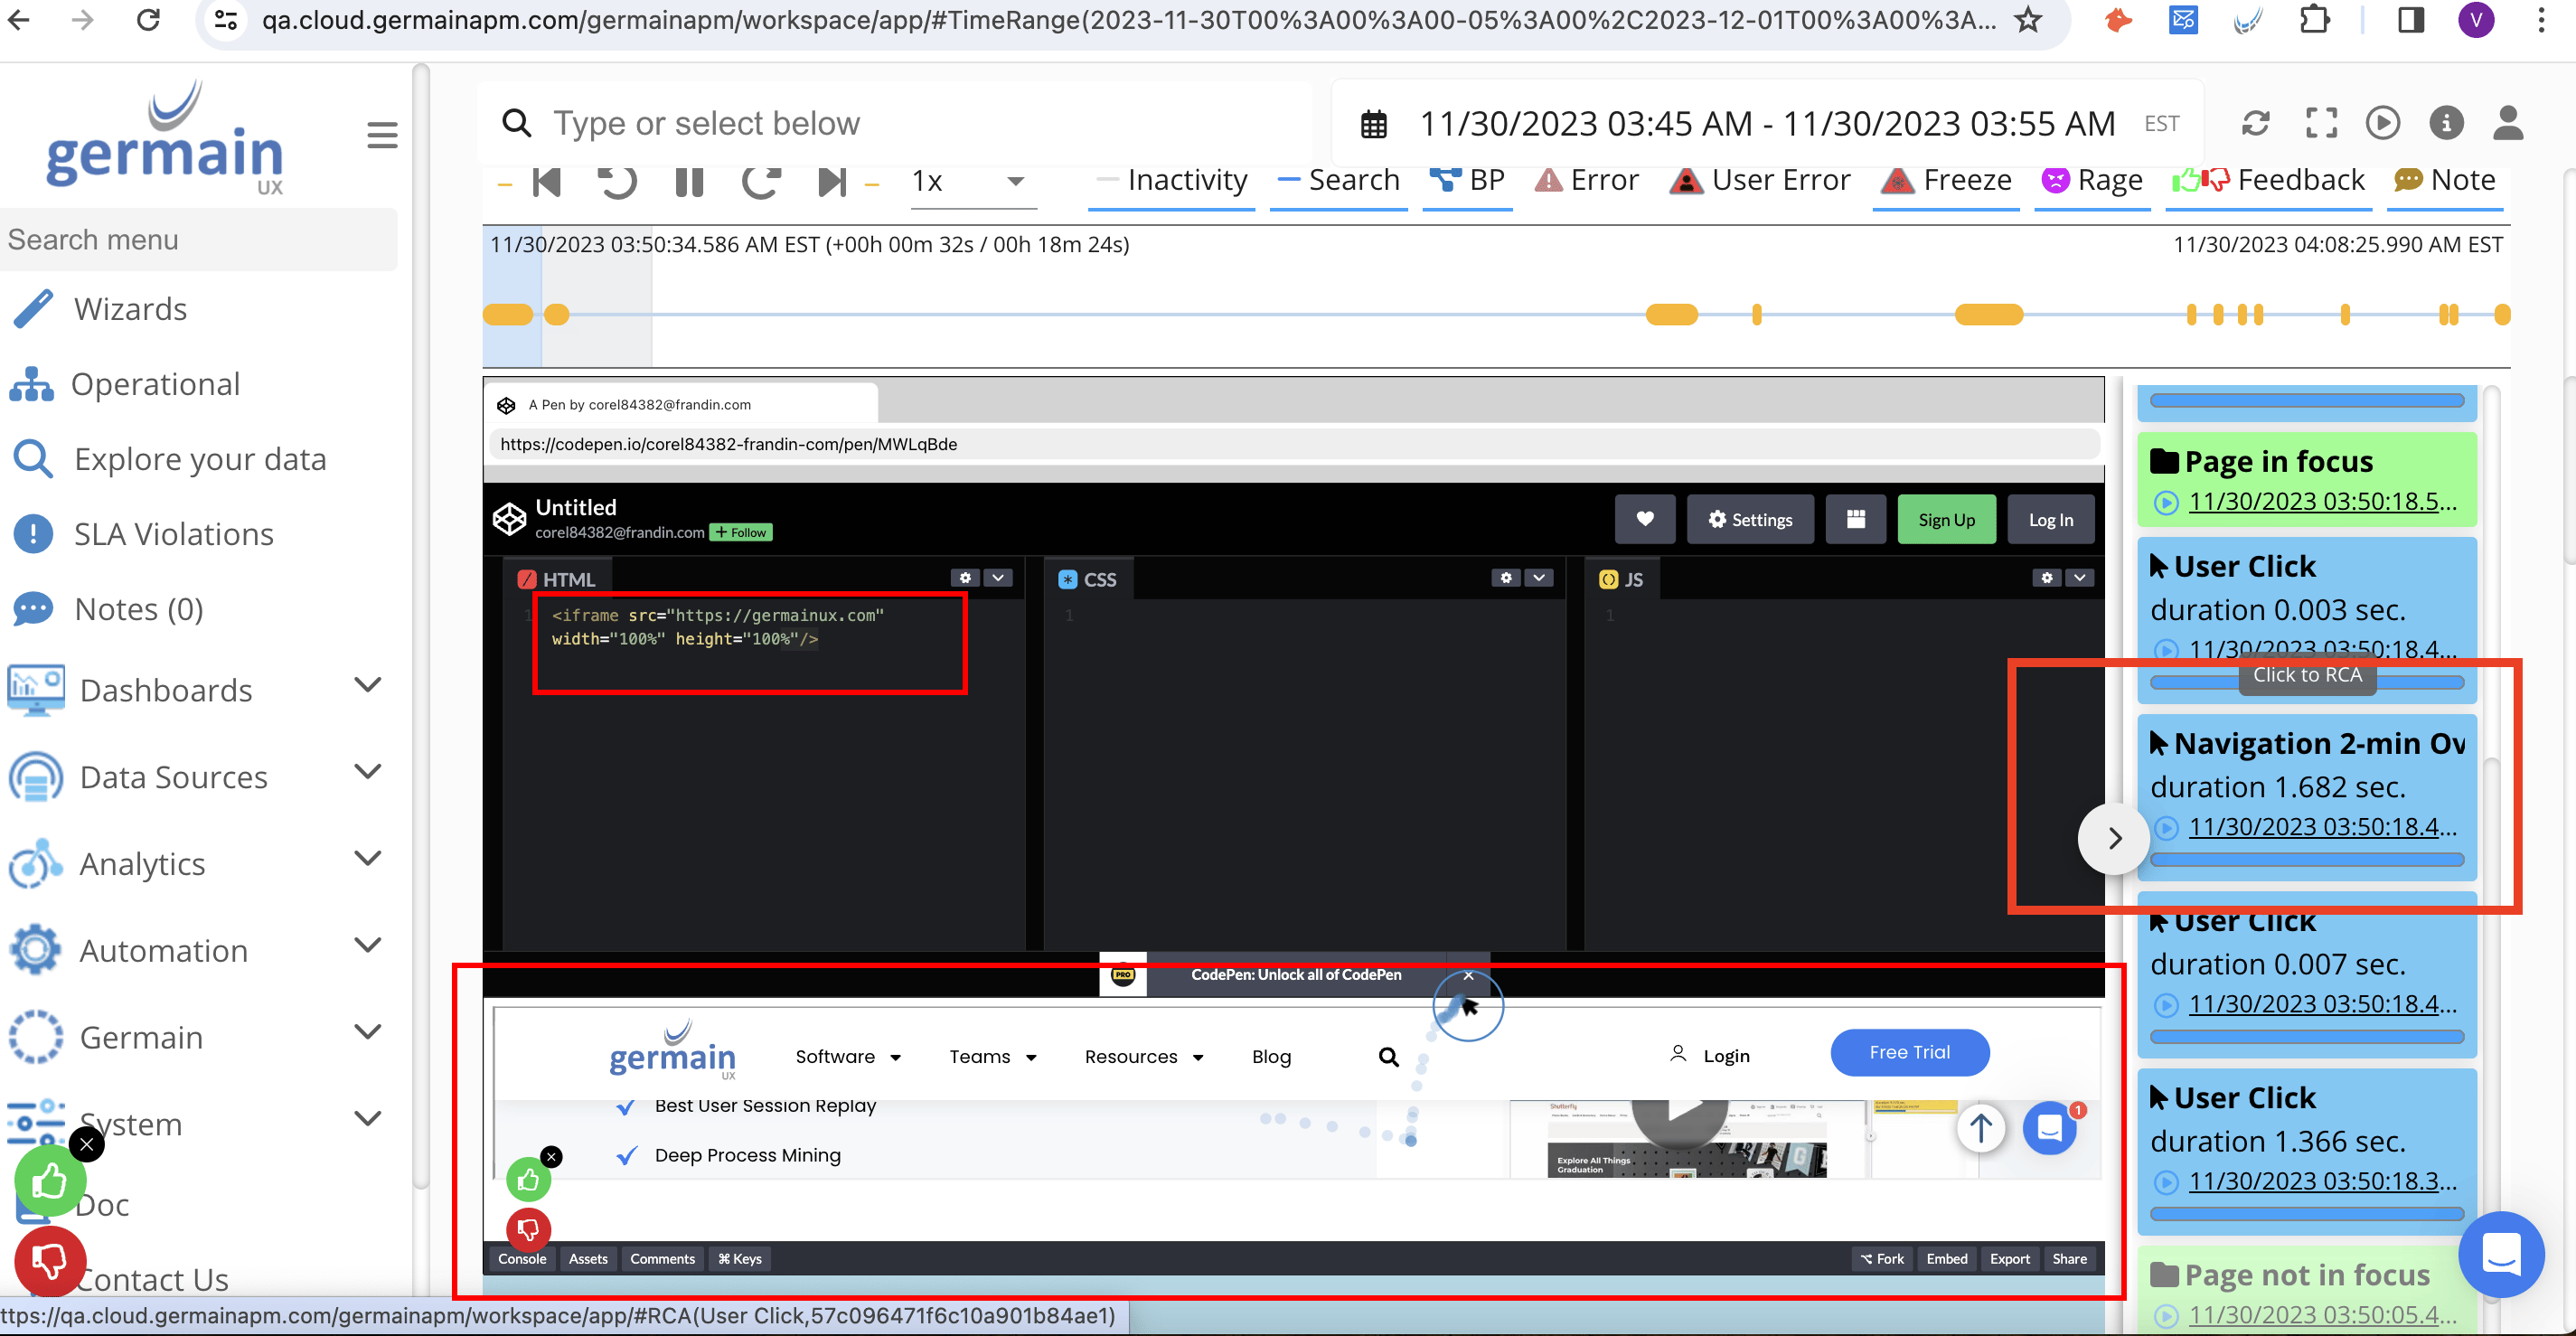
Nested CORS Iframe monitoring
Olark chat monitoring
Description This enhancement facilitates the monitoring of all end-user interactions with the company’s agents through third-party CTI integrations (e.g., Olark). More details: Chat/CTI Monitoring
A visitor requesting a chat but receiving no response, detected by GermainUX.
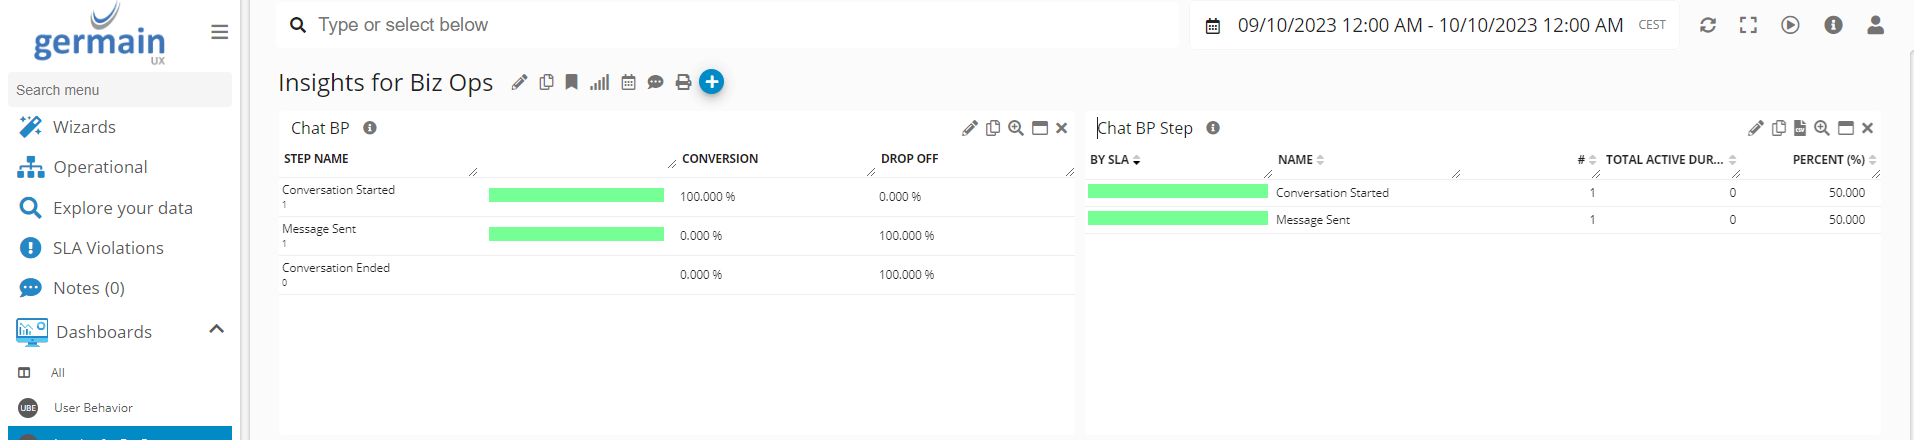
Chat conversation BP
Sortable pivot on tabular portlet
Description You can now easily reorder configured pivots in the Tabular Portlet through drag-and-drop of Pivot Column headers. This helps better assess impact at scale.
Dynamic Pivot re-ordering - GermainUX
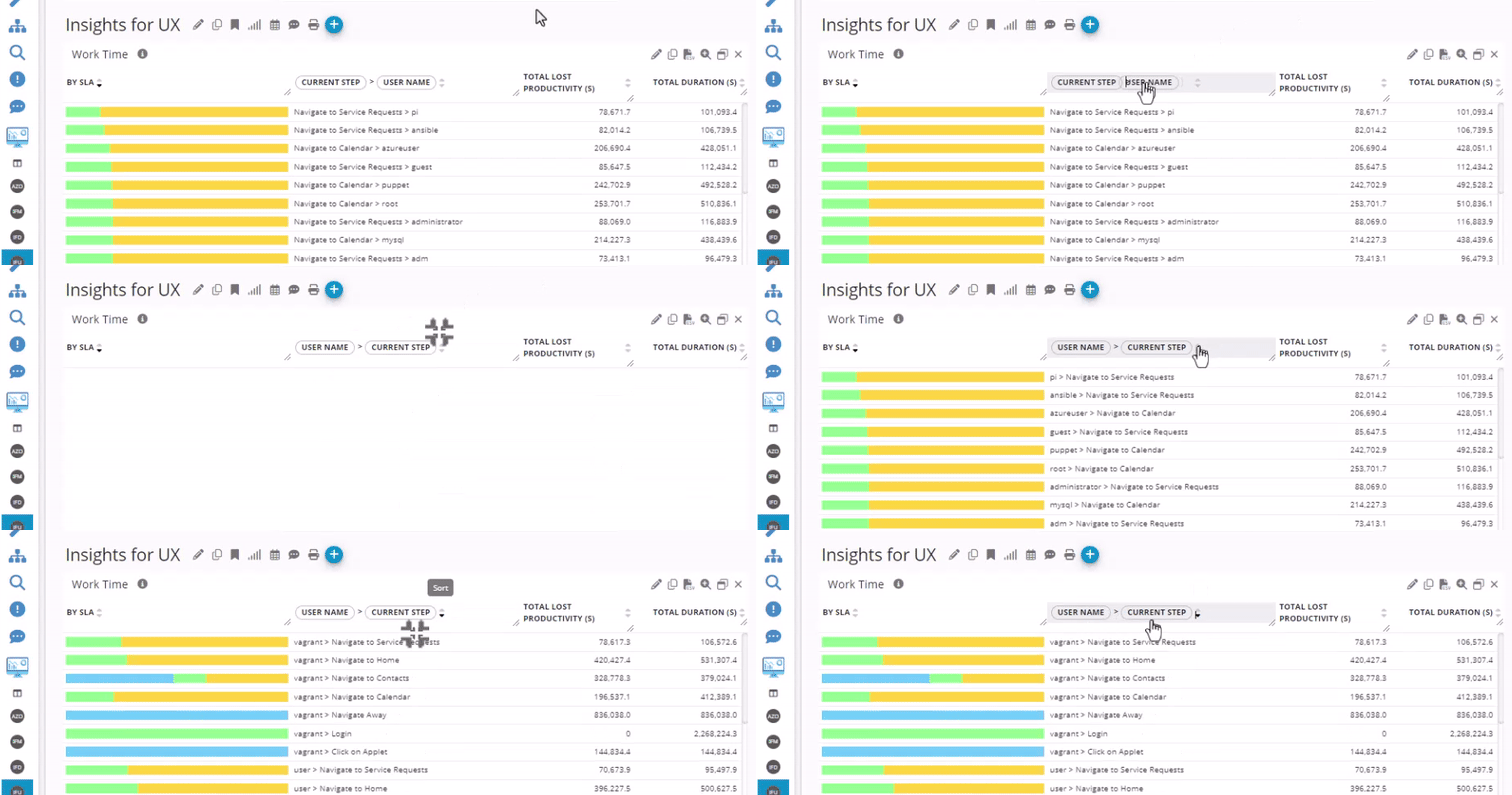
Example of pivot reordering - GermainUX
Percent summary in pie chart
Description The General Health portlet, on an Aggregate dashboard, now displays a percentage of the total in the pie chart.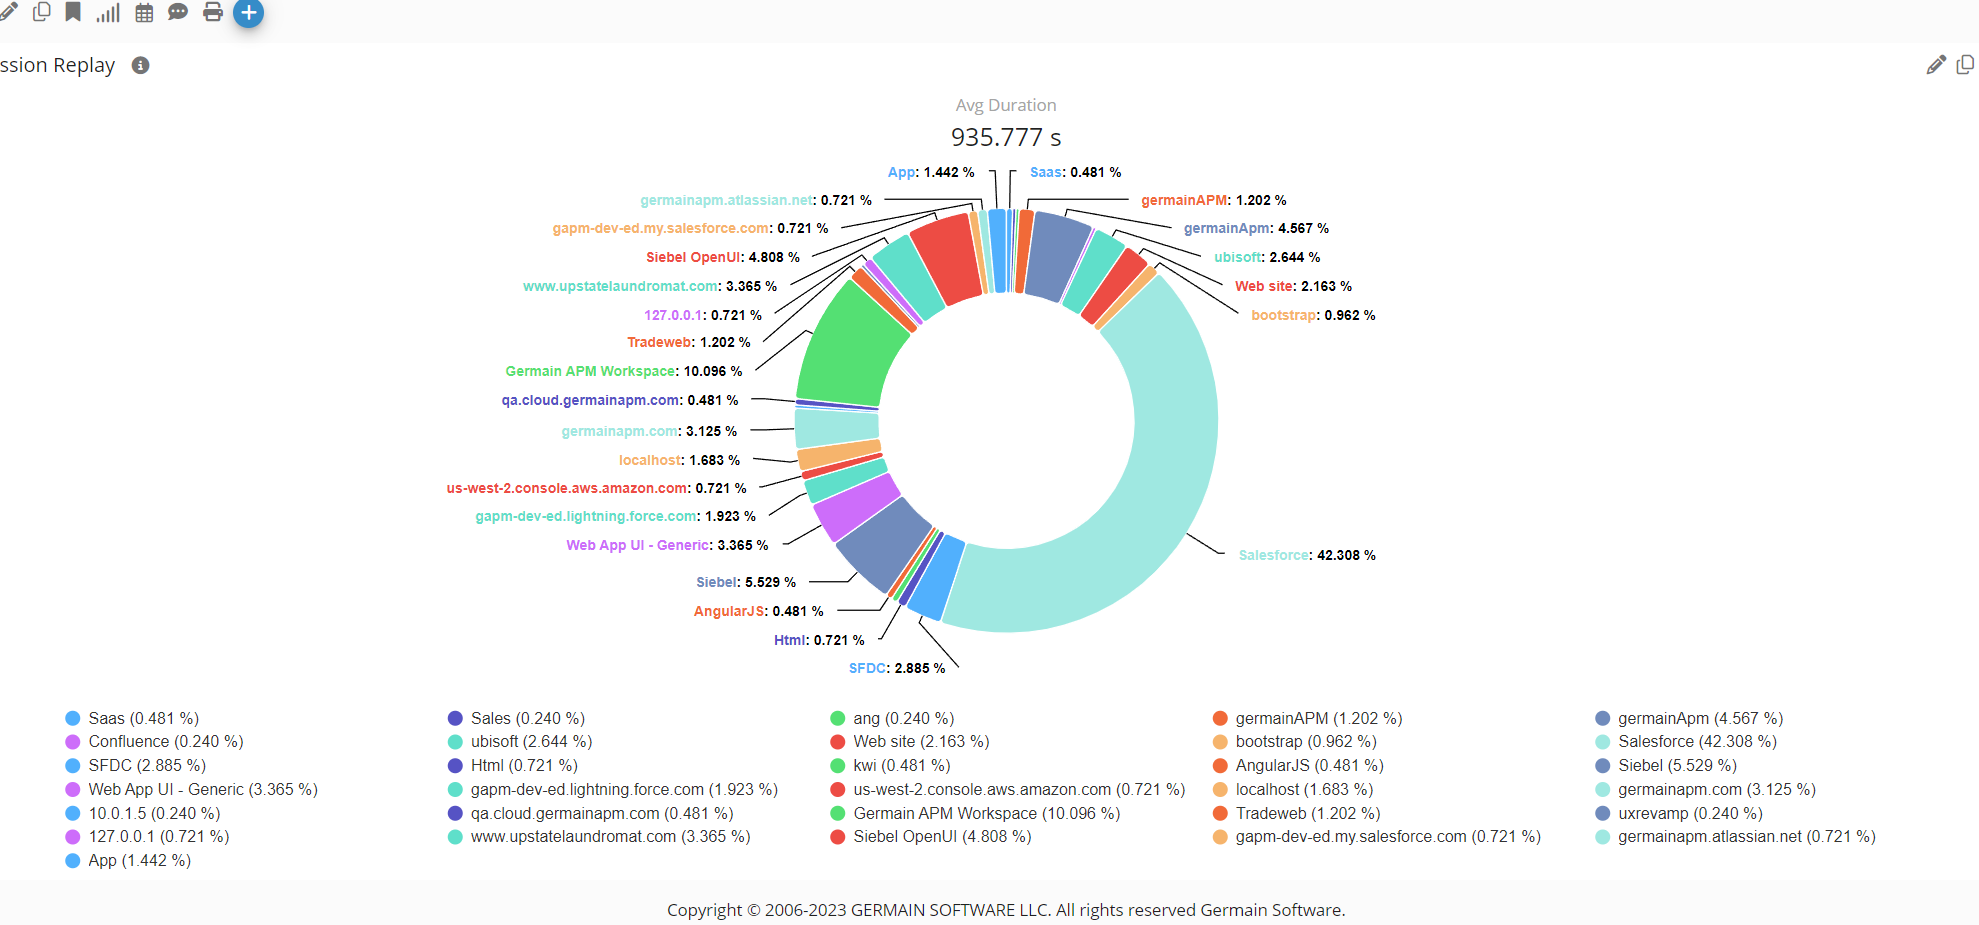
Pie Chart of General Health portlet in Aggregation Mode - GermainUX
POP3 mailbox monitoring
Requirements This client needed GermainUX to monitor POP3 mailbox, specifically:- Capture the number of messages available in the POP3 message boxes.
- If the number of messages exceeds a threshold value, retrieve the timestamps of all the emails.
- When running the RETR command to get the message timestamp, it would download the entire message details from the POP3 box, causing additional work for the email server.
- The ncat command was not functioning on Germain Engine Servers.
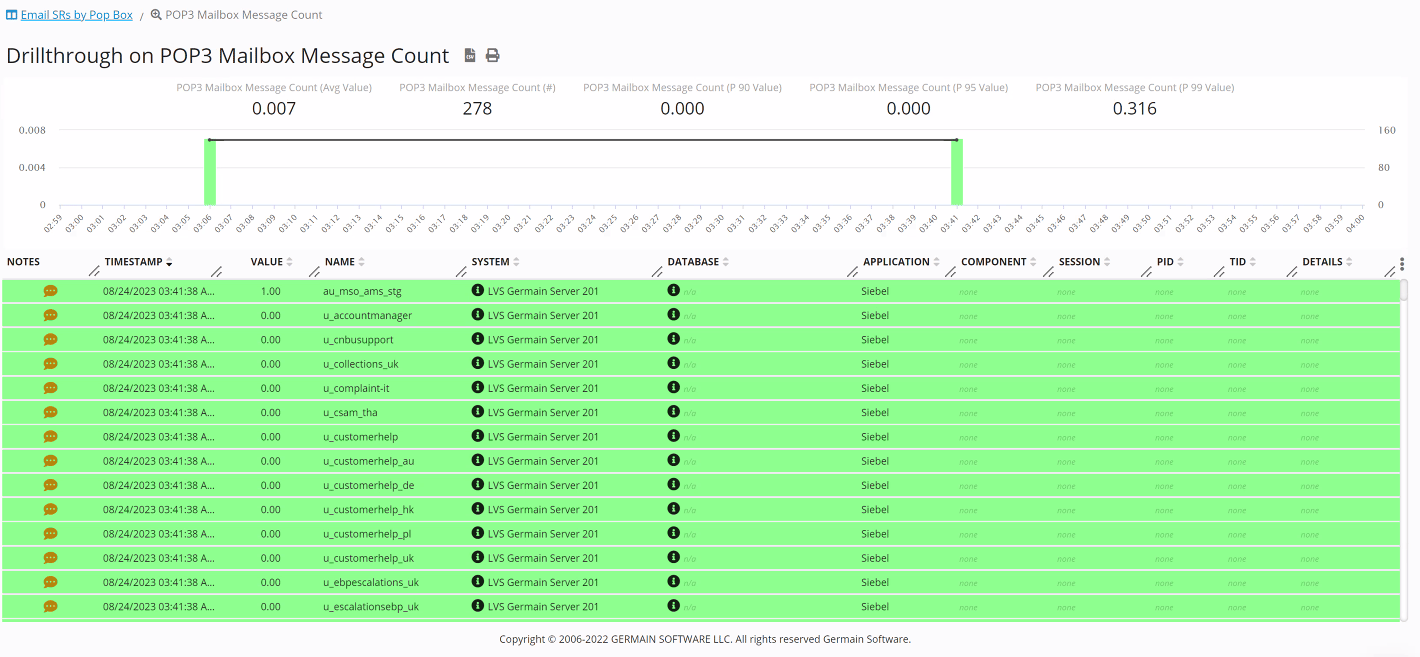
Comma-separated value of POP3 email box counts - GermainUX
Popup Response time (SFDC)
Description The client aimed to measure the time between an agent starting or receiving a call and the opening of a custom popup dialog on Salesforce. Problem Previously, we hooked into the Salesforce API $A.createComponent to monitor component creation. However, there was a delay between the function call and the component appearing on the screen. Solution After a thorough analysis of Salesforce code, we devised a more accurate method to measure Popup response time. This approach has been validated by the client.- Incoming Authenticated: Time between CTI Authenticated toast and the user account page.
- Incoming Unauthenticated: Time between CTI Not authenticated toast and the Confirm Caller Authentication popup.
- Outgoing: Time between CTI Checkin toast and the Provide Call Opening & Confirm Right Party Contact popup.
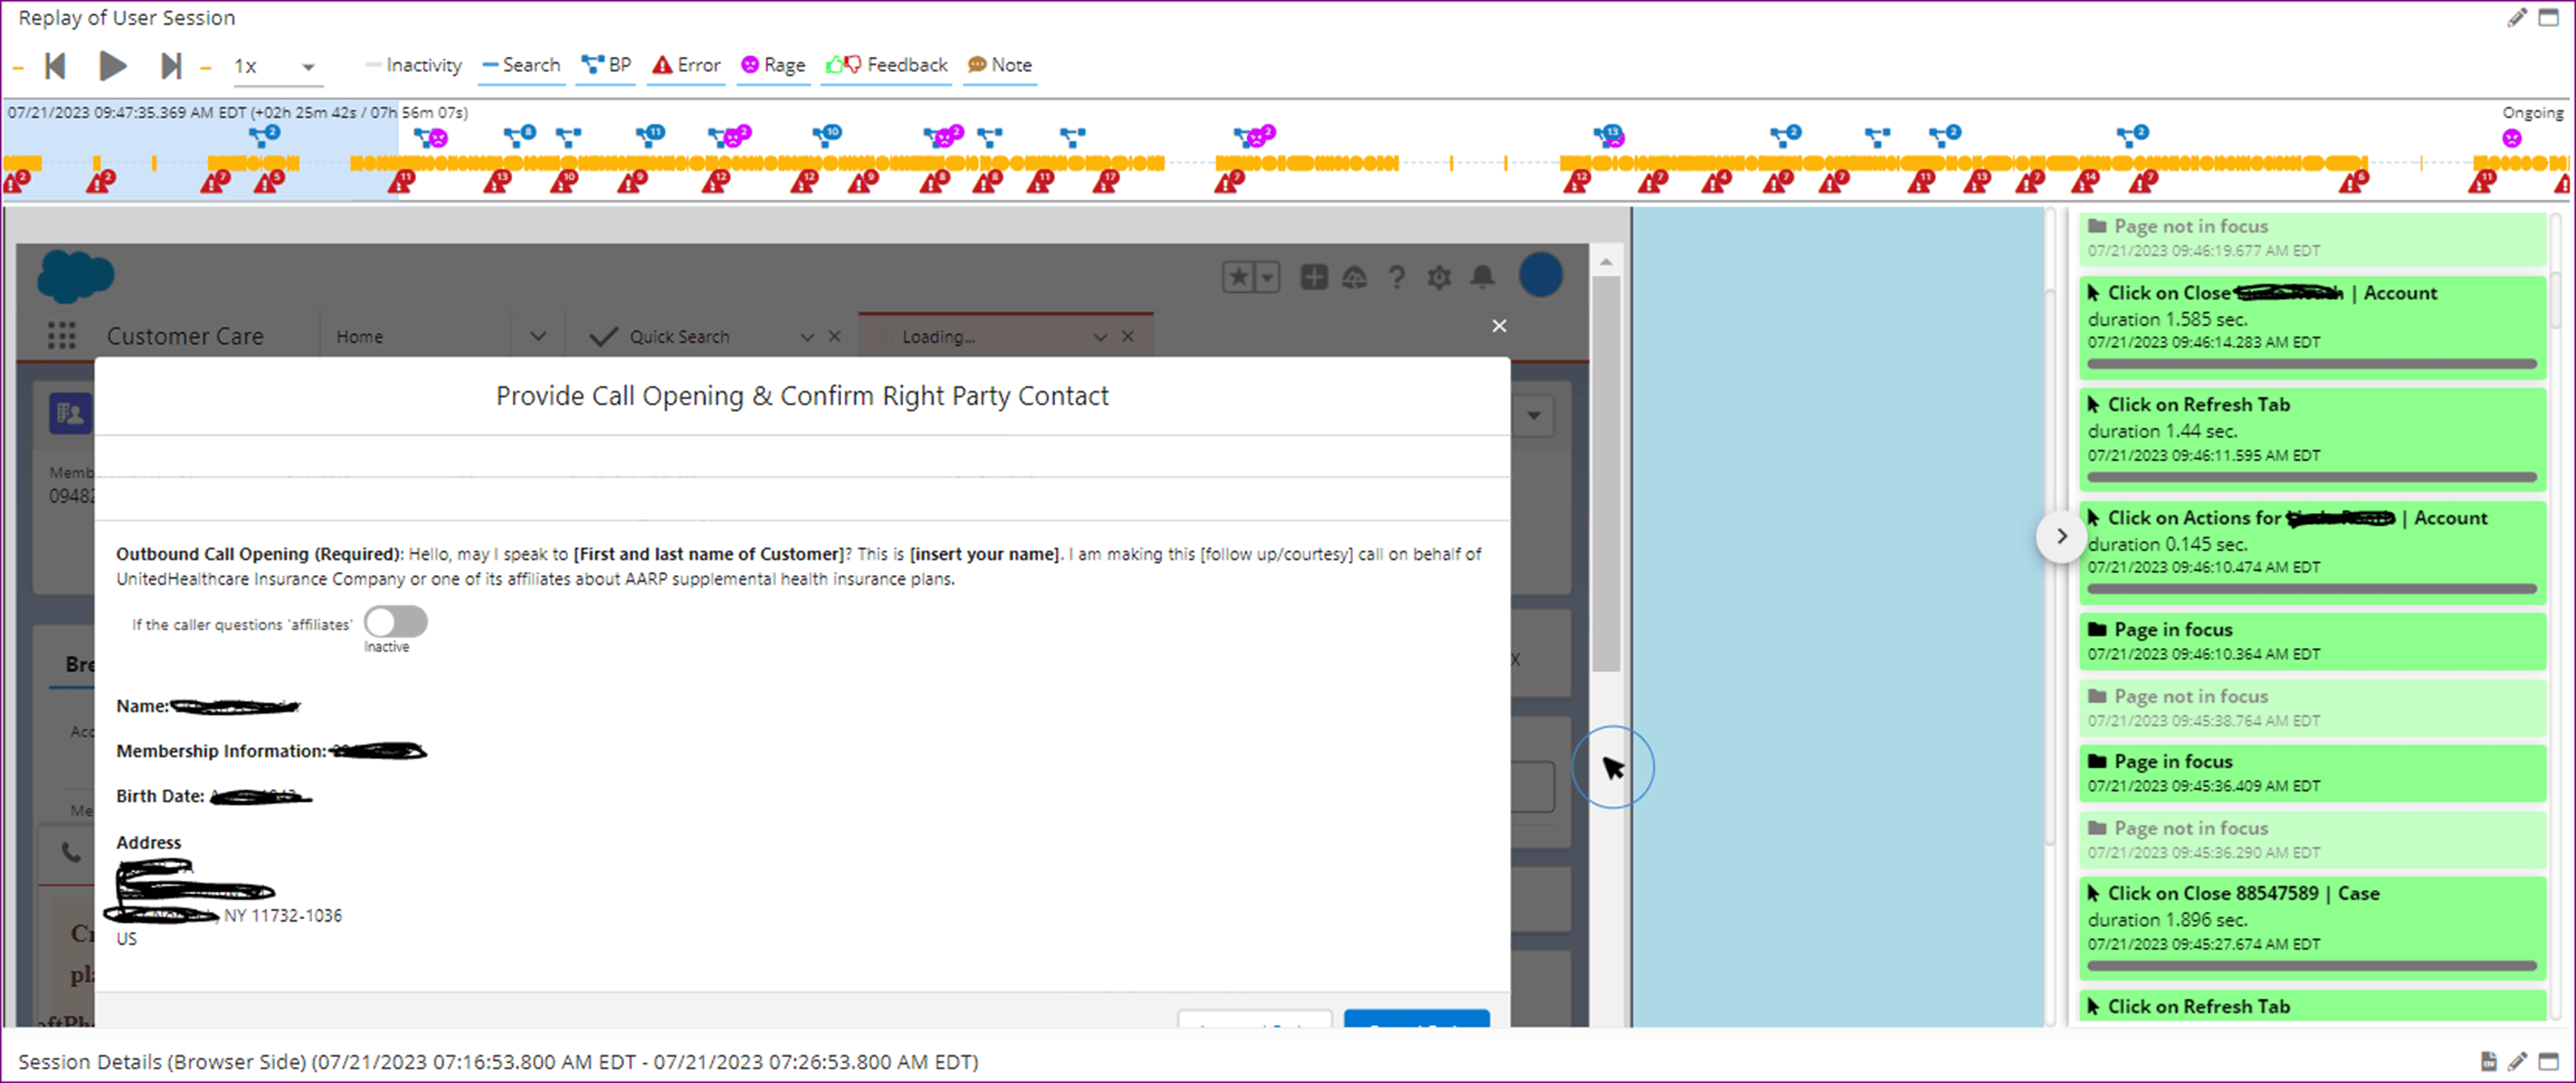
Popup for an outgoing call on SFDC captured and replayed on GermainUX
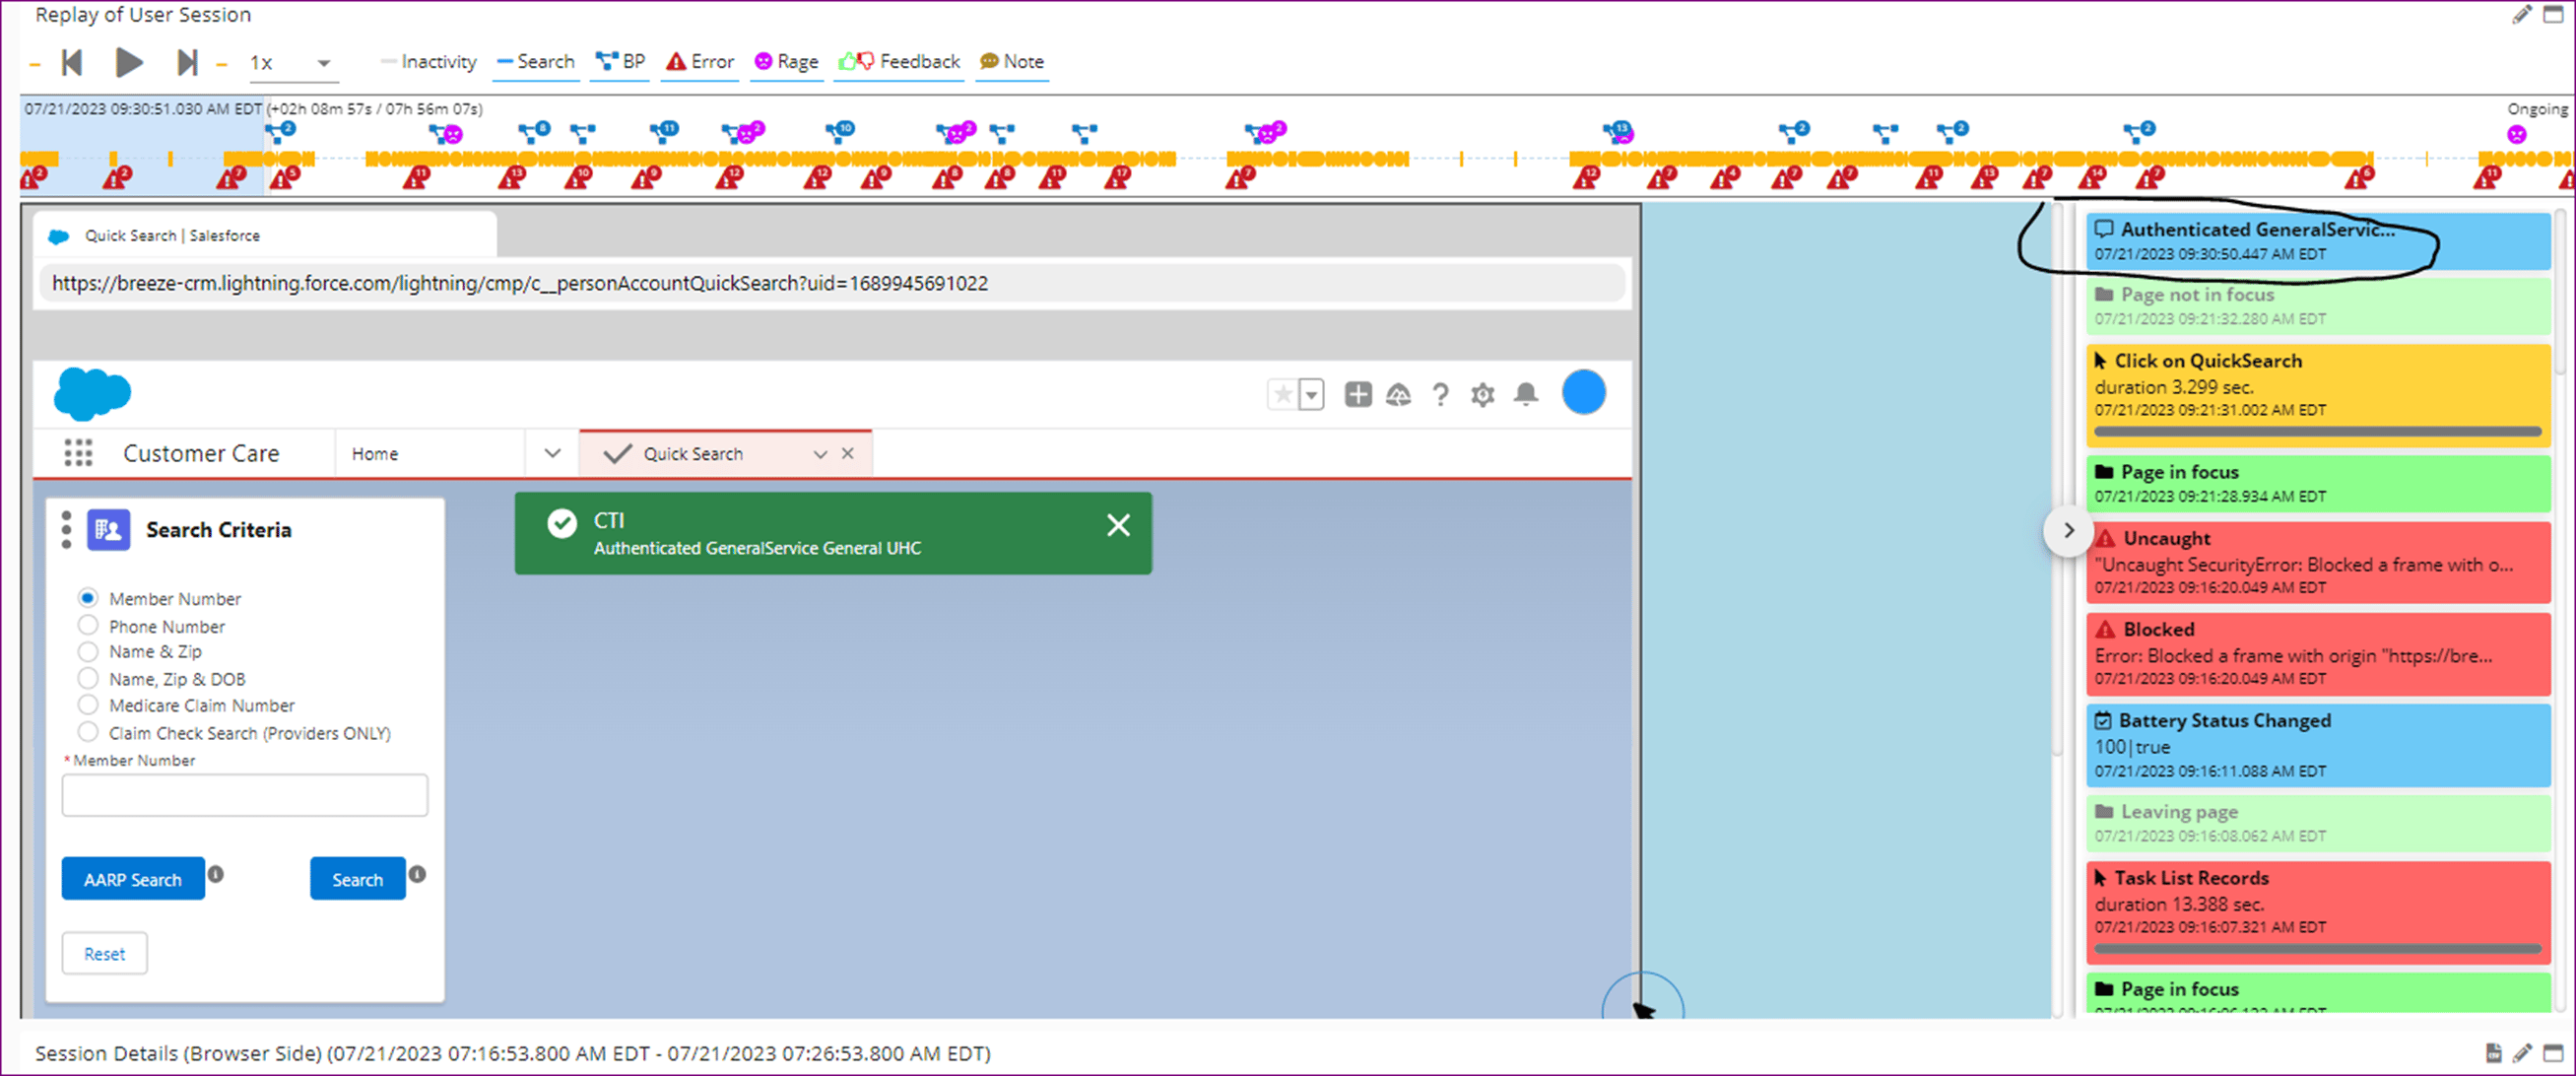
Incoming authenticated call on SFDC captured and replayed on GermainUX
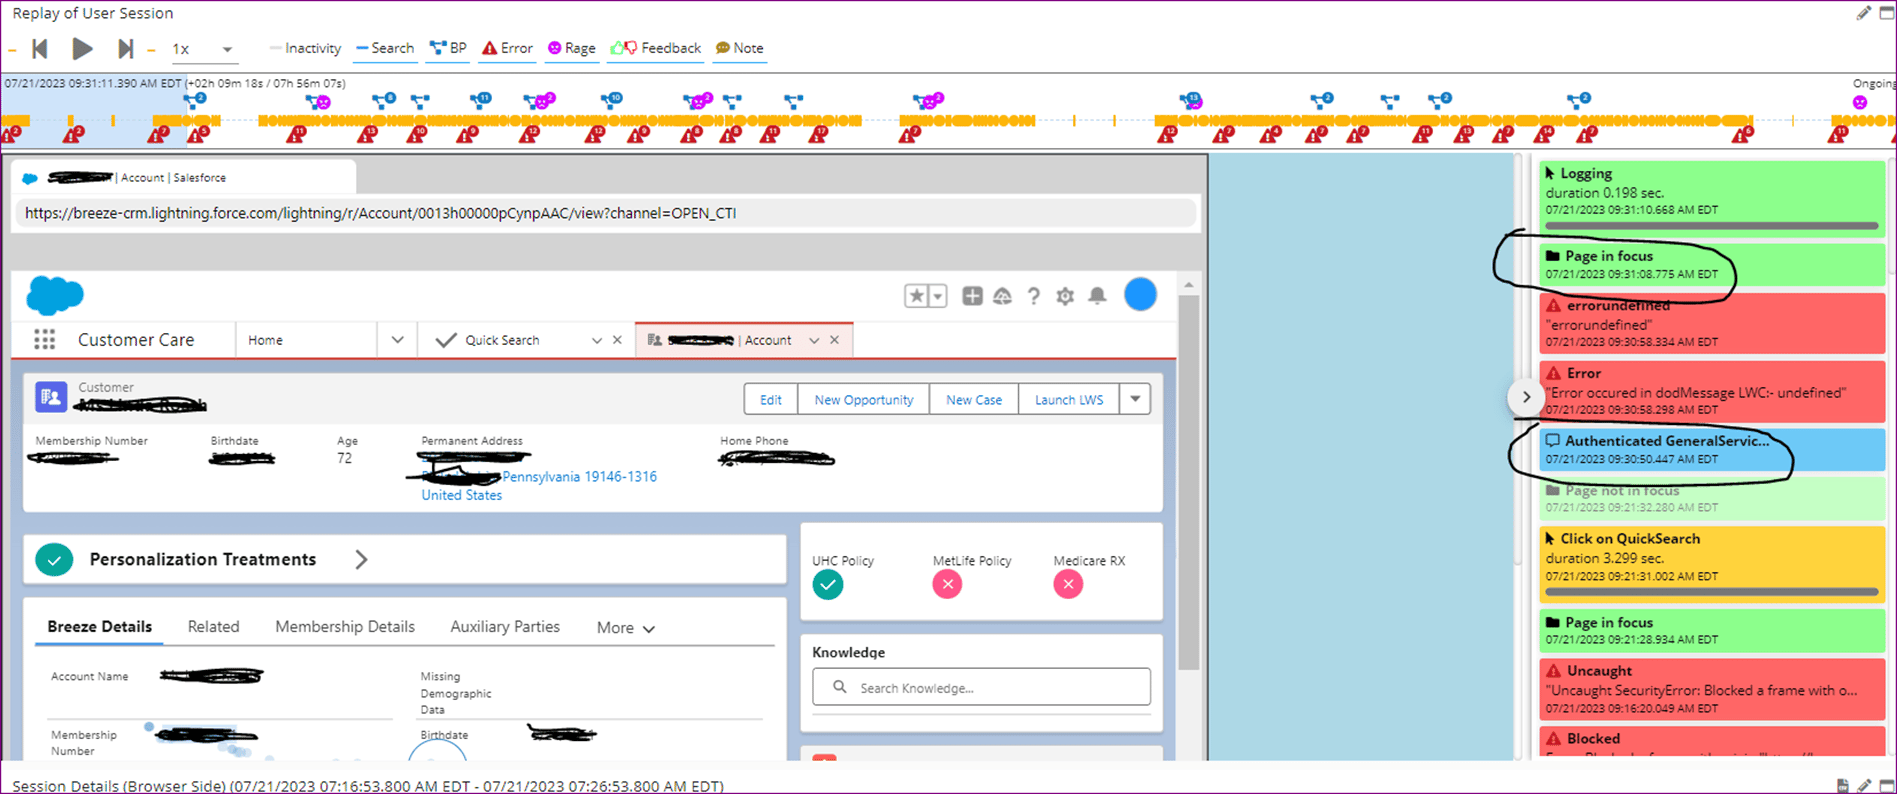
Customer page redirect after Incoming call on SFDC captured and replayed on GermainUX
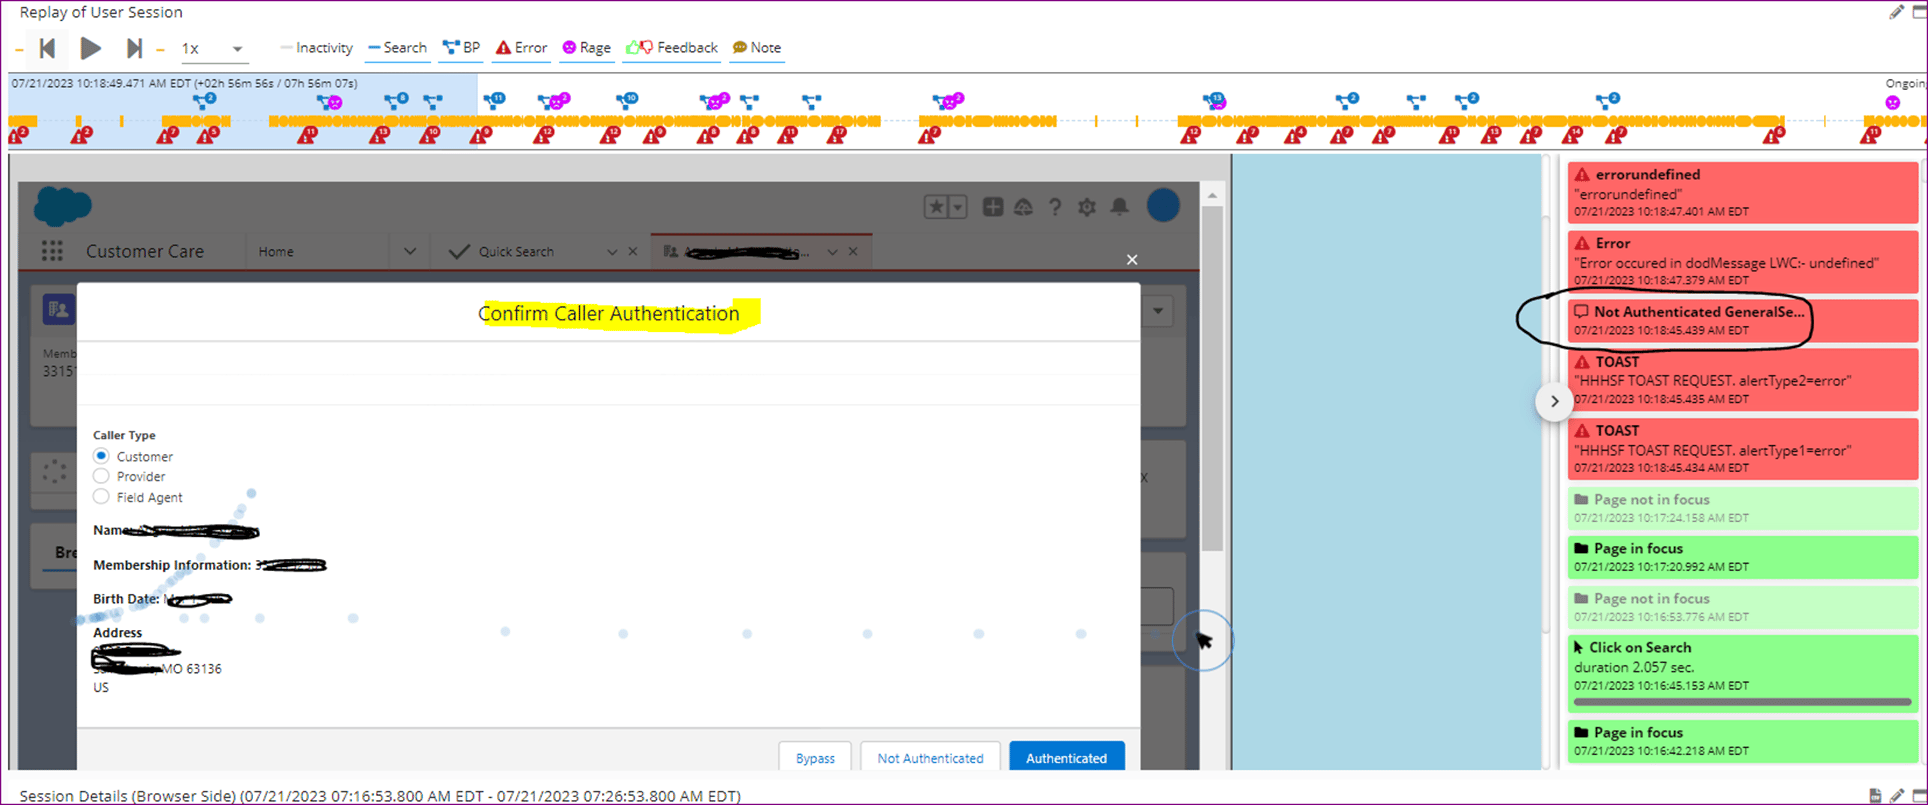
Agent gets an inbound call - GermainUX
Shopify monitoring enhancements
Description We’ve enhanced Shopify monitoring by adding:- Server-side monitoring for Shopify (database, processing, imagery)
- Checkout monitoring with UX datapoints tagged at each checkout step
- Integration with the Shopify Consent Tracking API
- Improved session and username monitoring
SLA evaluation for multiple metrics on a single data point
Problem Before, only one metric (duration, value, etc) could be evaluated against the SLAs configured for a given data point. This customer needed GermainUX to be able to support having SLAs for both Inactive Duration and Active Duration, as well as Color threshold values for both. Use Case This client was only interested in identifying where 80 employees are spending their time while creating HR plans later handed over to HR brokers. Every minutes is significant to this client business, the reason why they needed GermainUX to analyze all this in real-time and provide actionable insights as to why and how time is spent. Solution/Enhancement As part of this enhancement, GermainUX now supports having SLAs for as many metrics as you like. Example Here is an example a User Click SLA taking into account 3 separates criteria or thresholds: slowness, failure or large memory footprint.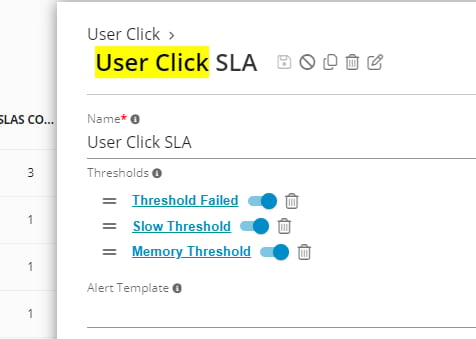
User Click SLA - GermainUX
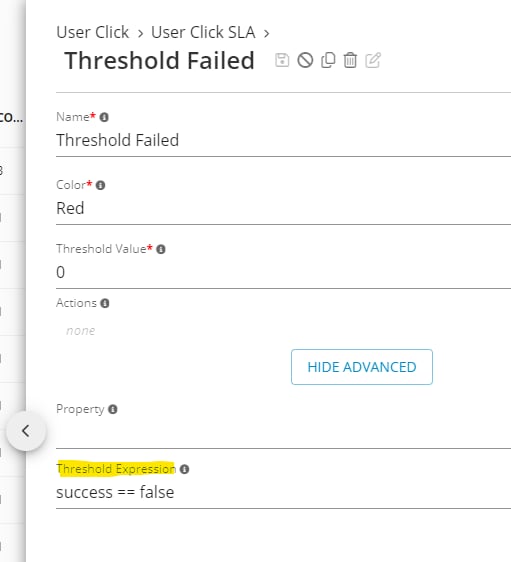
1st threshold of User Click SLA - GermainUX
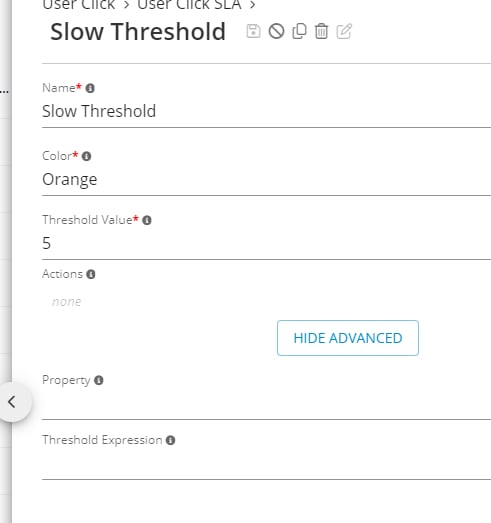
2nd threshold of User Click SLA - GermainUX
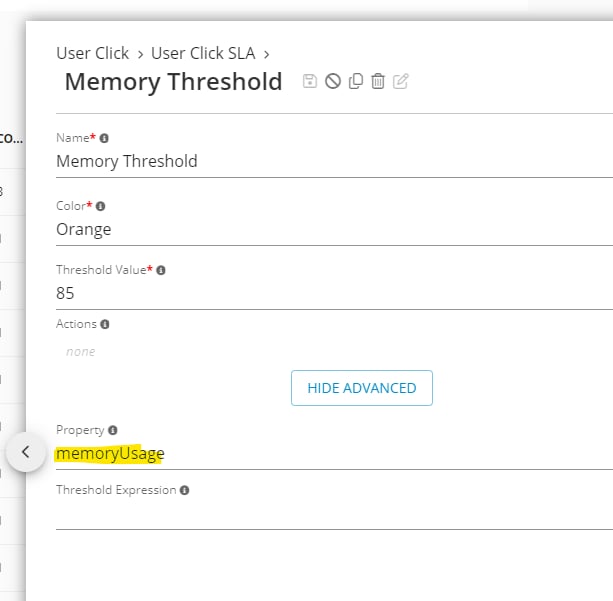
3rd threshold of User Click SLA - GermainUX
User time and overrun
Description This note clarifies the insights related to the business process monitoring provided by GermainUX. In the realm of real-time business process monitoring, GermainUX employs a general calculation referred to as ‘overrun.’ However, for technical KPIs, this measure might be termed ‘Lost Productivity’ as it represents technical time that can be assumed to be impeding user time. This distinction does not apply to user-activity related KPIs, as their duration signifies Productive Time.Duration that user waited - SLA threshold = lost productivity (technology time) Duration that user worked - SLA threshold = overrun (user time or active duration) Duration that process took - SLA threshold = overrun (process time or duration)
User error on session replay
Description This enhancement aims to increase the visibility of User Facing Errors on the Session Replay RCA dashboard in the German UX workspace. While the ability to detect User Errors has been a part of German UX for several years, they were previously grouped with background errors like JS Console Errors. With this enhancement, the presentation has been improved, making it easier to focus specifically on issues directly affecting or distracting users.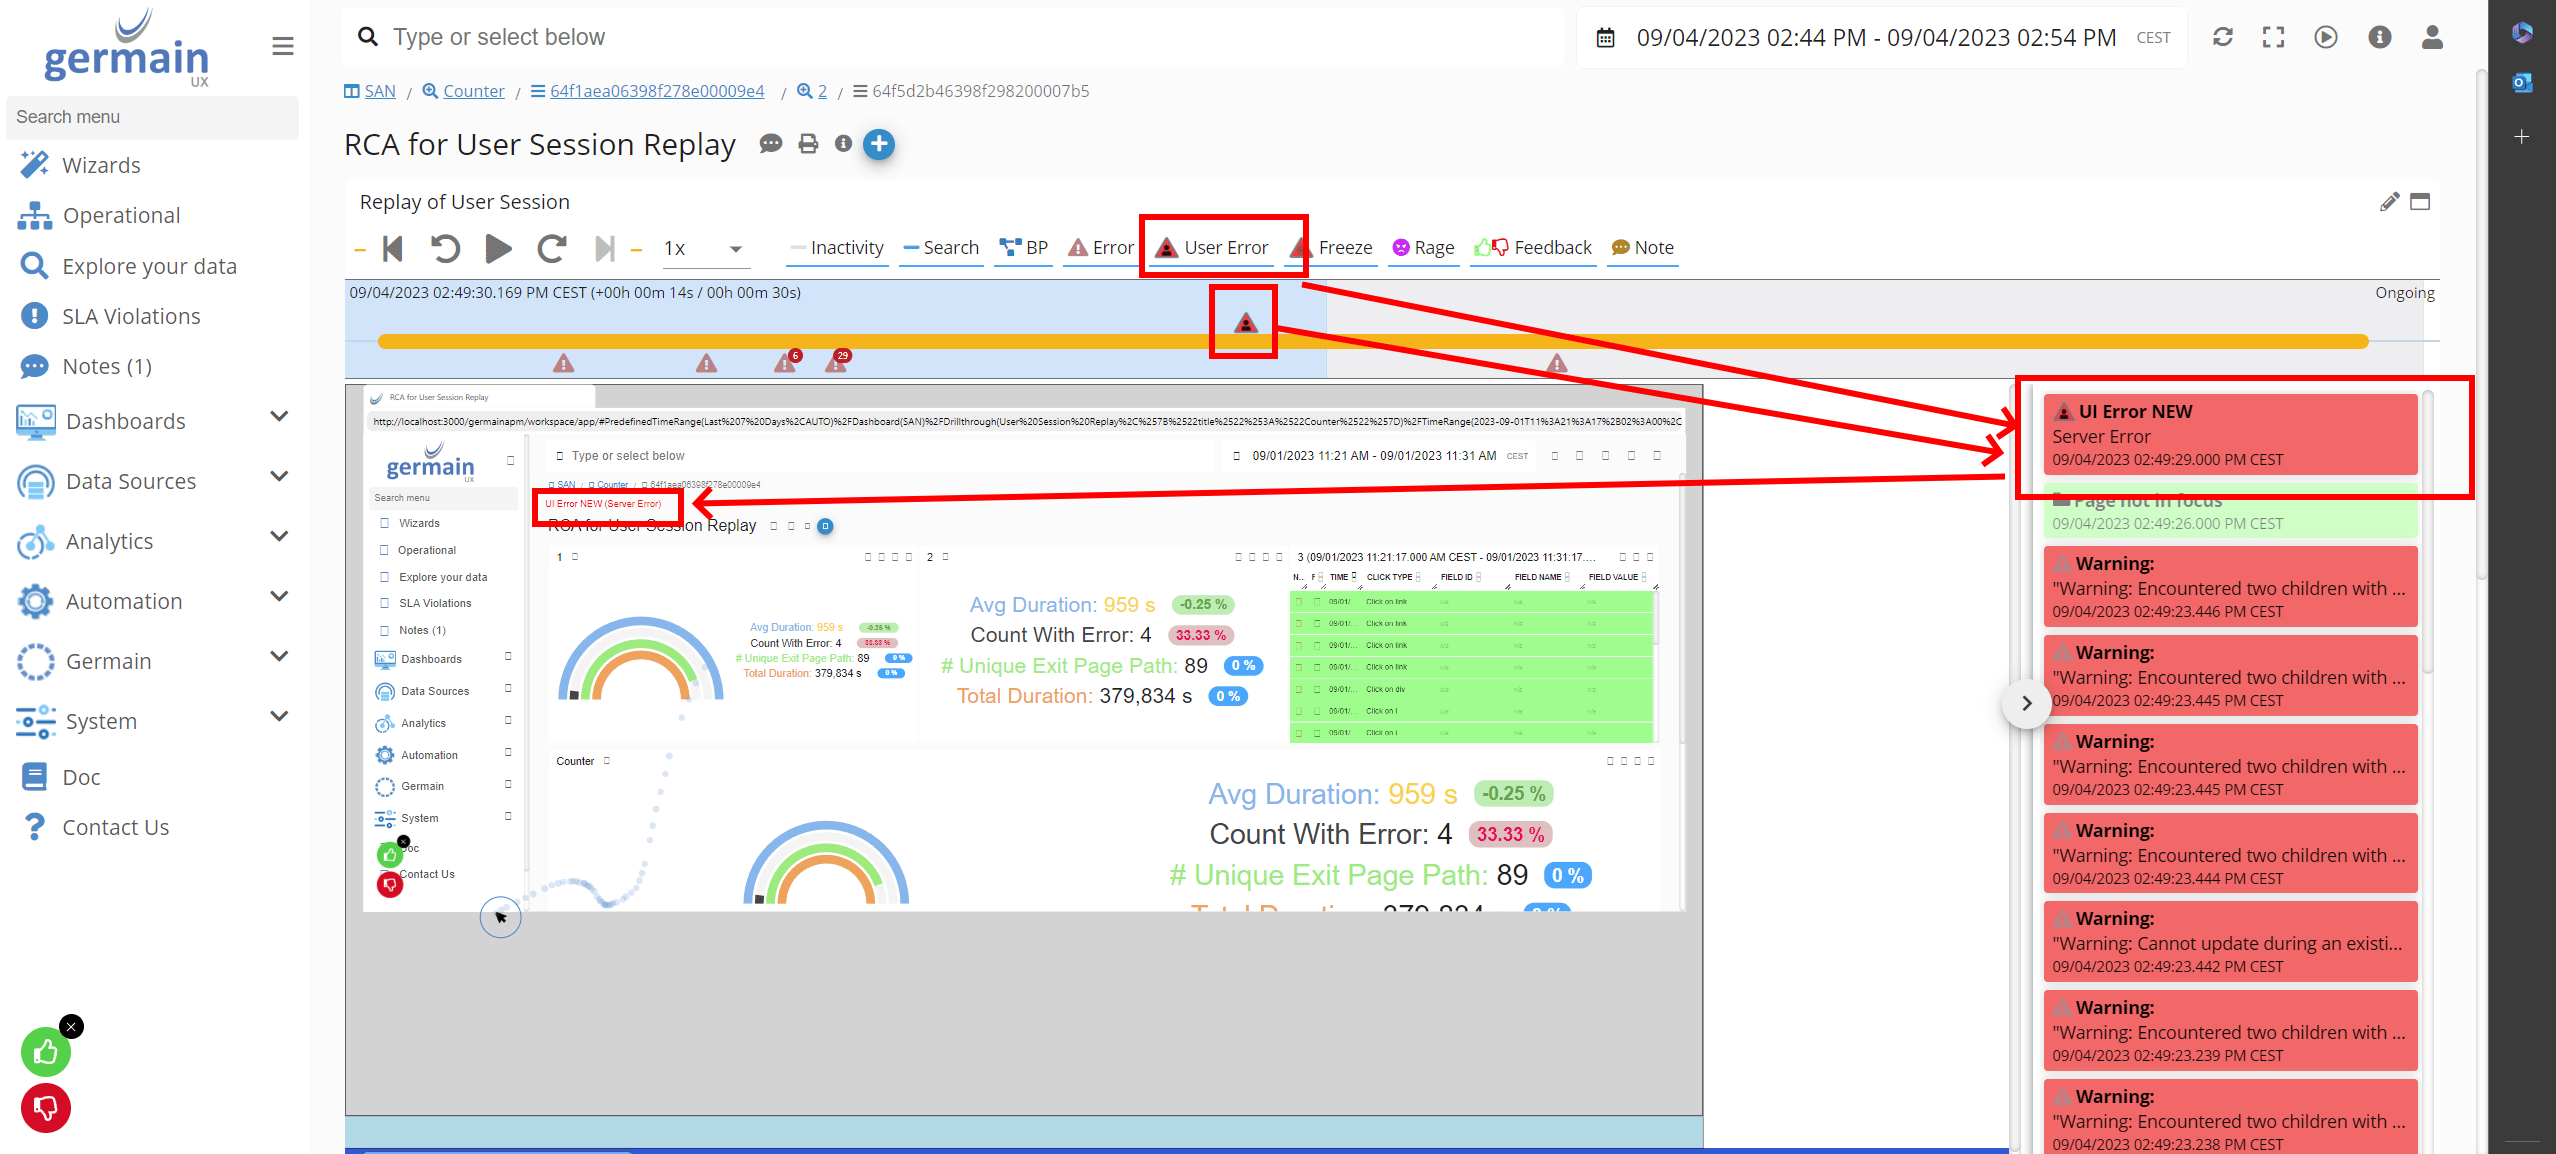
User Errors on Session Replay Dashboard
Video monitoring (Vimeo)
Description This enhancement facilitates the monitoring of all end-user interactions with embedded Vimeo videos on the monitored website. It’s important to note that GermainUX does not stream videos. The primary benefit is to provide insights into user interactions with videos. For more details: Video Monitoring (Vimeo, …).Maintenance Features
AI ready
Description In the past 6 months, we streamlined GermainUX’s architecture for seamless integration with third-party AI systems. A significant amount of work went into enhancing Germain’s Analytics Pipeline, leveraging Kafka. This comes in response to a client’s demand for enhanced insights. Next? Our goal is to deliver an initial series of AI-driven insights, leveraging our millisecond-precise session monitoring and replay mechanism that has now well proven to be unique and accurate in finding the top 10-20% UX issues that impact organizations the most.Cookie consent integration
Description This enhancement allows to integrate Germain RUM JS with IAB TCF 2.0 and 3rd party Cookie Consent Managers:- CommandersAct
- Consentmanager
- Cookie Bot
- Cookie Information
- Crown Peak
- Didomi
Show all 13
Show all 13
- HubSpot
- Iubenda
- NextRoll
- Osano
- Sourcepoint
- Termly
- Usercentrics
Datasource management enhanced
In the last release (2023.2), we introduced our new Datasource screen. With the 2023.4 release, we are announcing the release of the underlying mechanisms needed to make all this work at scale. Problem Customers relying on GermainUX to monitor technologies were facing multiple issues, including:- Difficulty understanding the relationship between configured entities (data source > KPI > SLA > alert > dashboard).
- Challenges in managing data sources.
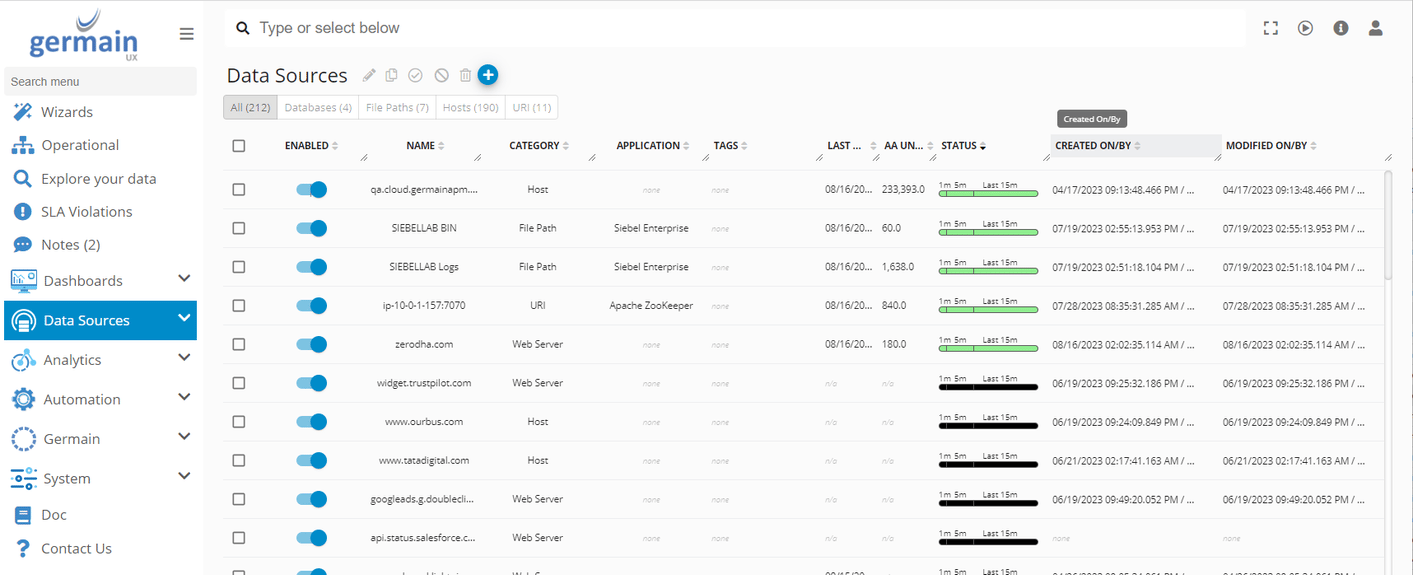
Datasource screen - GermainUX
Elasticsearch within docker
Description All our customers using GermainUX on our AWS Cloud have now been migrated from AWS RDS to Elasticsearch running within Docker containers. This provides significantly higher performance and easier maintenance. As a reminder, here’s an overview of how much faster Elasticsearch is compared to other relational databases: Benchmark - Aurora vs MySQL vs Elastic.Elasticsearch 8.x
Description GermainUX now supports Elasticsearch 8.x, offeringadditional benefits compared to version 7.x. Elasticsearch vs. Opensearch- Opensearch on AWS does not support custom plugins, such as the GermainUX plugin that provides efficient computation of percentiles over large sets of aggregate data
- Point-in-time queries are not supported in Opensearch; instead, the ‘scroll’ method is required.
- Opensearch has limited support for transform options, which may need further review.
- Options for lifecycle policies have changed slightly.
- Elasticsearch: This can be run on physical servers, VMs, containers, EC2 instances, or any compatible platform. It is the recommended solution for both on-premise and cloud environments.
- AWS Opensearch: This is a hosted fork of Elasticsearch provided by Amazon. While similar to regular ES, it lacks certain features that GermainUX relies on.
- AWS ElastiCache: This is a caching technology unrelated to Elasticsearch.
Engine manager auto-restart
Description GermainUX’s Engine Manager now automatically restarts after an upgrade.Filter management screen
Description The Filter Management screen empowers your Germain Administrator to maintain filters for various teams. It allows the management of both public and private filters, facilitating updates, disabling, and toggling of filters from a centralized location.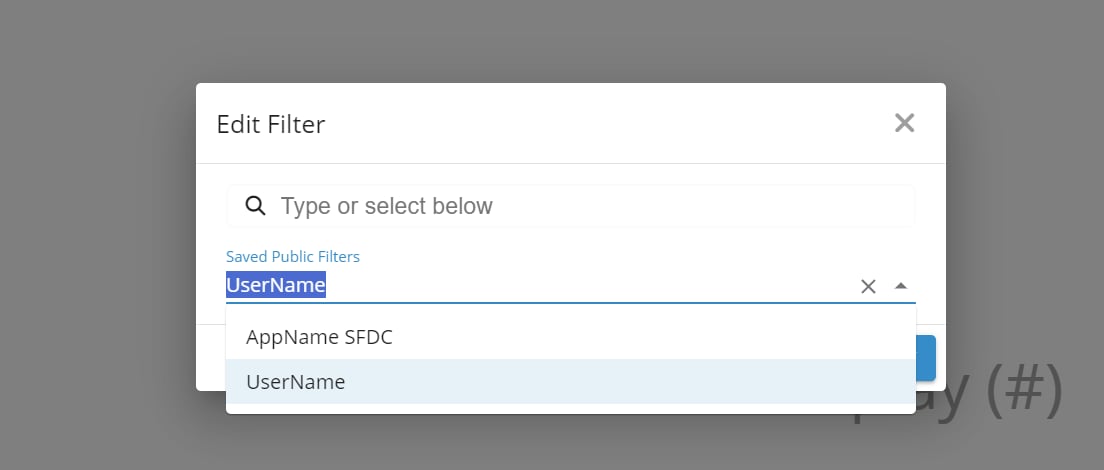
Edit filter from GermainUX portlet
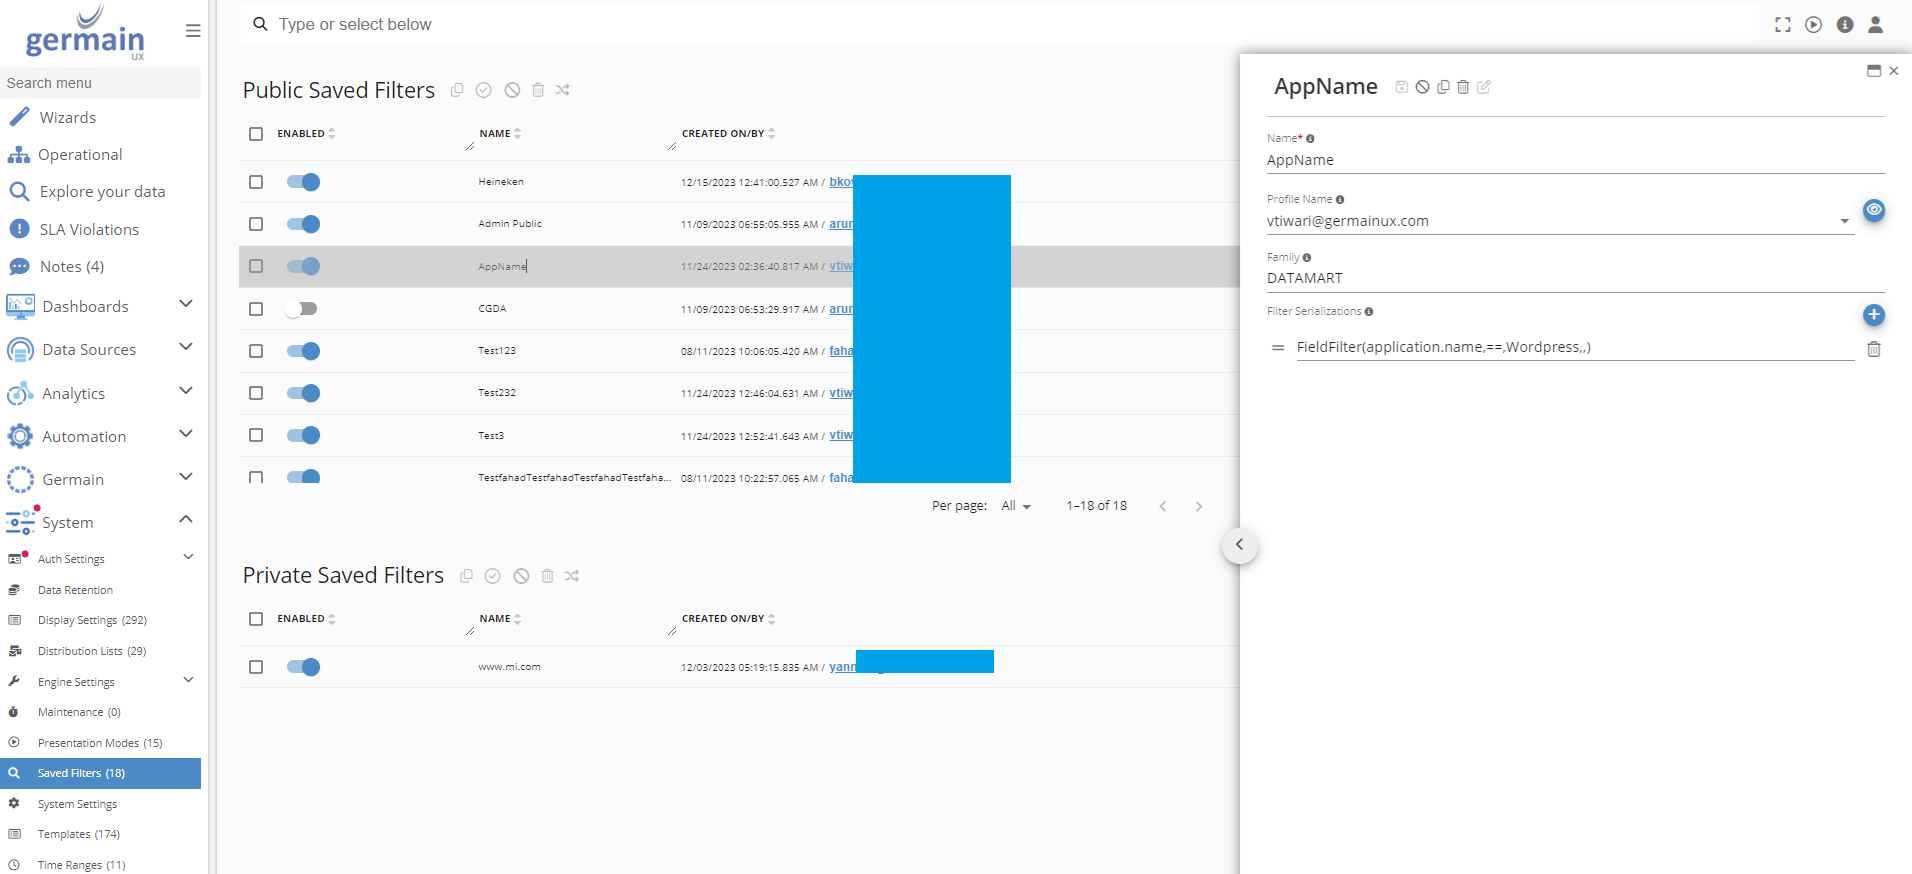
Filters Management Screen - GermainUX
Har file export
Problem The customer faced challenges exporting a HAR for an 11-hour user session, with 10k batches accumulating to 285MB—exceeding our 100MB limit. Solution/Feature To address this, users can now export relevant portions of a session, choosing a specific time range or one User Click at a time. Germain User gains the ability to:Export the entire user session replay to HAR
Export the entire user session replay to JSON, including facts from all configured KPIs
Export each user click from a session replay to HAR
Export each HTTP request from a session replay to HAR
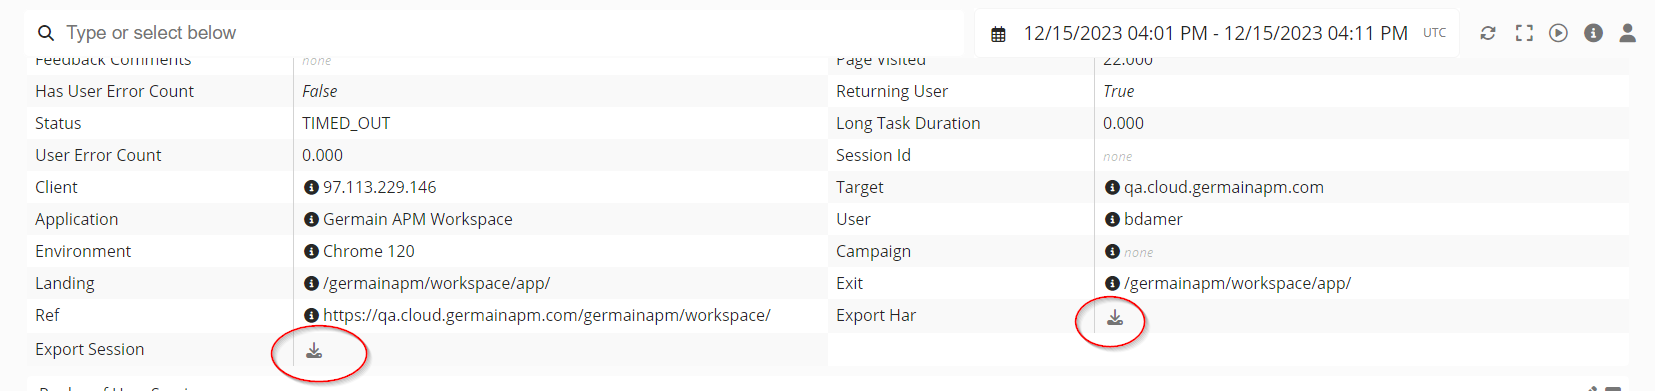
har file export - GermainUX
HTML template editing made easier
Description Template editing is now significantly easier, allowing you to visualize alerts or reports as you edit the HTML template.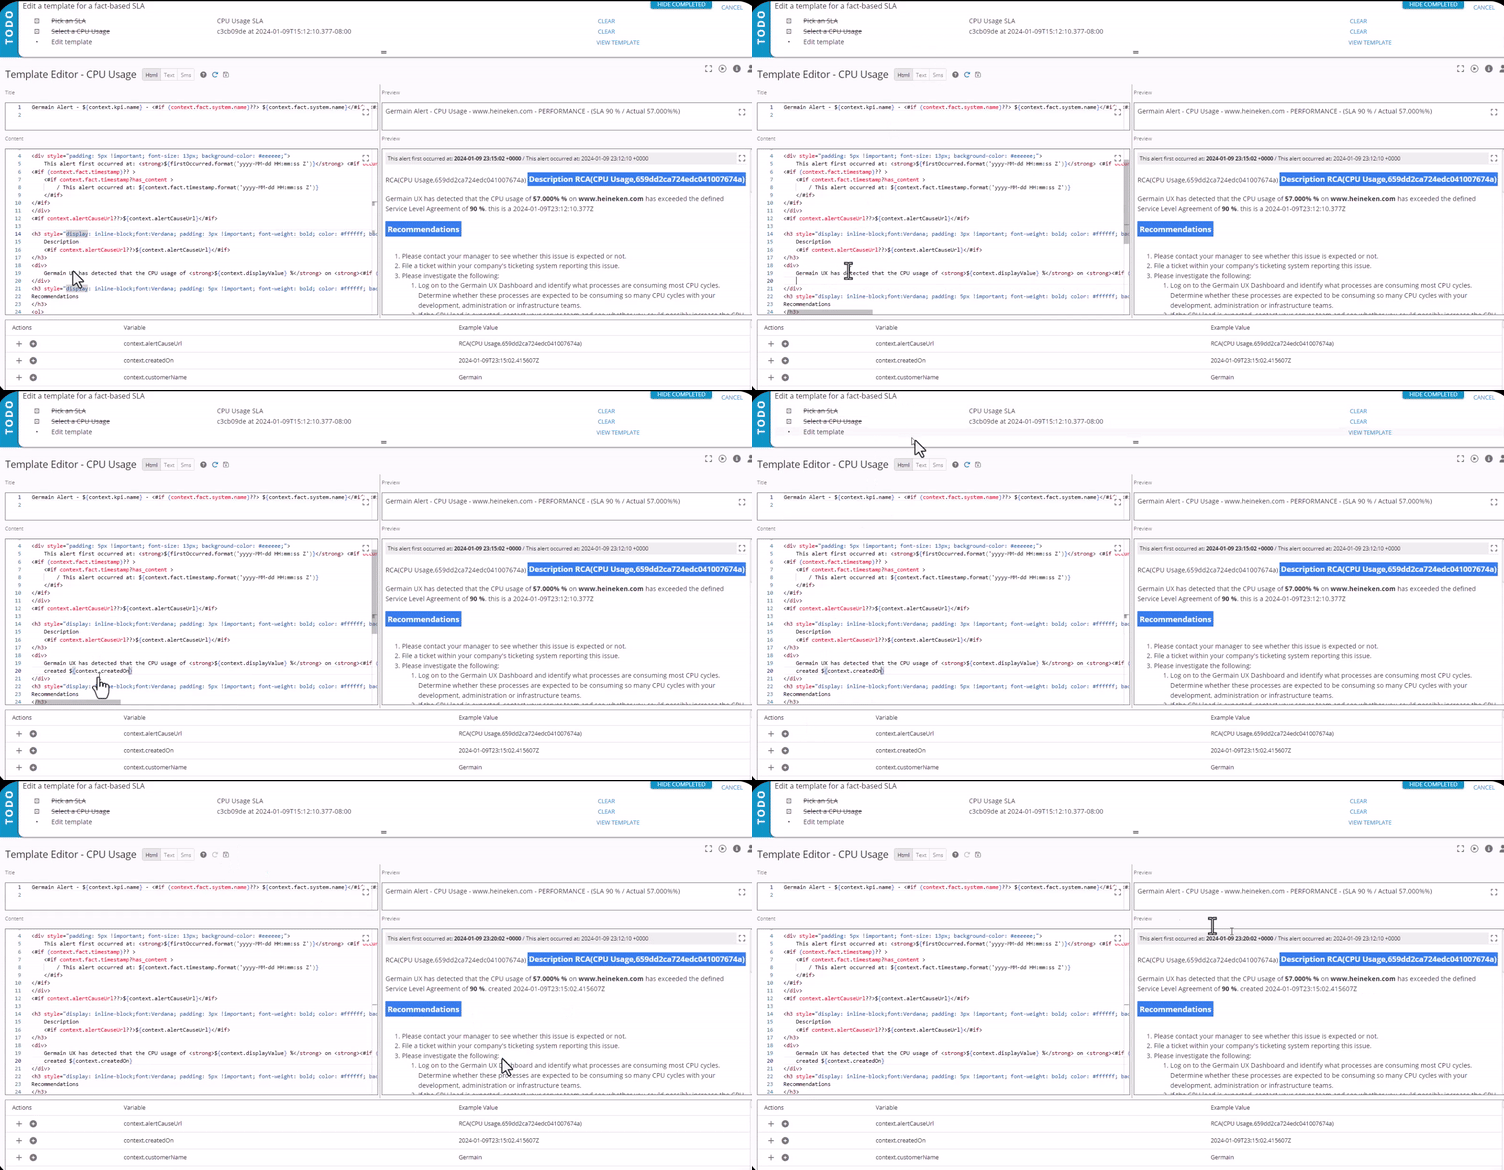
HTML template editor - GermainUX
”Import all” to measures & pivots display names
Description A new button is now available in ‘Measures & Pivots Display Names’ on the KPI configuration screen, enabling you to import all fields of a given KPI.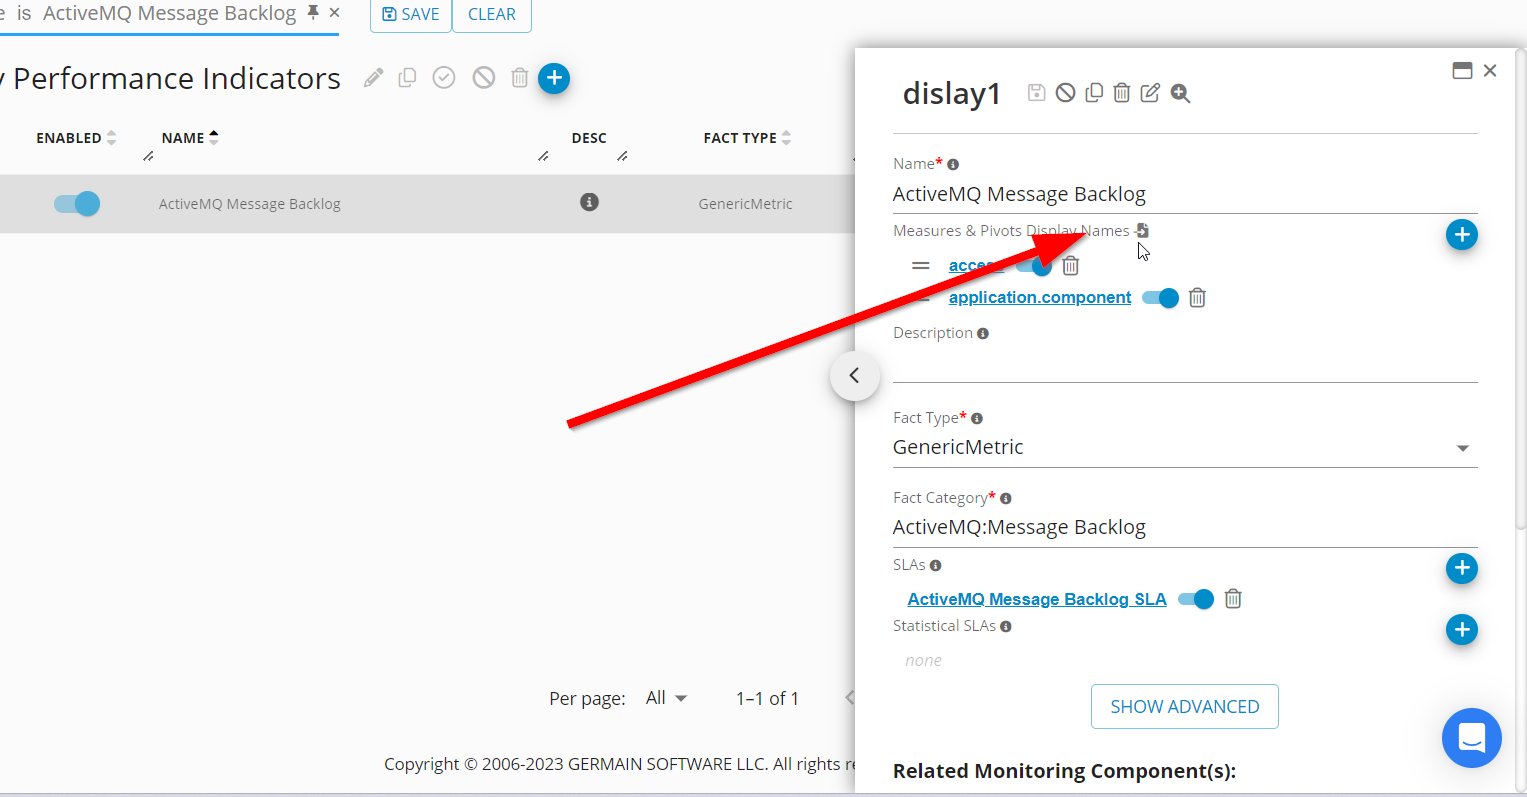
Import All Measures and Pivots Display Names on KPI screen - GermainUX
Lockable & refreshable RUM extension
Problem Users faced challenges with the correct usage of GermainUX - RUM Extension. Instances included users not using the correct version or accidentally disabling the extension. Solution/New Feature The GermainUX - RUM Extension now features lockable and refreshable capabilities.- Lockable: Prevents end users from modifying or removing Germain URLs, ensuring uninterrupted monitoring. The new flag in the distributed configuration secures the extension against unauthorized changes.
- Refreshable: A manual refresh button is now available, allowing users to refresh the list of monitored websites or web applications. This feature is particularly useful for testing, offering a quick refresh without modifying URLs or waiting for auto-refresh.
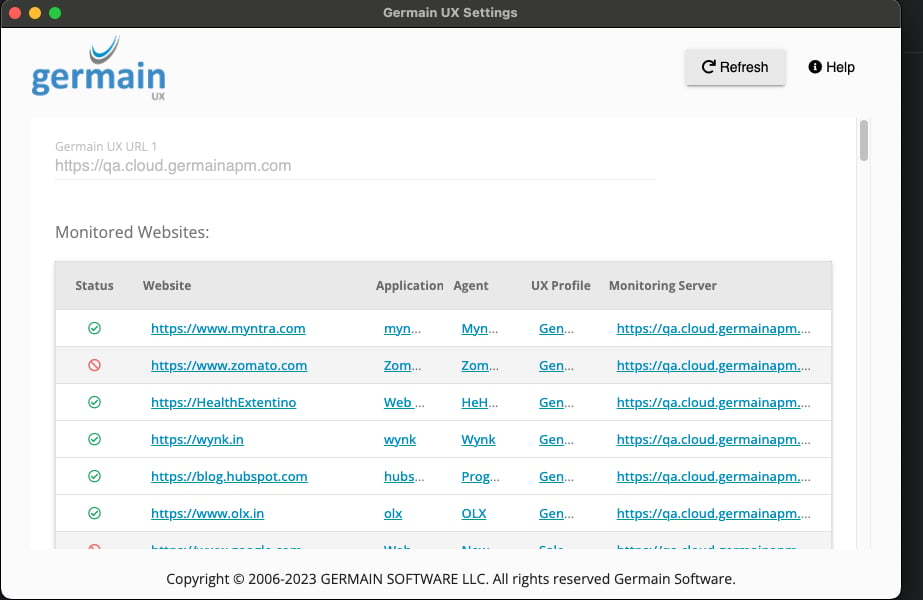
Lockable and Refreshable GermainUX - Browser Extension
Here are details on how to configure GermainUX - RUM Extension.
PingFederate OIDC authentication
Description PingFederate OIDC is now supported as a solution for implementing OAuth2-based authentication with GermainUX. Federated Single Sign-On (SSO) represents a more advanced version of traditional SSO. More details about PingFederate OIDC in GermainUX.React v18.0
Description Upgraded Germain’s user interface to React v18.0. More details on benefits provided in React 18.Sentinel
Description GermainUX’s Sentinel is the new self-monitoring component to ensure that GermainUX is up and running 24x7, and attempt to self-resolve any issues. More details about GermainUX’s Sentinel.Sortable pinned dashboards
Description It is now possible to quickly order currently pinned dashboards by simply dragging and dropping them, as shown below.
Reorder pinned dashboard - GermainUX
Marketplace
GermainUX approved on SFDC AppExchange!
Description The Salesforce Partner Team has officially approved GermainUX for public listing on its AppExchange Marketplace. GermainUX is now available on the SFDC AppExchange: https://appexchange.salesforce.com/appxListingDetail?listingId=a0N3A00000FAAYXUA5.GermainUX is now YouTube!
Description GermainUX is now on YouTube. Please check it out, subscribe, and like it 🙂 : https://youtube.com/@germainUX/Security Fixes
Download:
https://germain-apm.s3.us-west-2.amazonaws.com/GermainAPM/2023/GermainAPMEngine-2023.3-106-binary.tar.gz
https://germain-apm.s3.us-west-2.amazonaws.com/GermainAPM/2023/GermainAPMEngine-2023.3-106-binary.zip
https://germain-apm.s3.us-west-2.amazonaws.com/GermainAPM/2023/GermainAPMServer-2023.3-106-binary.tar.gz
https://germain-apm.s3.us-west-2.amazonaws.com/GermainAPM/2023/GermainAPMServer-2023.3-106-binary.zip
https://germain-apm.s3.us-west-2.amazonaws.com/GermainAPM/2023/GermainAPMService-2023.3-106-binary.tar.gz
https://germain-apm.s3.us-west-2.amazonaws.com/GermainAPM/2023/GermainAPMService-2023.3-106-binary.zip Docker:
public.ecr.aws/h0m9e4y5/germainapm-engines:2023.3-106
public.ecr.aws/h0m9e4y5/germainapm-server:2023.3-106
public.ecr.aws/h0m9e4y5/germainapm-services:2023.3-106
Get Help
Contact GermainUX Support
Can't find what you need?
The content of this document is proprietary to GERMAIN SOFTWARE.