
🚀 Salesforce Experience Cloud Monitoring, Analytics and Automation
GermainUX continuously monitors Salesforce Experience Cloud sites, portals, communities and storefronts, 24/7 and in real time. It helps organizations identify and resolve the user experience, journey, content, workflow and technology issues that reduce conversion, engagement, adoption, self-service success and customer satisfaction.
By combining Real User Monitoring, Session Replay, conversion analytics, customer journey analysis, process mining, application performance monitoring and automation, GermainUX helps teams understand not only what happened, but also why it happened, who was affected and what action should be taken. When appropriate and considered safe, remediation can also be automated.
🔎 How to Access GermainUX
GermainUX is available on the Salesforce AppExchange.
📈 Business Outcomes
GermainUX helps organizations using Salesforce Experience Cloud:
|
Outcome |
Details |
|---|---|
|
Increase conversion |
Increase conversion by identifying the journey steps, errors, delays and behavioral friction that cause visitors to abandon. |
|
Improve engagement |
Improve customer, partner and community engagement by understanding how visitors use content, features and services. |
|
Increase self-service success |
Increase self-service success by identifying failed searches, ineffective content and unresolved support journeys. |
|
Improve productivity |
Improve productivity by detecting inefficient workflows and quantifying the time lost by customers, partners, agents and employees. |
|
Reduce detection time |
Reduce the time required to detect, diagnose and resolve UX, journey and technology issues. |
|
Improve stability |
Improve site availability, performance, integration reliability and operational stability. |
|
Prioritize improvements |
Prioritize improvements according to the visitors affected and the resulting revenue or business impact. |
|
Proactive detection |
Detect emerging issues proactively and automate safe remediation workflows. |
🔍 What GermainUX Monitors
GermainUX provides visibility across the complete Salesforce Experience Cloud journey and supporting technology.
|
Area |
Examples of monitored activity |
|---|---|
|
Visitor experience |
Clicks, navigation, searches, forms, browser activity, errors, feedback and visitor sessions |
|
Conversion and engagement |
Journey progression, abandonment, content engagement, calls to action and conversion outcomes |
|
Self-service and productivity |
Search success, content effectiveness, workflow completion, delays, repeated actions and time lost |
|
Website performance |
Page loads, Core Web Vitals, browser freezes, resources, HTTP requests and mobile responsiveness |
|
Business processes |
Registration, onboarding, service, ordering, checkout, payment, fulfillment and other custom workflows |
|
Conversations |
Chat availability, response times, transfers, answers, sentiment and conversion outcomes |
|
Integrations |
Salesforce services, APIs, payment providers, inventory, fulfillment and other connected systems |
|
Marketing |
Campaign traffic, visitor segments, landing-page behavior, engagement and conversion performance |
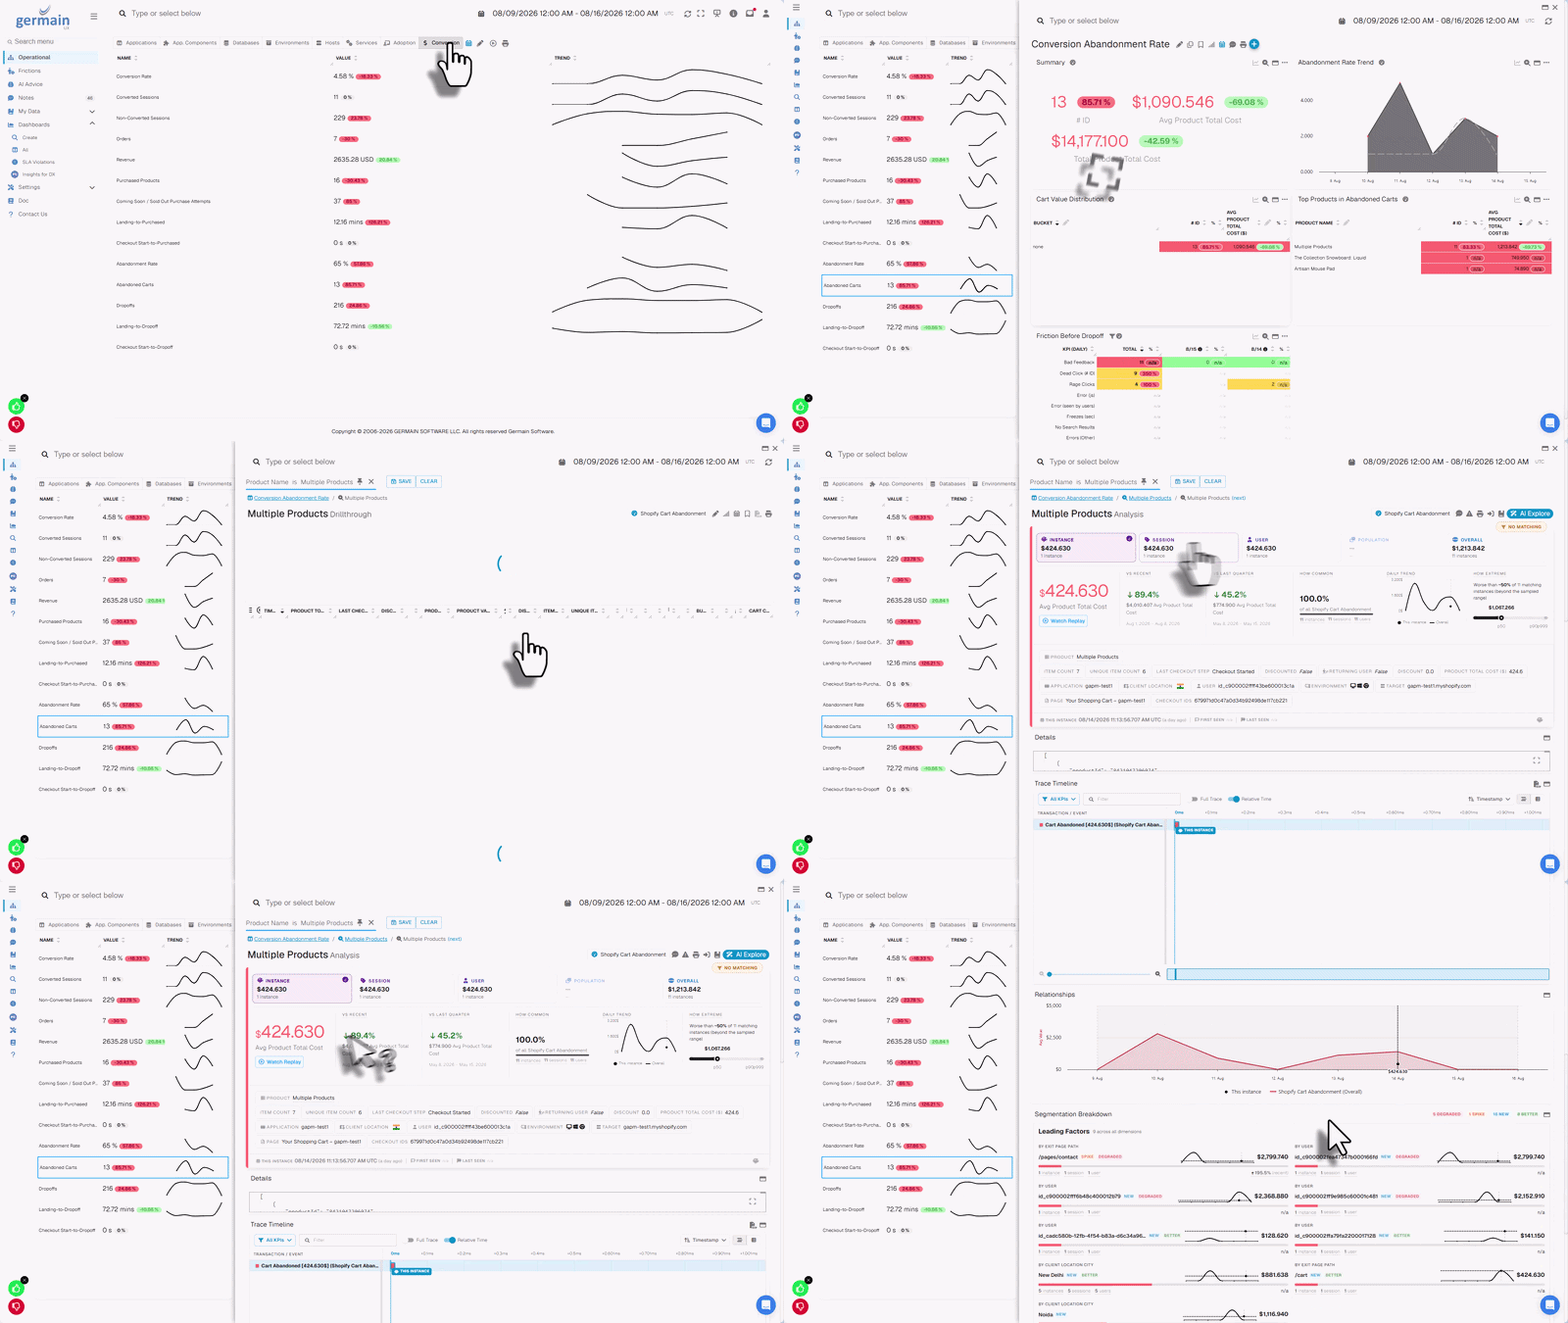
🎞 Real User Monitoring and Session Replay
GermainUX records real Salesforce Experience Cloud visitor activity with millisecond-level timing precision, helping teams quickly understand what visitors experienced and why an issue occurred.
Instead of reviewing hours of recordings, teams can search for specific visitors, actions, errors, pages, performance conditions or business events and replay the moments that matter. Session data and related business metadata remain searchable both across the visitor population and within individual sessions.
Capabilities include:
|
Capability |
Details |
|---|---|
|
Detailed recording |
Detailed recording and replay of real visitor sessions |
|
Correlation |
Correlation of visitor activity with errors, performance, journeys and transactions |
|
Search |
Search across visitors, sessions, actions and business metadata |
|
Friction identification |
Identification of behavioral, workflow and technology friction |
|
Heatmaps |
Six types of heatmaps for analyzing behavior at scale |
|
Privacy controls |
Privacy controls supporting the masking, anonymization or exclusion of sensitive data |
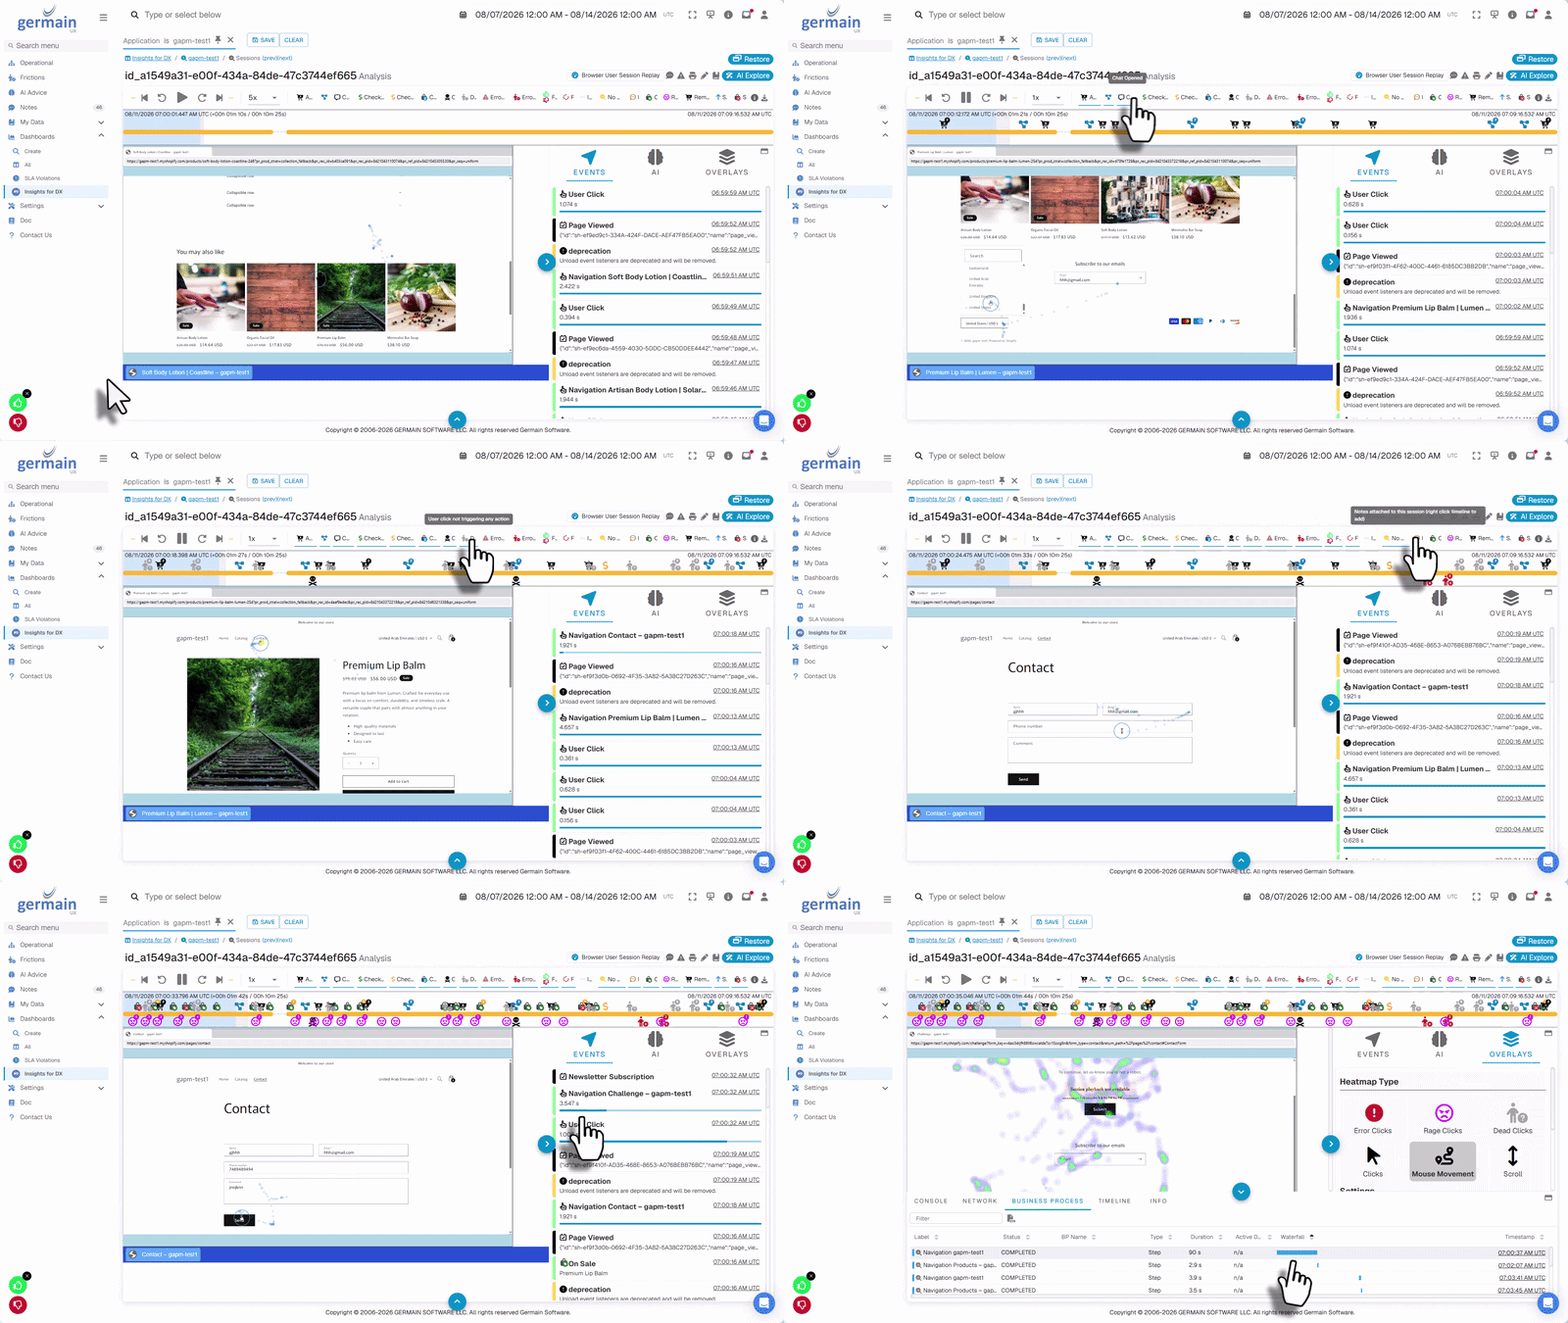
Learn more about Real User Monitoring and Session Replay.
 Behavioral Friction
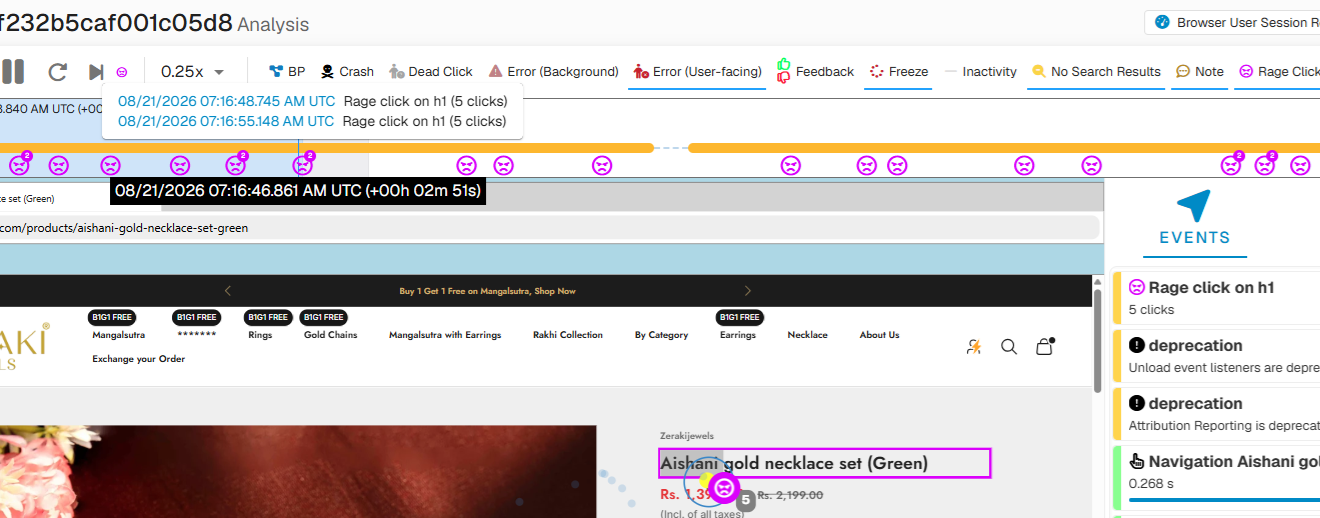
GermainUX helps identify behavior that may indicate confusing content, navigation problems or excessive process complexity, including repeated actions, abandonment and unexpectedly long task completion.
Qualitative evidence from Session Replay can be combined with quantitative analysis across visitors, pages, segments and journeys to determine how frequently a problem occurs and how much business impact it creates.
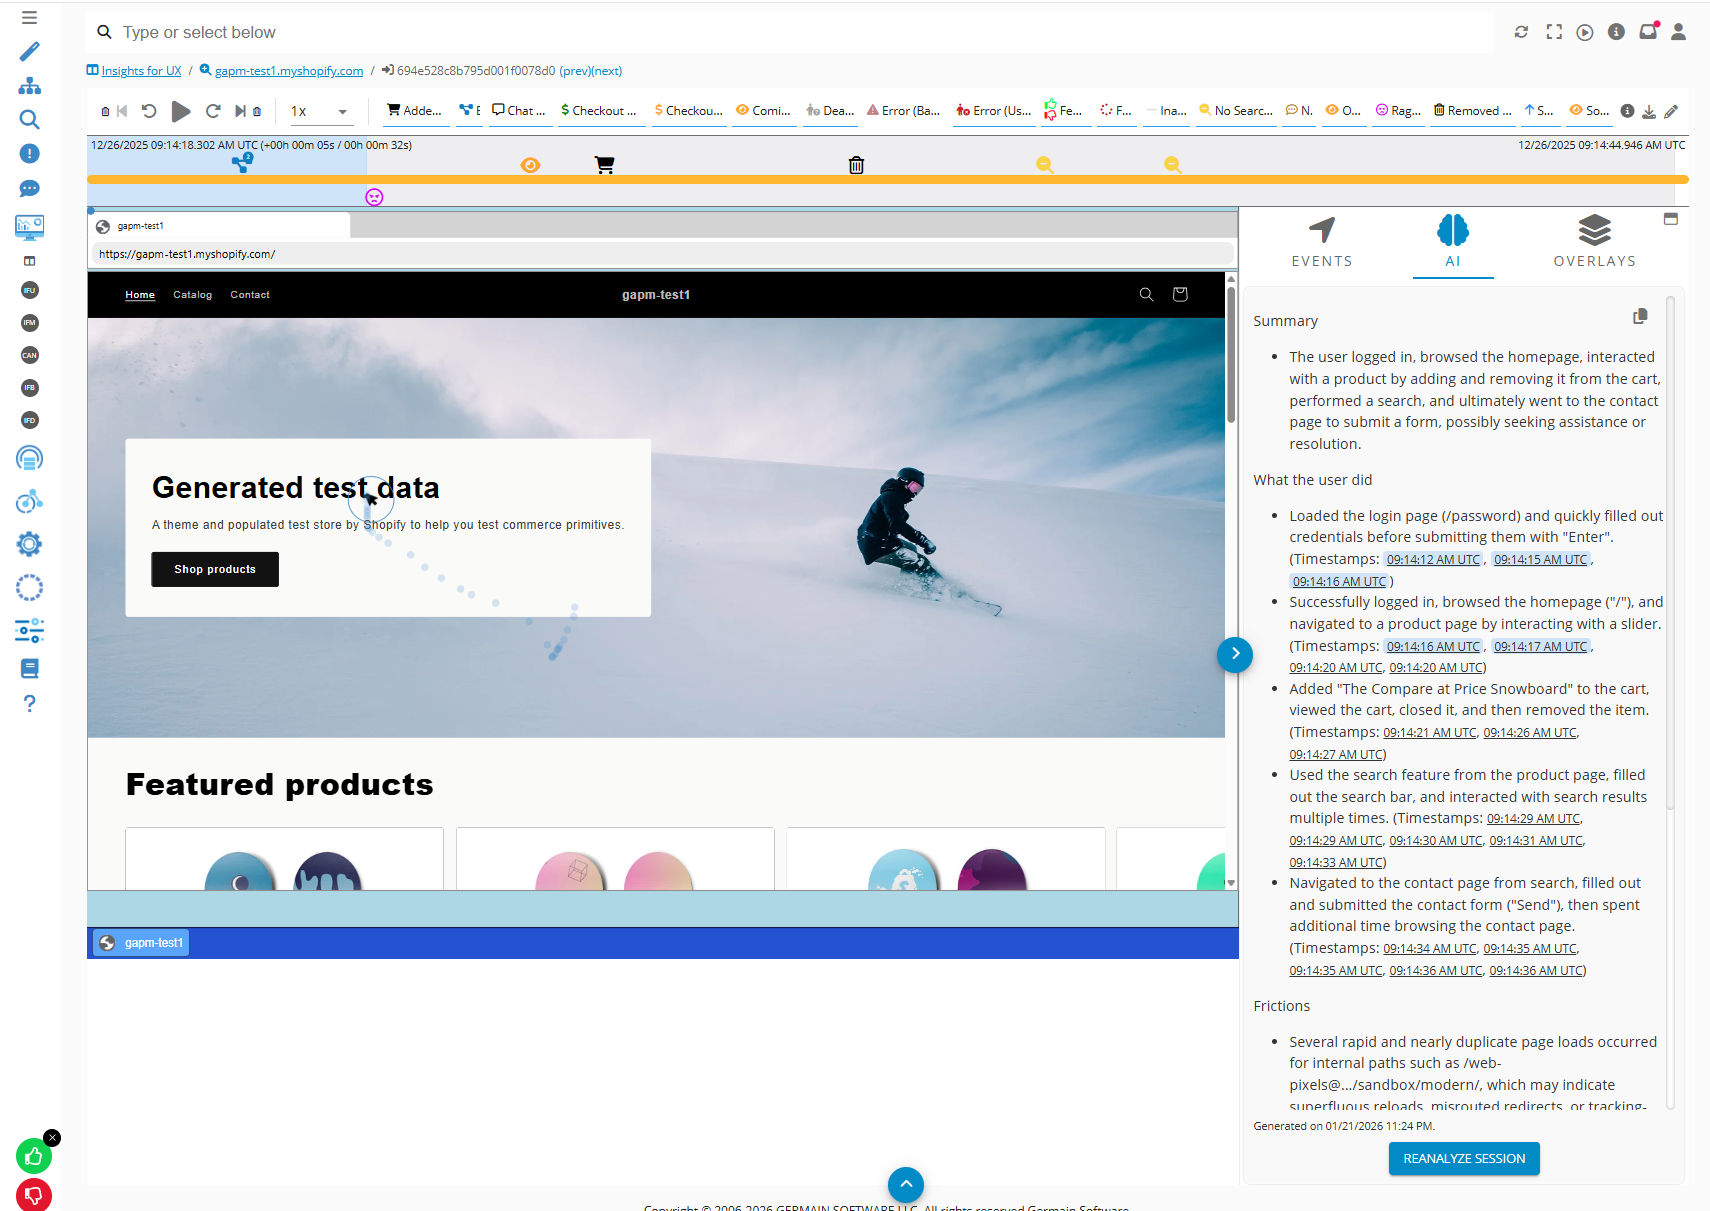
🤖 AI-Generated Session Summaries
GermainUX can summarize an individual visitor session so teams can understand what the visitor attempted to accomplish, where friction occurred and what may have prevented engagement, self-service or conversion.
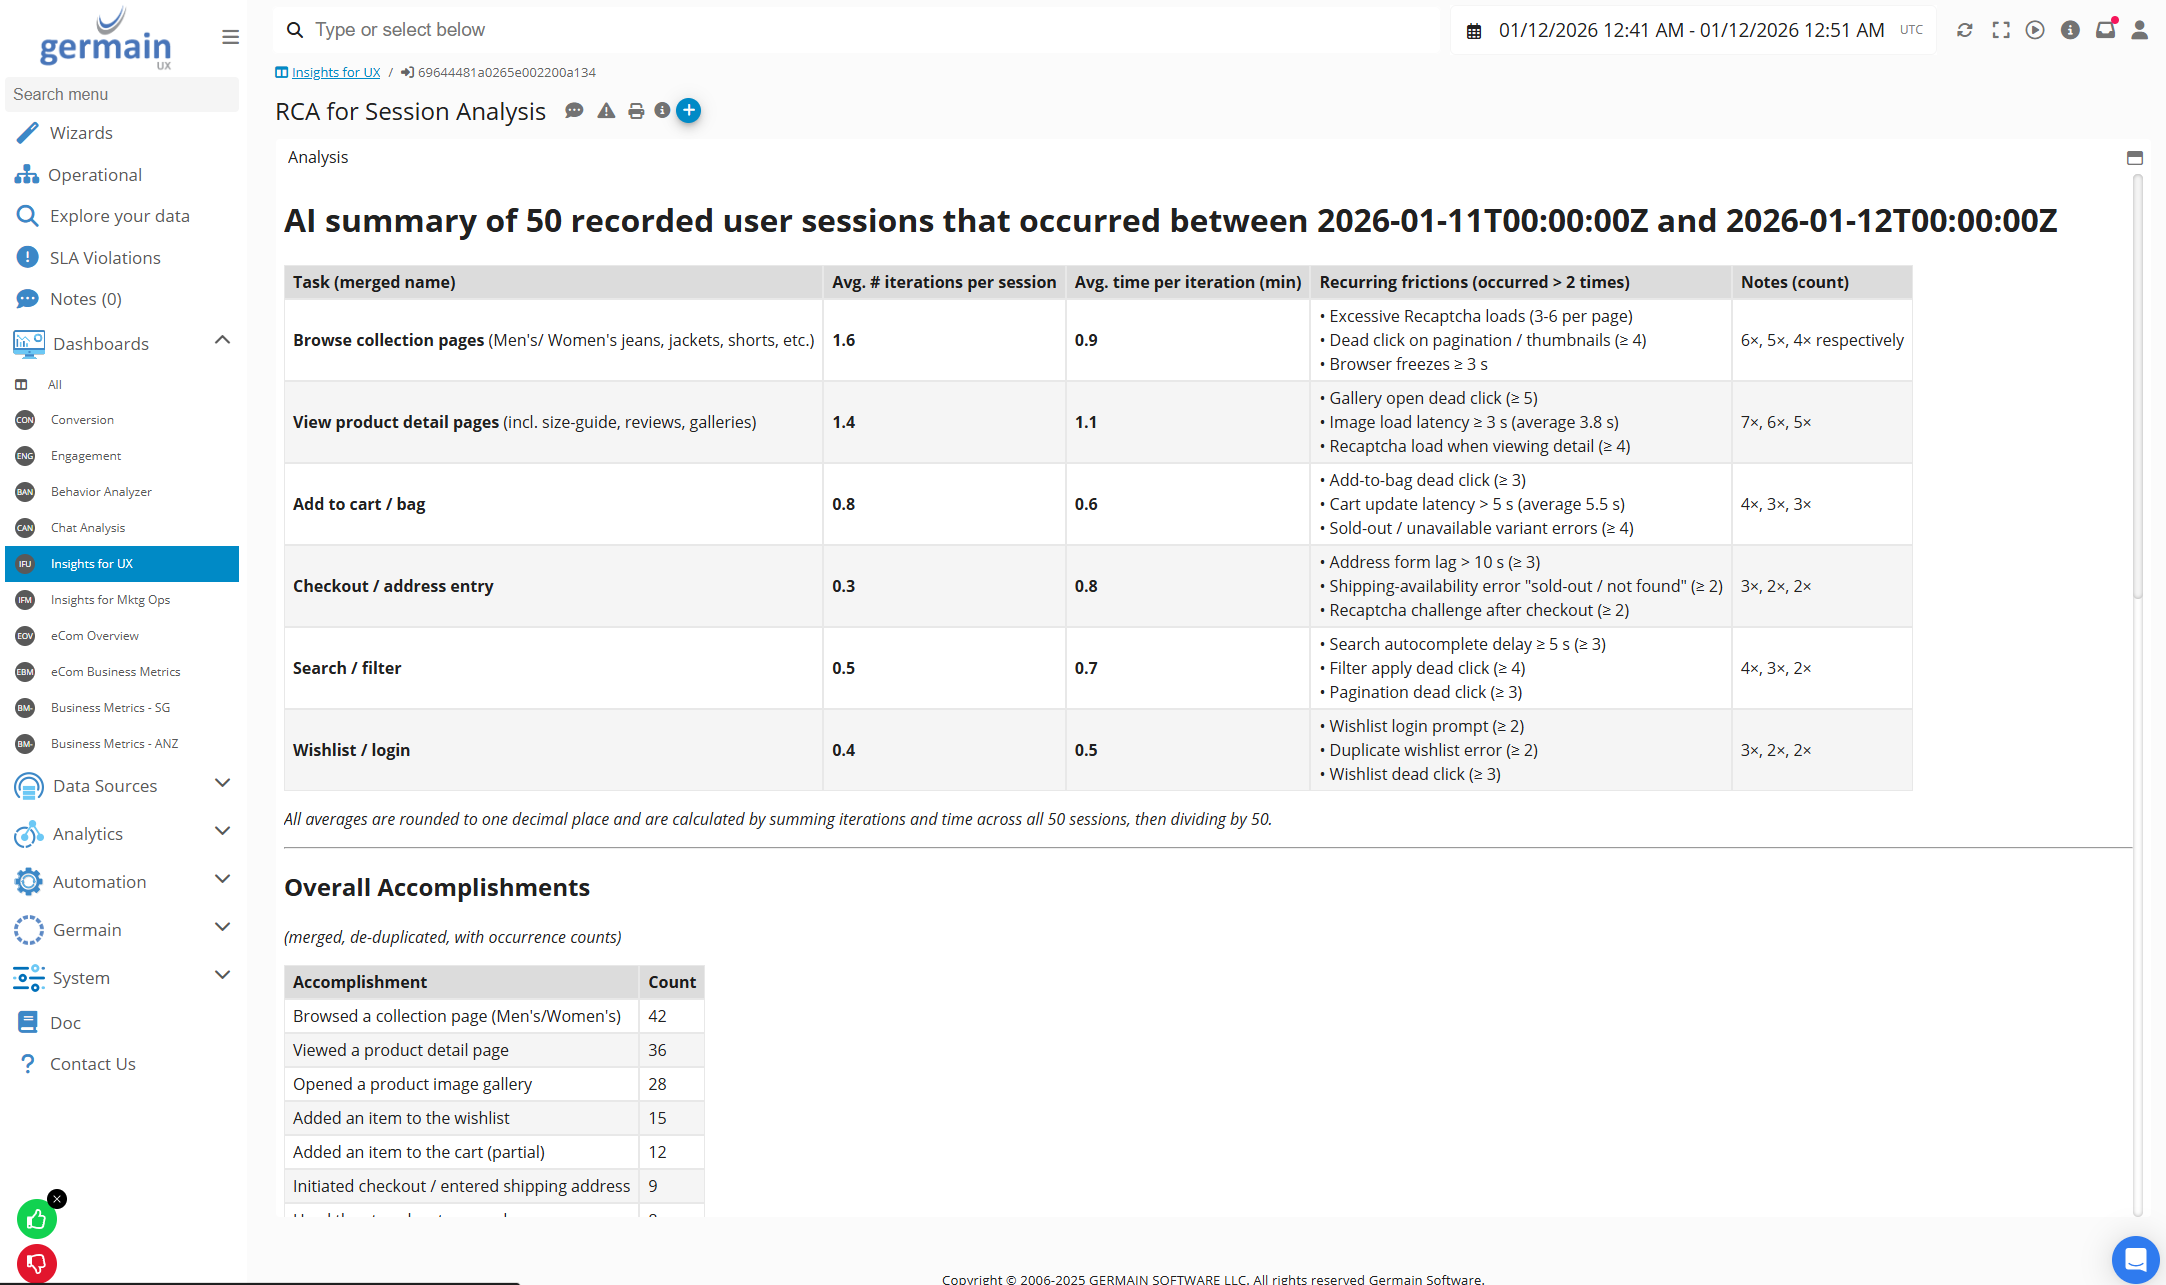
GermainUX can also analyze multiple sessions together to identify and rank the most frequent or consequential visitor experience issues, helping teams focus on improvements with the greatest impact.
AI Summary to Quickly Understand a User’s Experience in Salesforce Experience Cloud:
AI Analysis of Salesforce Experience Cloud User Sessions at Scale to Identify the Biggest Conversion Issues:
🌡️ Heatmaps
Six heatmap types help teams understand how individual visitors and larger audiences interact with pages, content and calls to action.
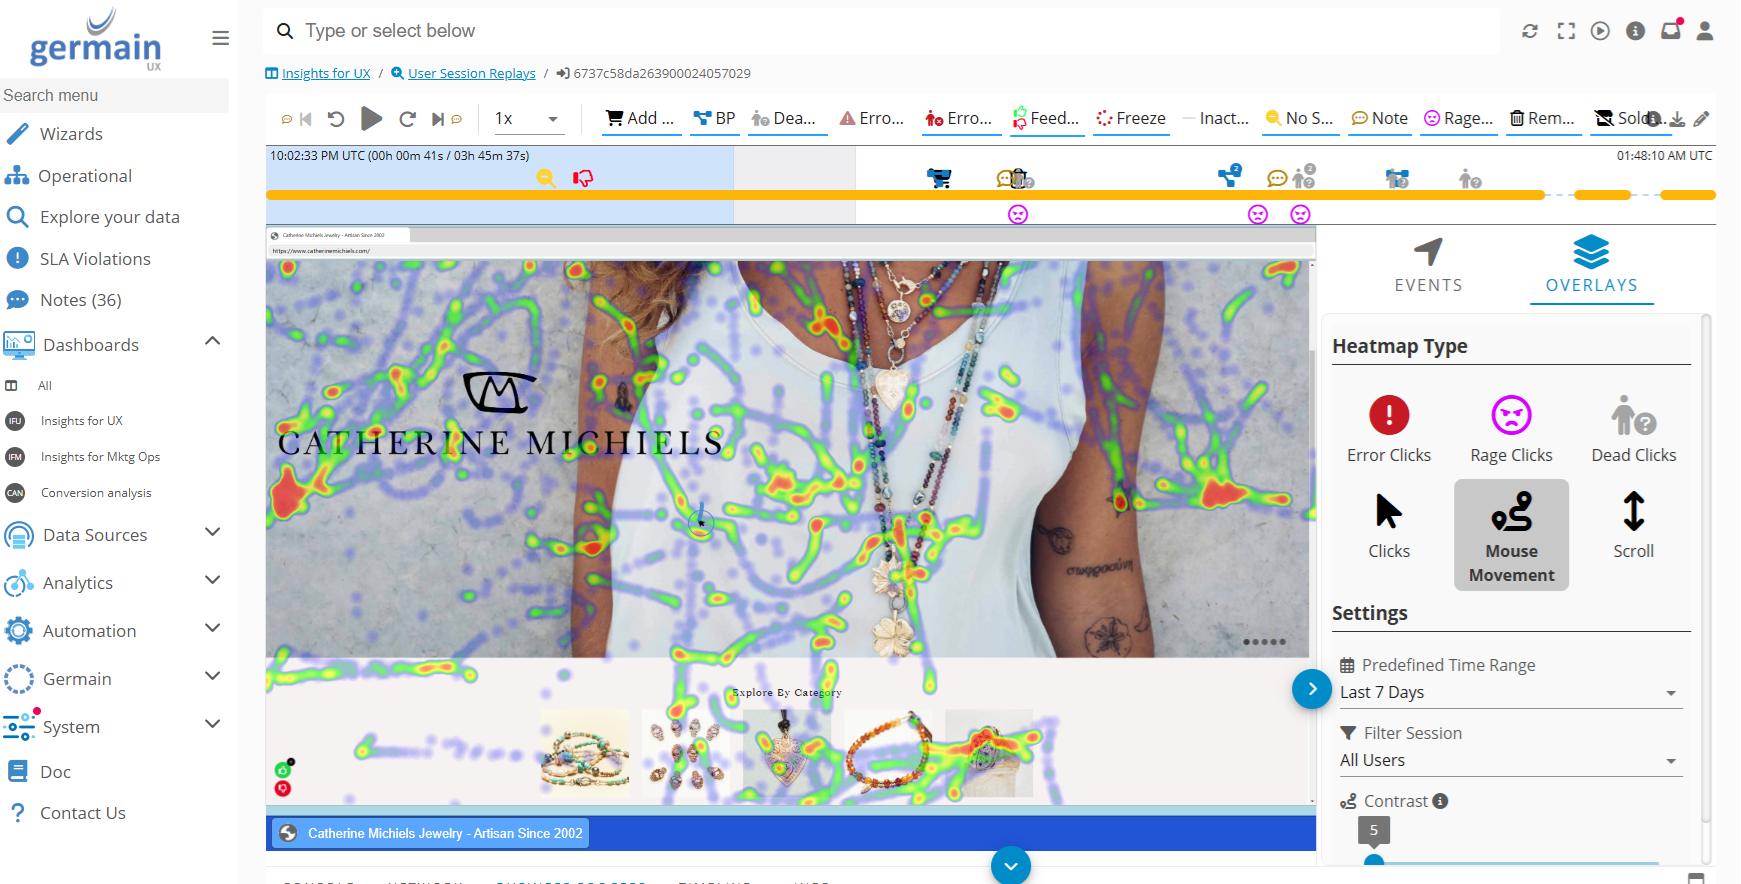
Learn more about GermainUX heatmaps.
💬 Visitor Feedback and NPS
The GermainUX Feedback Popup allows visitors to provide feedback directly within an Experience Cloud site. Responses can be analyzed across dashboards and alongside the corresponding recorded session, providing the behavioral and technical context needed to understand praise, complaints and unmet needs.
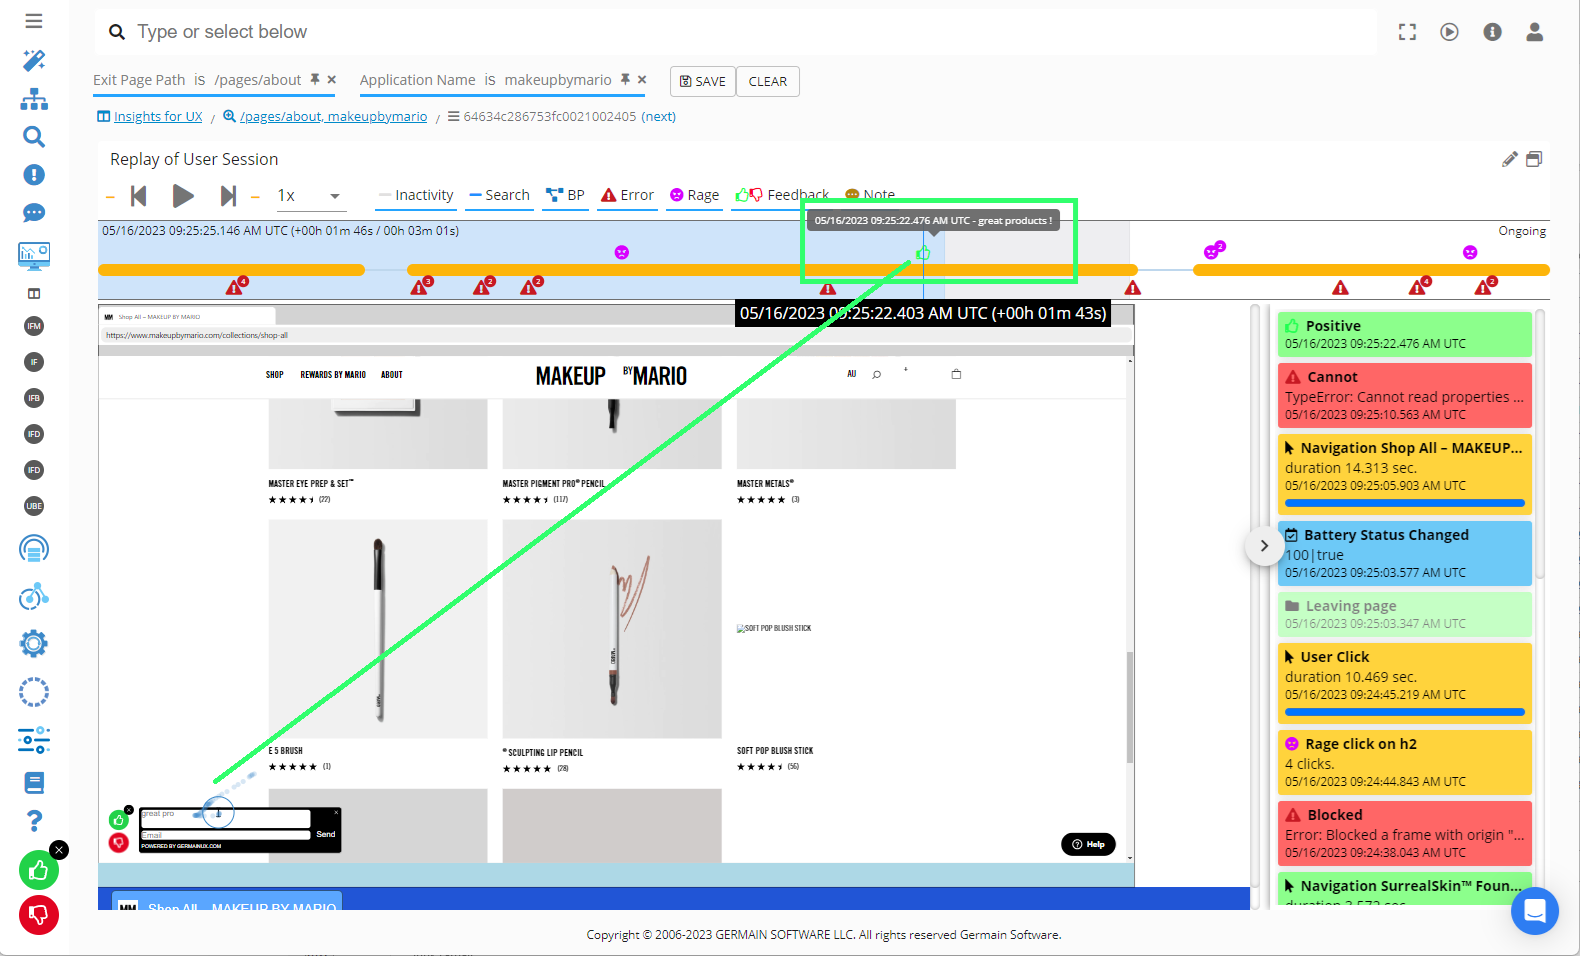
Learn more about the Feedback Popup.
🧭 Conversion Analytics and Customer Journey Analysis
GermainUX helps teams identify where visitors abandon, what friction preceded the abandonment and which problems create the greatest revenue or business impact.
Conversion analysis can segment results by dimensions such as:
|
Segment |
Examples |
|---|---|
|
Visitor type |
New versus returning visitors |
|
Customer type |
Customer, partner or community type |
|
Traffic source |
Traffic source and marketing campaign |
|
Content |
Page, content, product or service |
|
Journey stage |
Journey stage or workflow milestone |
|
Device & location |
Device, browser, geography or Experience Cloud site |
|
Technical & behavioral signals |
Errors, performance conditions and behavioral signals |
Teams can move from a conversion symptom to the affected segment, underlying issue and relevant Session Replay without manually combining evidence from separate tools.
More details on Conversion Insights.
🔗 End-to-End Customer Journeys
Customer and partner journeys often extend beyond Experience Cloud. GermainUX can analyze journeys that begin with a campaign or public website, continue through Experience Cloud and Salesforce workflows, and extend into payment, order fulfillment, delivery, support or other connected systems.
Examples include:
-
Browsing content or products
-
Registration and authentication
-
Completing forms or applications
-
Adding products to a cart
-
Checkout and payment
-
Opening or resolving a service request
-
Post-purchase or post-service activity
This helps teams understand where a journey becomes ineffective, why a visitor did not complete it and which corrective action should be prioritized.
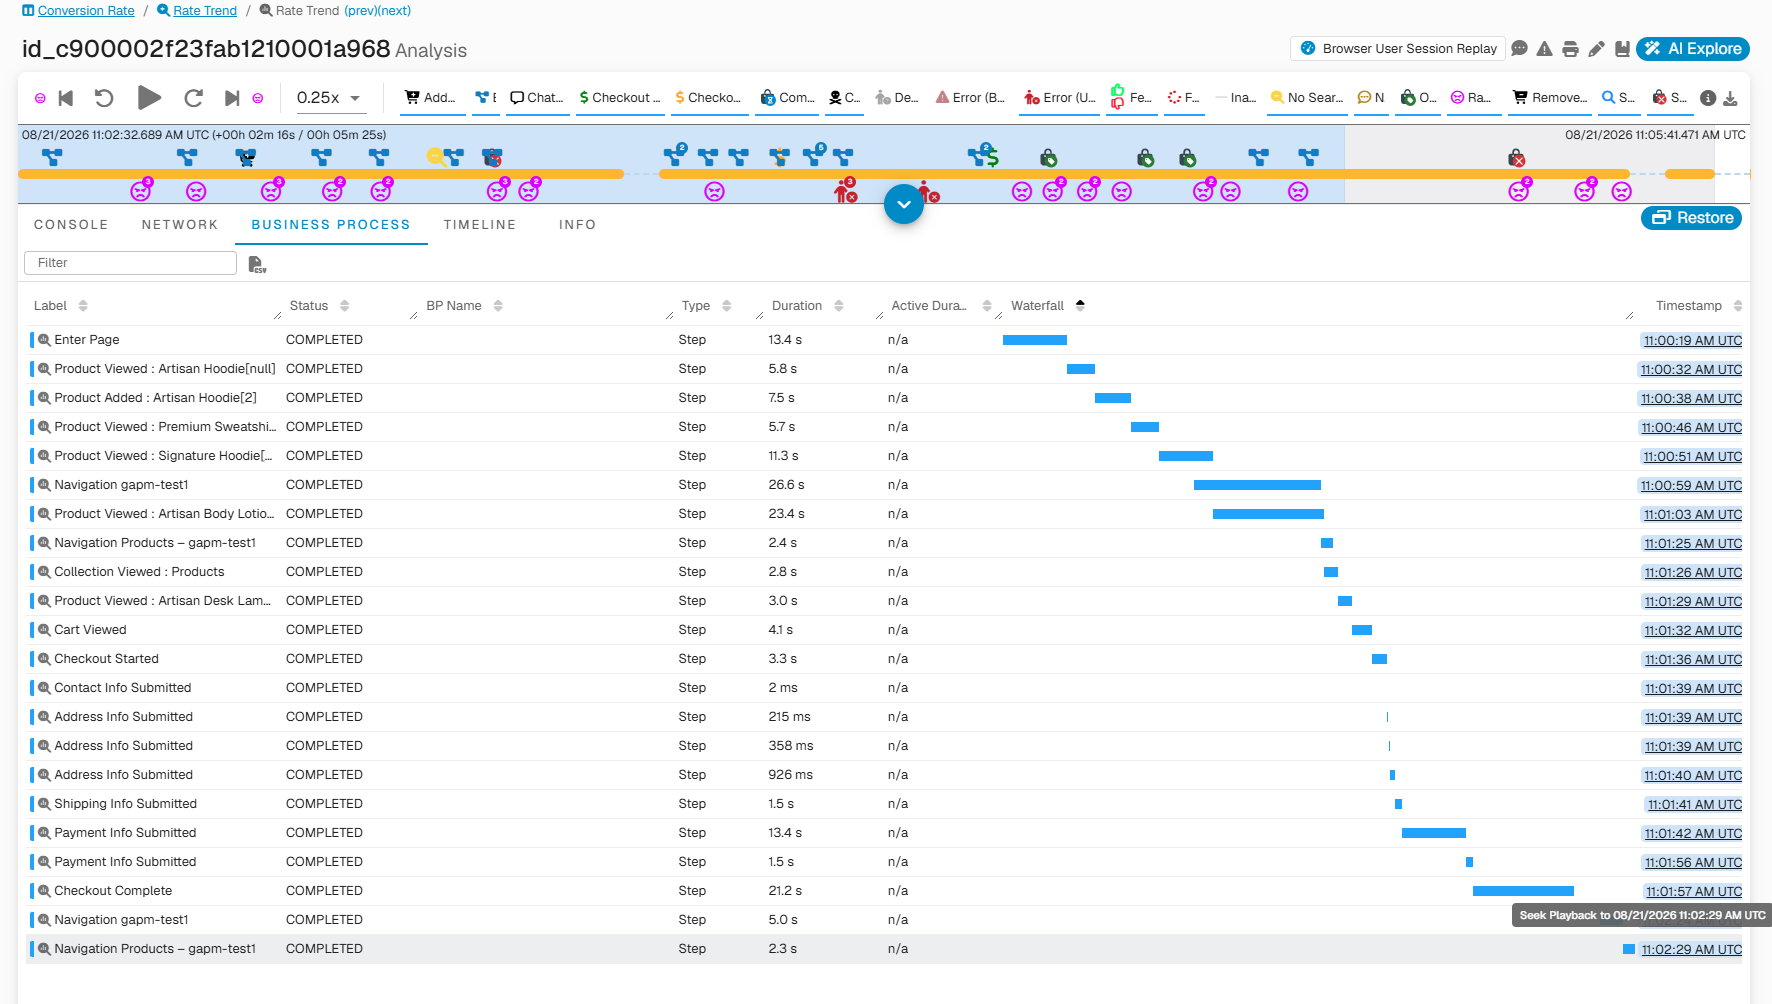
More details on Journey Analysis.
⚙️ Business Process Mining
GermainUX monitors and analyzes the workflows and business processes that run through Salesforce Experience Cloud and connected systems. It identifies errors, delays, bottlenecks and excessive completion time and quantifies their effect on visitors and business operations.
Insights can include:
-
Inefficient or incomplete workflows
-
Process bottlenecks and delays
-
Excessive process complexity
-
Repeated or unnecessary actions
-
Productivity losses and wasted time
-
Visitor groups, pages or milestones disproportionately affected
🛒 Commerce and Service Processes
For Experience Cloud implementations supporting commerce or service workflows, GermainUX can monitor processes such as:
|
Process |
Examples of monitored outcomes |
|
Inventory |
Stock availability, low-inventory conditions and restocking dependencies |
|
Order processing |
Placement, payment, inventory allocation, fulfillment and shipment tracking |
|
Checkout and payment |
Completion, customer-facing errors, payment-provider latency and abandonment |
|
Registration and onboarding |
Form completion, validation issues, delays and drop-off |
|
Self-service support |
Search success, article usefulness, case creation and resolution journeys |
Learn more about Business Process Monitoring.
🗣️ Online Chat and Conversation Analysis
GermainUX helps organizations understand why a customer or partner conversation did not produce the intended outcome.
Chat and conversation analysis can help answer:
|
Question |
Purpose |
|---|---|
|
Did the visitor successfully initiate a chat? |
Did the visitor successfully initiate a chat? |
|
Agent availability |
Was an agent available, and how long did the visitor wait? |
|
Transfers |
Was the visitor transferred or required to repeat information? |
|
Answer quality |
Were the visitor’s questions answered accurately and completely? |
|
Content discovery |
Did the visitor find the content or product being sought? |
|
Chatbot efficacy |
Did a chatbot recommend the right article or next action? |
|
Conversation outcomes |
Did the conversation result in conversion, self-service success or escalation? |
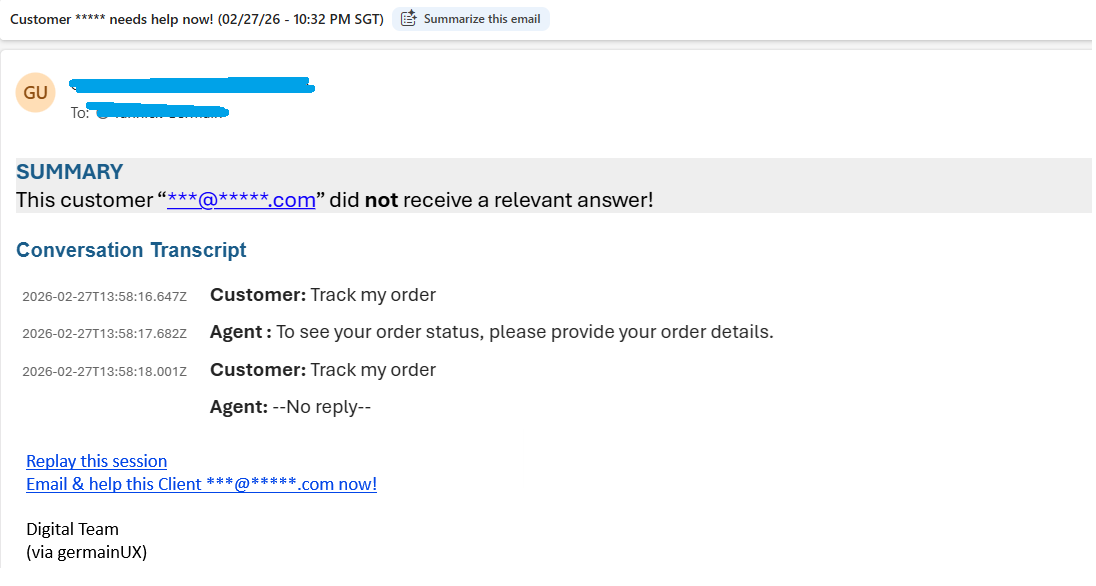
When message collection is enabled and permitted by the organization’s privacy and compliance requirements, GermainUX can analyze conversation content to detect sentiment, intent, unanswered questions and recurring friction patterns.
Conversation evidence can be correlated with the visitor’s Experience Cloud session, journey, page activity and technical conditions. The resulting insights can also help teams improve chatbot content, knowledge articles, agent workflows and staffing.
Analyze Salesforce Experience Cloud Chatbot Conversations in Real Time:
More details about Chat Analysis.
🎯 Marketing Campaign Performance
GermainUX connects campaign traffic with the actual Experience Cloud behavior and outcomes that follow. This helps marketing and growth teams determine which campaigns attract valuable visitors, where those visitors encounter friction and which experiences produce conversion or engagement.
Analysis can include:
|
Analysis |
Examples |
|---|---|
|
Campaign performance |
Campaign and traffic-source performance |
|
Landing-page |
Landing-page engagement and abandonment |
|
Visitor behavior |
Visitor behavior after arrival |
|
Conversion |
Conversion and journey completion |
|
Performance issues |
Performance or errors affecting specific campaigns |
|
Audience differences |
Differences across audiences, devices and geographies |
Review the preconfigured GermainUX Marketing KPIs.
🌐 Website Performance, Availability and Technology Analysis
GermainUX monitors the browser experience and observable technology supporting Salesforce Experience Cloud. This helps teams identify whether slow pages, failed requests, third-party services or connected Salesforce processes are affecting visitors.
✅ Website Availability
GermainUX can monitor site and page availability and validate critical links or user scenarios. Alerts notify the appropriate teams when an Experience Cloud site, page or essential workflow becomes unavailable.
⏱️ Page and Resource Performance
Performance monitoring can include:
-
Page load times
-
Core Web Vitals
-
Resource loading
-
Browser freezes
-
HTTP & network
-
Transaction time
These metrics can be correlated with visitor behavior, abandonment and conversion to distinguish technical noise from issues that materially affect the business.
📊 Traffic and Visitor Analytics
GermainUX provides preconfigured web analytics KPIs for analyzing visitor volume, behavior, traffic sources, popular pages and conversion outcomes.
Review the preconfigured Web Analytics KPIs.
📱 Mobile Experience
GermainUX can segment performance, errors, behavior and conversion by device and screen characteristics. This helps teams identify experiences that work on desktop but create friction for mobile visitors.
🔌 Integration Monitoring
Experience Cloud journeys often depend on Salesforce services and third-party systems. GermainUX can monitor observable integration activity to identify failures and latency involving APIs, payment providers, inventory systems, identity services, fulfillment platforms and other connected services.
The depth of monitoring depends on the endpoint, available telemetry and instrumentation deployed in connected systems.
🐛 Error Analysis and Business Impact
GermainUX continuously monitors errors affecting Experience Cloud visitors, journeys, integrations and business operations. Analysis helps teams distinguish:
-
New vs recurring
-
User-facing vs backend
-
High-impact vs noise
-
Isolated vs widespread
-
Technical vs validation
Errors can be correlated with affected visitors, sessions, pages, journeys, conversions and supporting technical activity. This helps teams prioritize the errors that directly affect customers and business outcomes instead of treating every logged error as equally important.
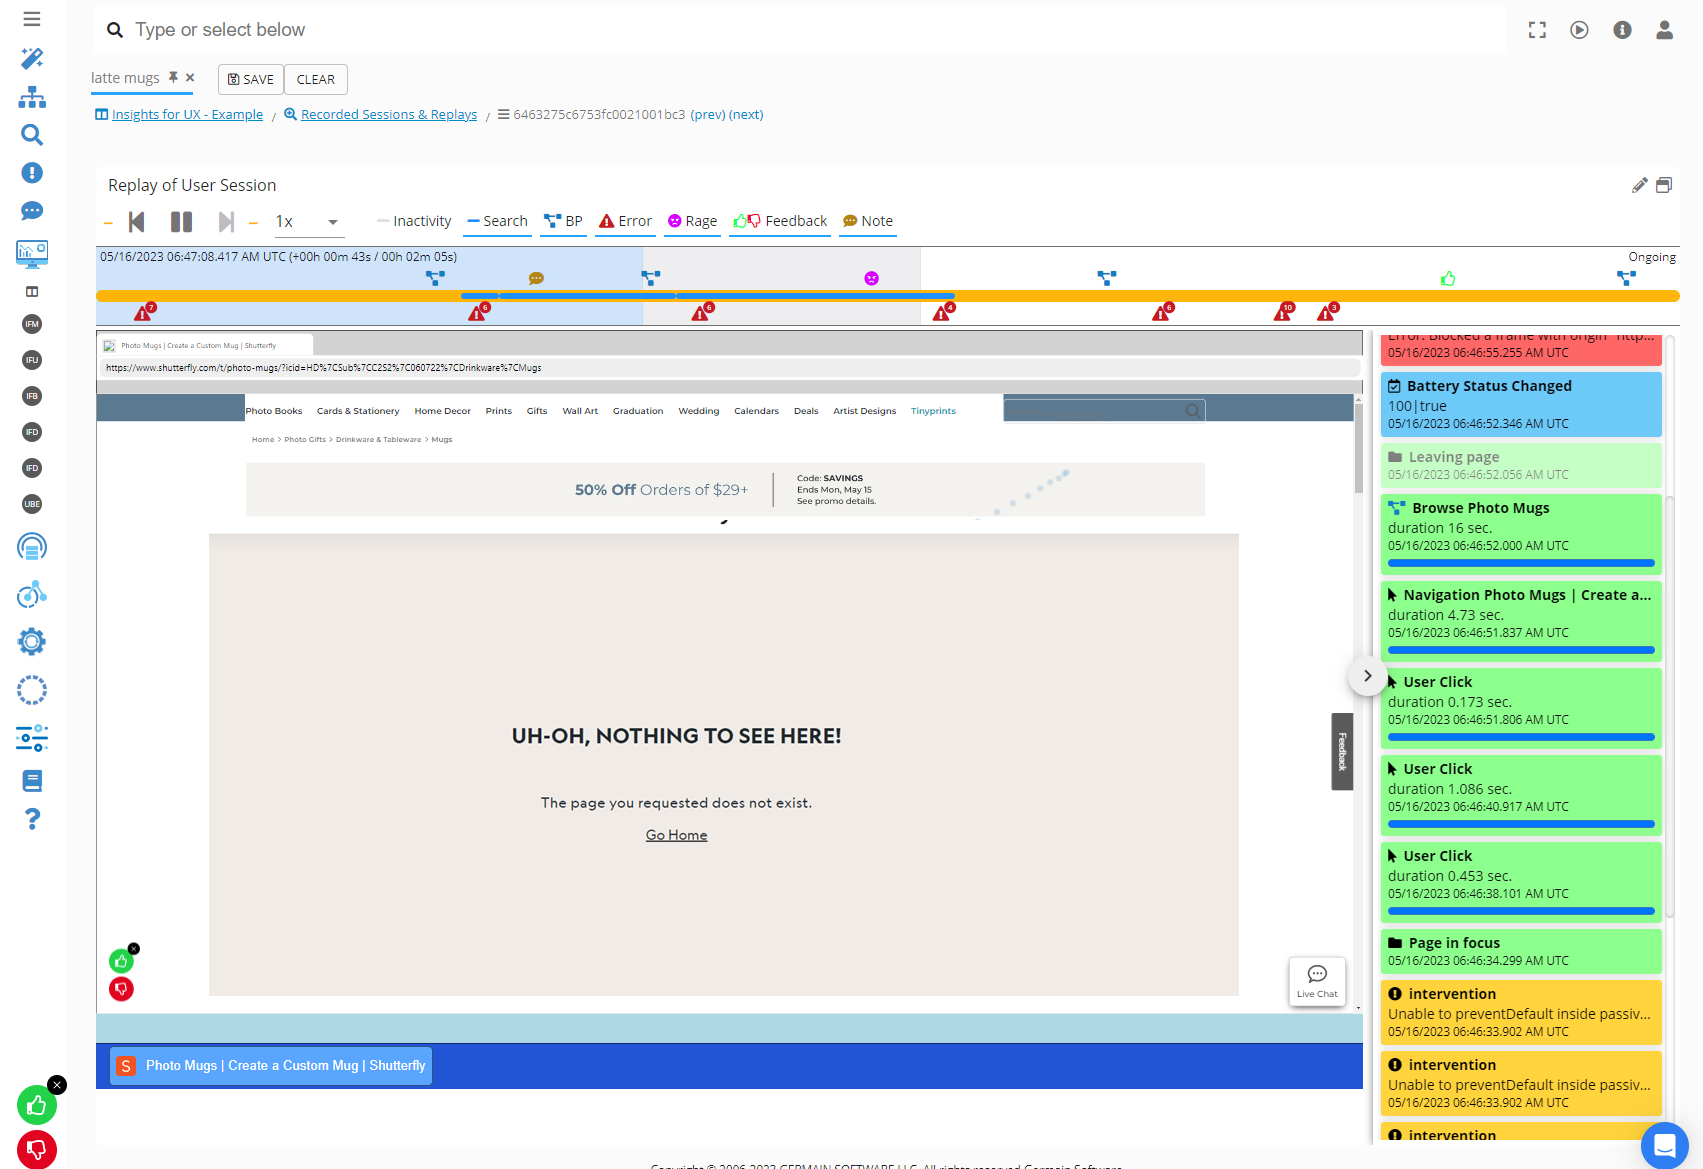
Learn more about measuring the business impact of errors.
🧠 AI-Assisted Analysis
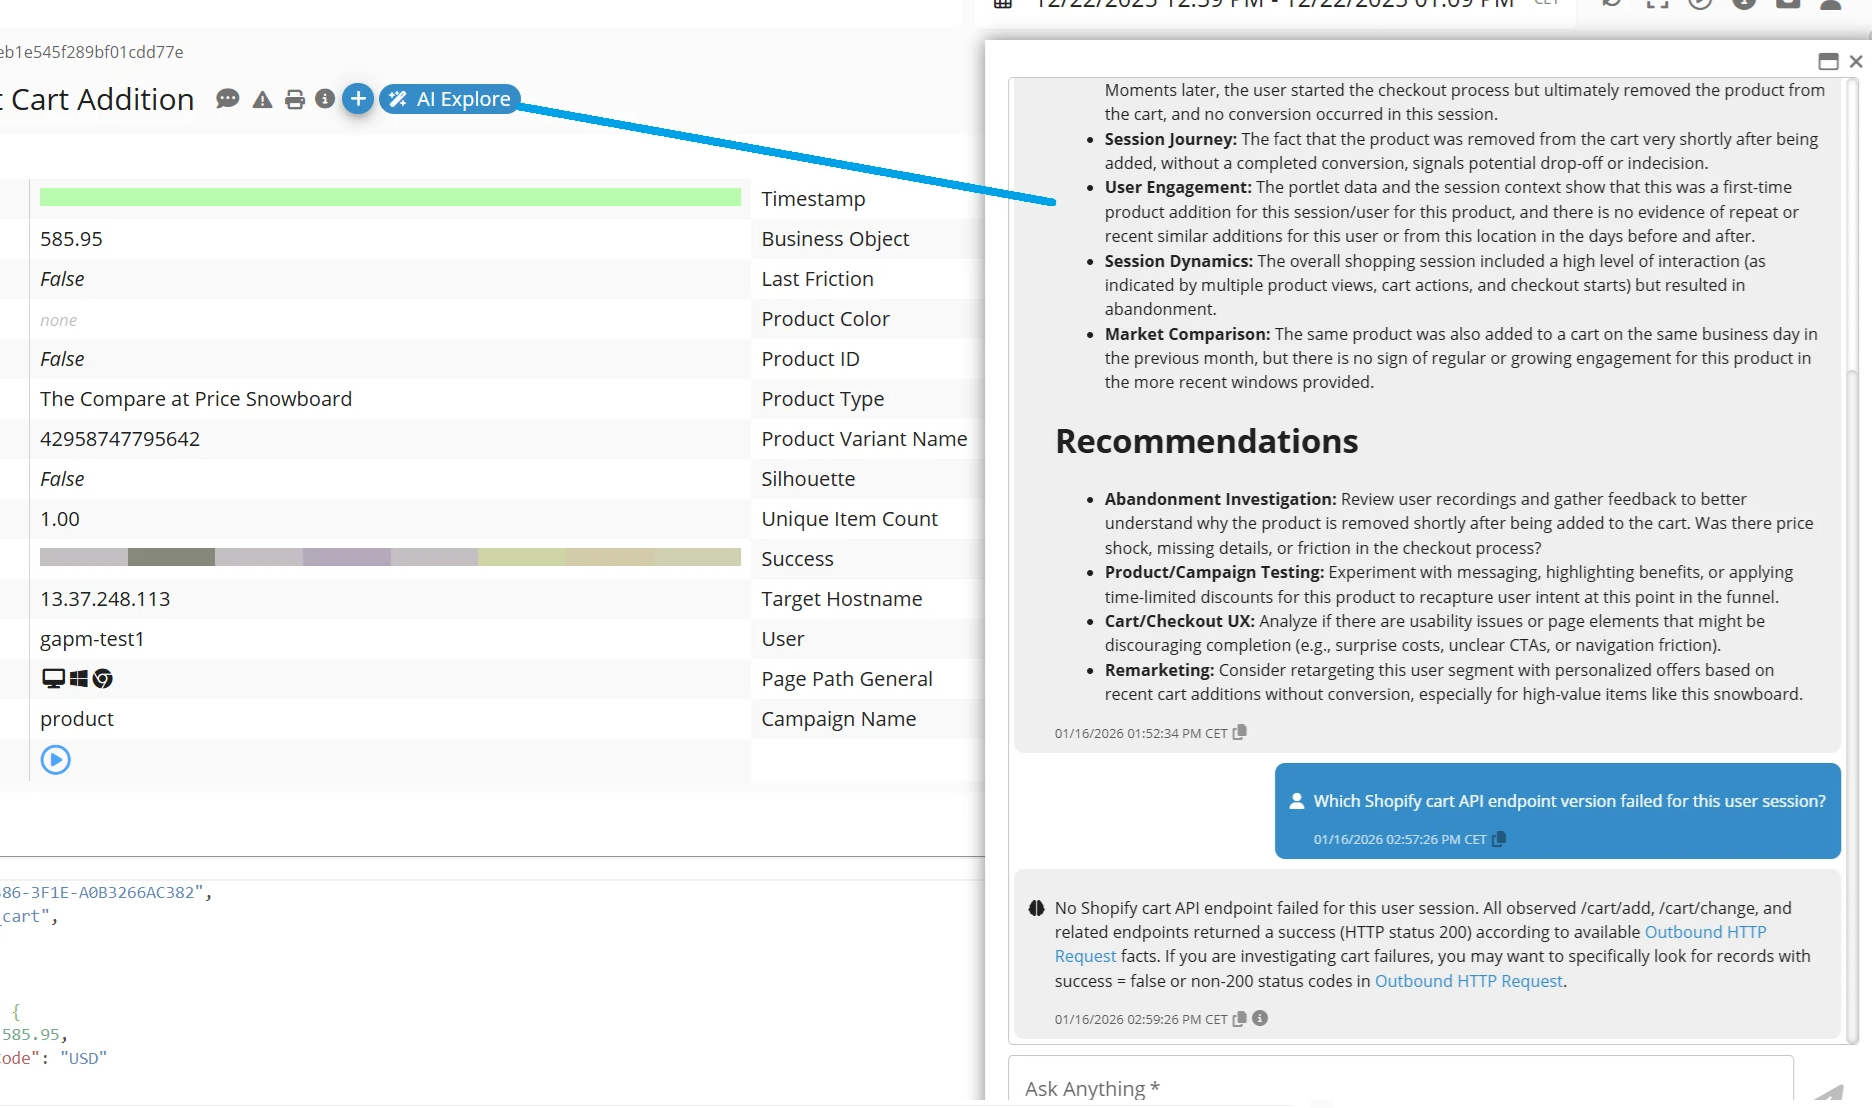
AI Explore allows teams to ask natural-language questions about visitor experience, conversion, engagement, productivity, journeys and technology issues. It is available across preconfigured and custom KPIs and can analyze relationships across multiple KPIs.
GermainUX also assists teams by:
|
Assistance |
Examples |
|---|---|
|
Detect anomalies |
Detecting anomalies and outliers |
|
Identify friction |
Identifying friction across behavior, workflows and technology |
|
Summarize sessions |
Summarizing individual or multiple visitor sessions |
|
Categorize |
Categorizing errors and conversations |
|
Identify segments |
Identifying the segments and journeys most affected |
|
Recommend actions |
Recommending areas for further investigation or corrective action |
AI-generated findings should support—not replace—appropriate business, operational and technical review.
🔔 Alerts, Proactive Detection and Automated Remediation
GermainUX can turn monitoring and analysis into action through:
|
Automation |
Purpose |
|
Real-time alerts |
Notify the appropriate teams when an issue or SLA violation occurs |
|
Synthetic monitoring |
Execute visitor journeys proactively to detect issues before they affect real users |
|
Anomaly detection |
Identify unusual behavior, spikes, drops and outliers |
|
Guided investigation |
Provide direct access to relevant analysis, evidence and AI Explore |
|
Automated remediation |
Execute approved recovery or data-correction workflows when automation is considered safe |
Examples can include updating incorrect data, initiating an operational workflow or restarting a connected system under defined and controlled conditions.
🔒 Security and Privacy
Security and privacy controls help restrict access to sensitive Experience Cloud data and support organizational requirements such as GDPR. Depending on the deployment, sensitive information can be masked, anonymized or excluded from collection.
The monitoring of conversations, personal information, payment-related journeys and authenticated portal activity depends on the organization’s permissions, retention policies, consent requirements and configured privacy controls.
Learn more about GermainUX Data Privacy and Security.
📦 Additional Resources
-
Deployment monitoring or automation for Salesforce Experience Cloud
-
Configure monitoring or automation for Salesforce Experience Cloud
-
AI Insights & Recommendations
-
More Analytics Features
-
More Automation Features
-
Management Features.
ℹ️ Get Help
The Germain Team can help you set this up. Contact GermainUX Support.
Component: Engine, JS Profiler, Mobile App, RPA Bot Recorder, RUM JS
Feature Availability: 2018.1 or later