Feature
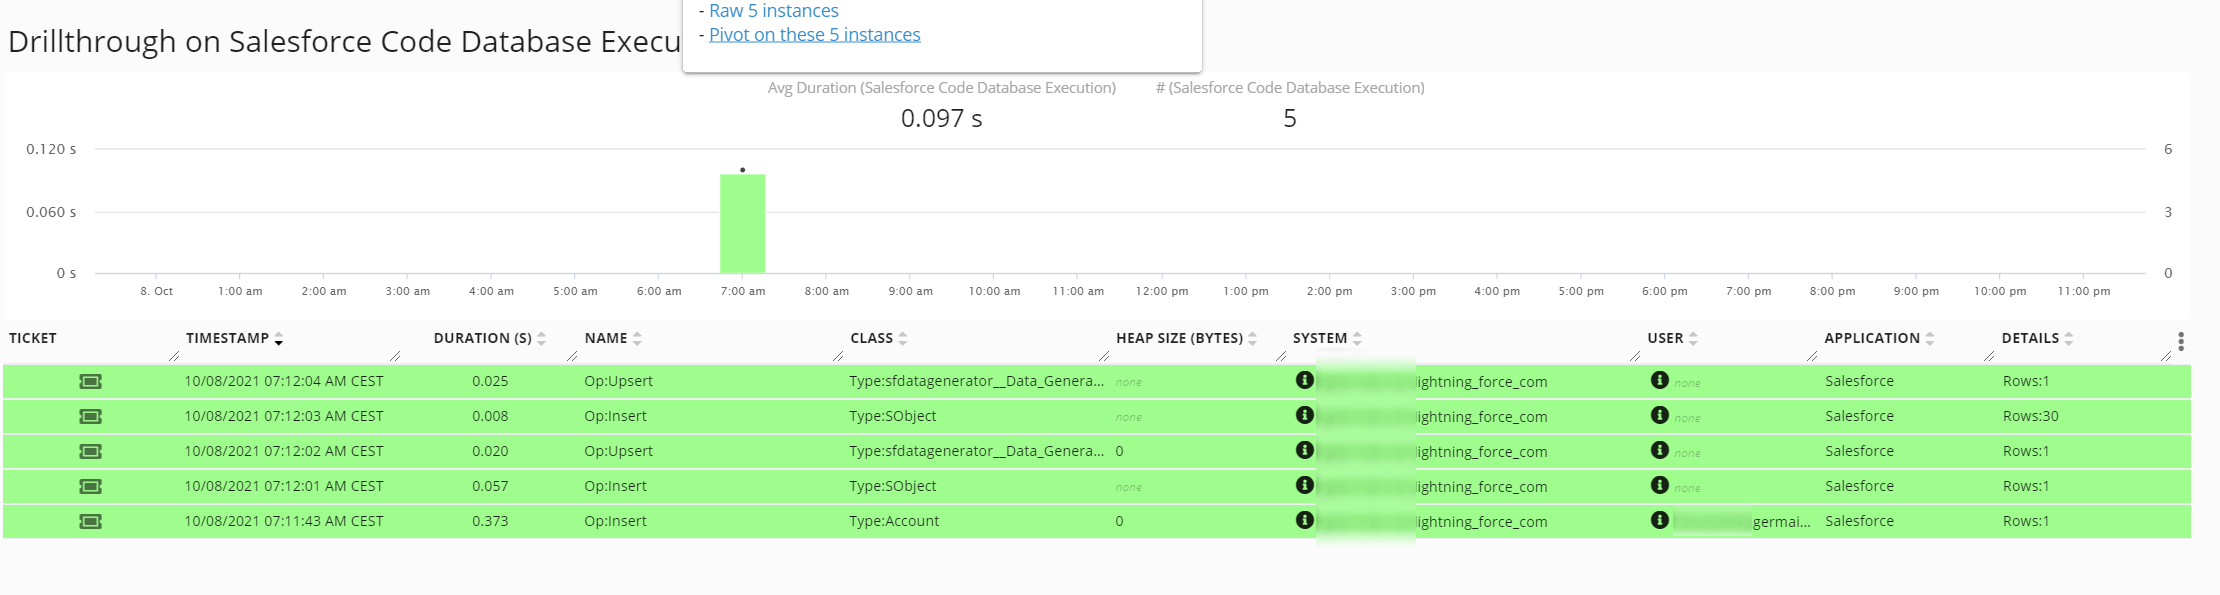
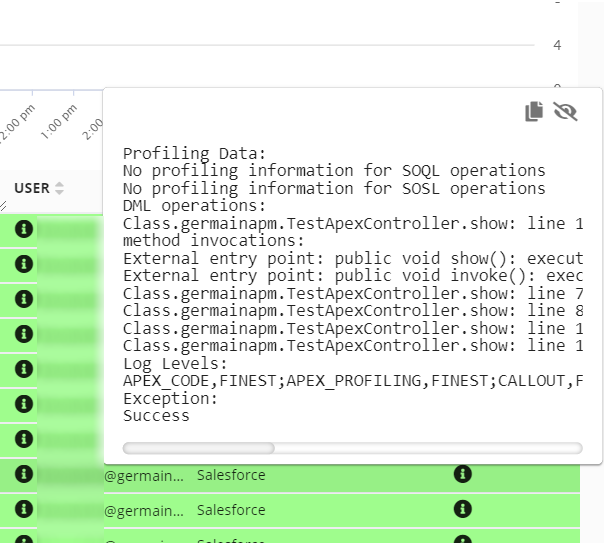
Here are details on how to configure Germain UX to monitor Salesforce Debug Logs. This monitoring collects events and metrics for:
-
Exceptions
-
Custom events
-
Visual force, database, SOQL, and code unit executions
Configure
Enable
This monitoring is enabled when you deploy Salesforce monitoring using the Salesforce Application wizard.
Disable
Follow these steps to disable ongoing Salesforce Instance Status monitoring:
-
Go to Germain Workspace.
-
Access the Left Menu.
-
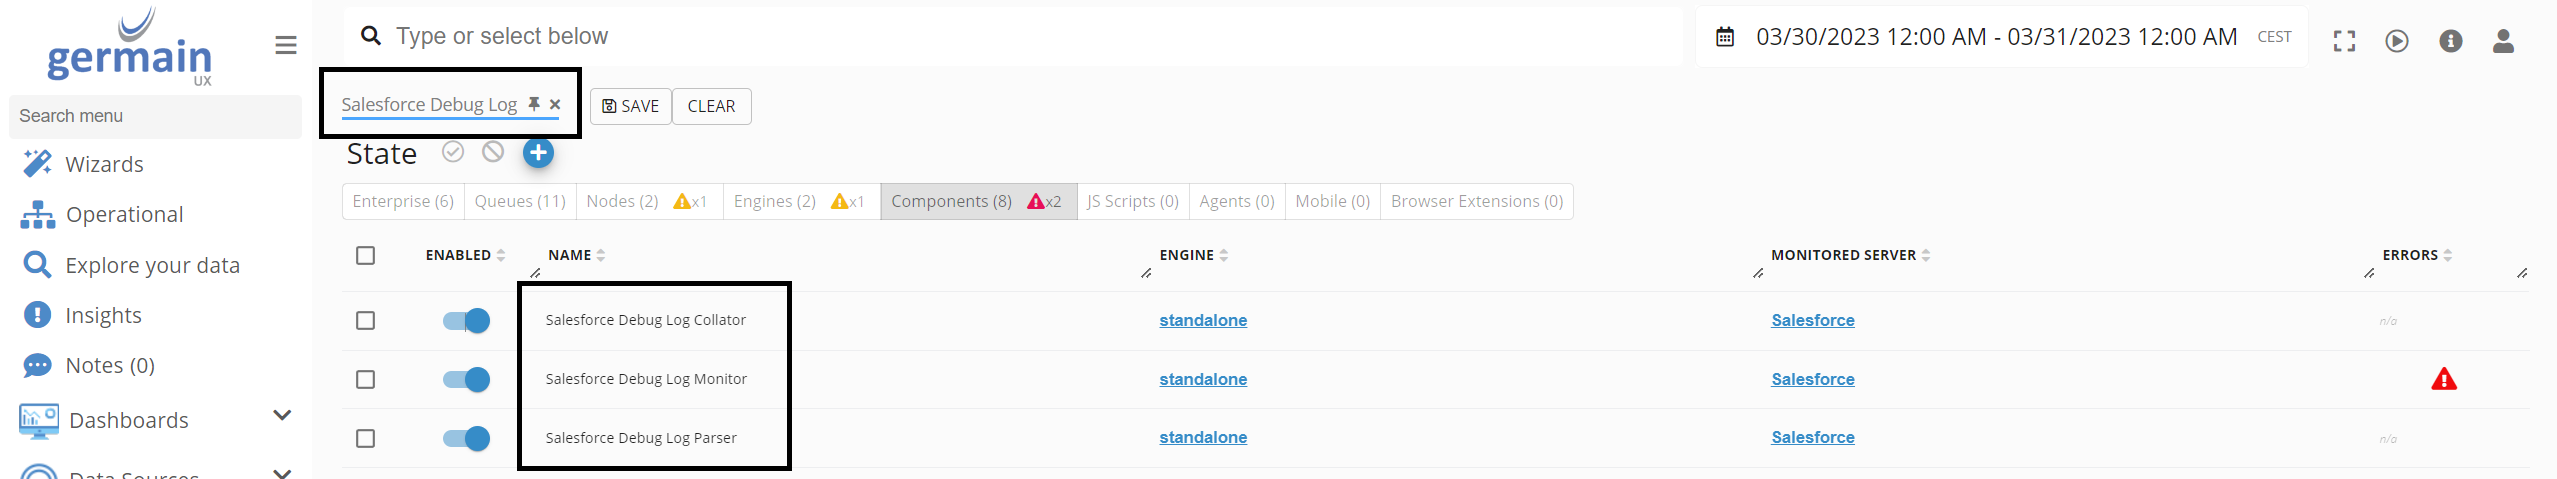
Choose "Germain" and then switch to the "State" tab.
-
Search for "Salesforce Debug Log."
-
Disable all three components by switching the toggle in the "ENABLED" column to the (:disabled: disabled state).
Frequency
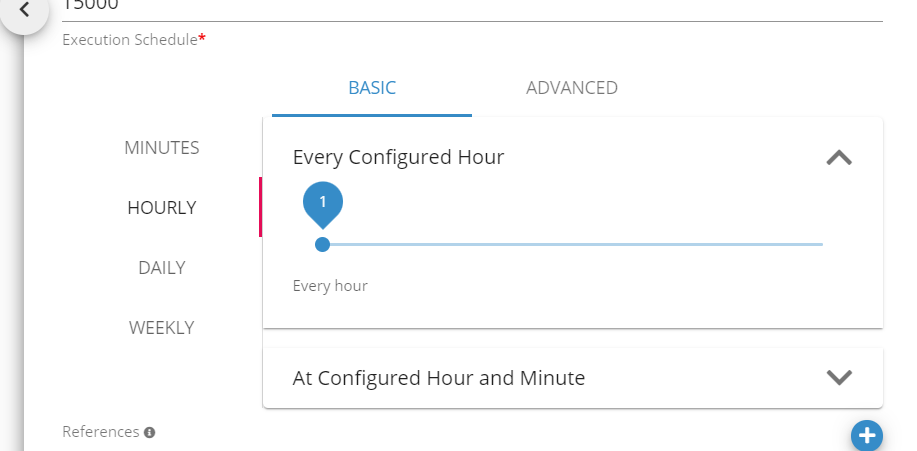
By default, this monitoring is configured to run once per hour. You have two options to update this component's execution frequency for pulling in SFDC Debug logs:
First Deployment
-
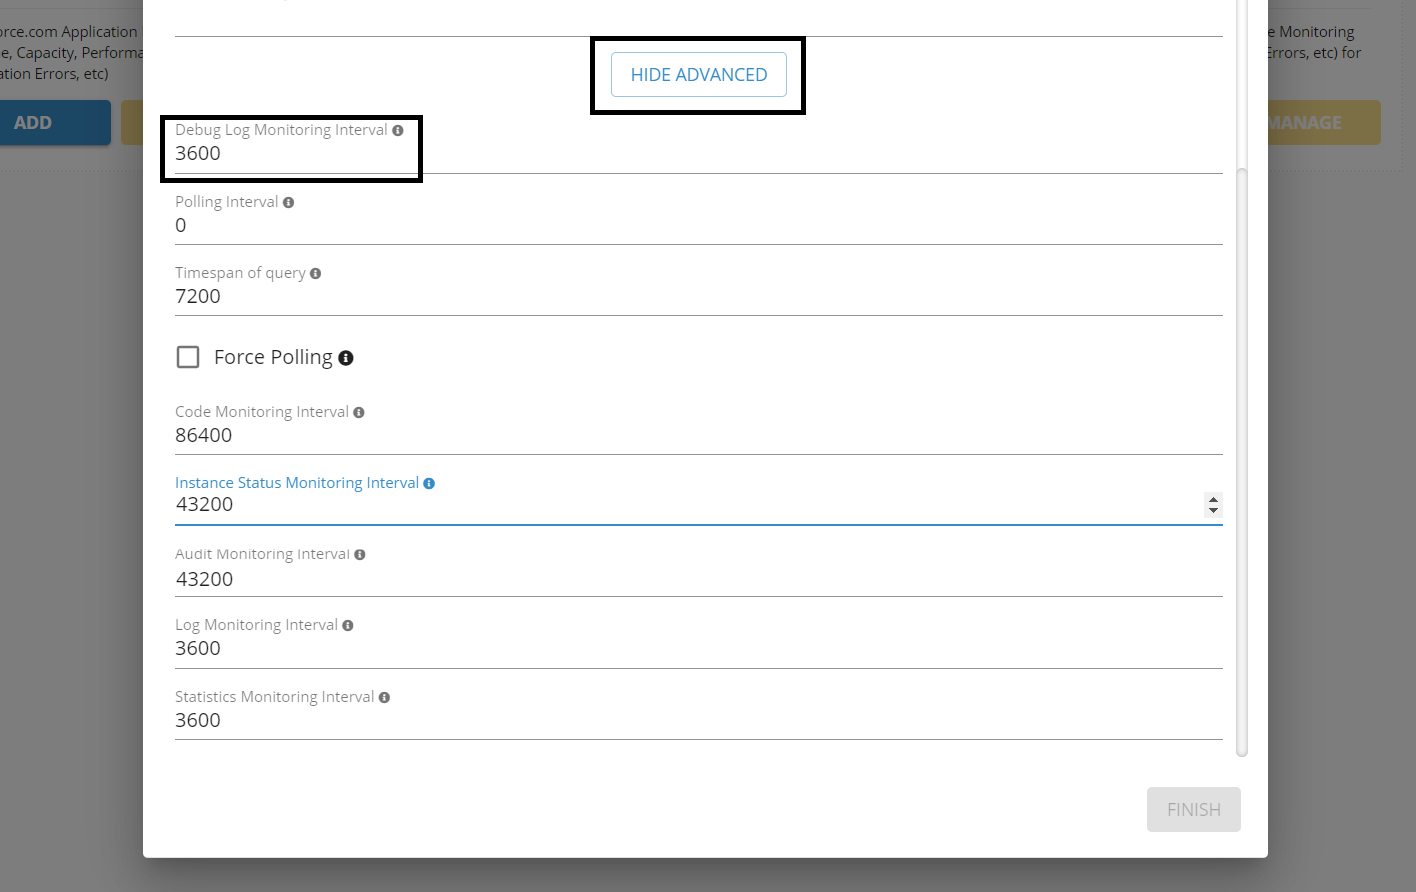
You can set the execution frequency value during the initial Salesforce Application monitoring deployment in the Salesforce Application wizard.
-
Click "SHOW ADVANCED" and set the "Debug Log Monitoring Interval" value.
Runtime
-
Go to Germain Workspace.
-
Access the Left Menu.
-
Choose "Germain" and then switch to the "State" tab.
-
Search for Type Name = Salesforce Debug Log Monitor.
-
Select a component.
-
Update the "Execution Schedule" value and click to save your change.
KPIs
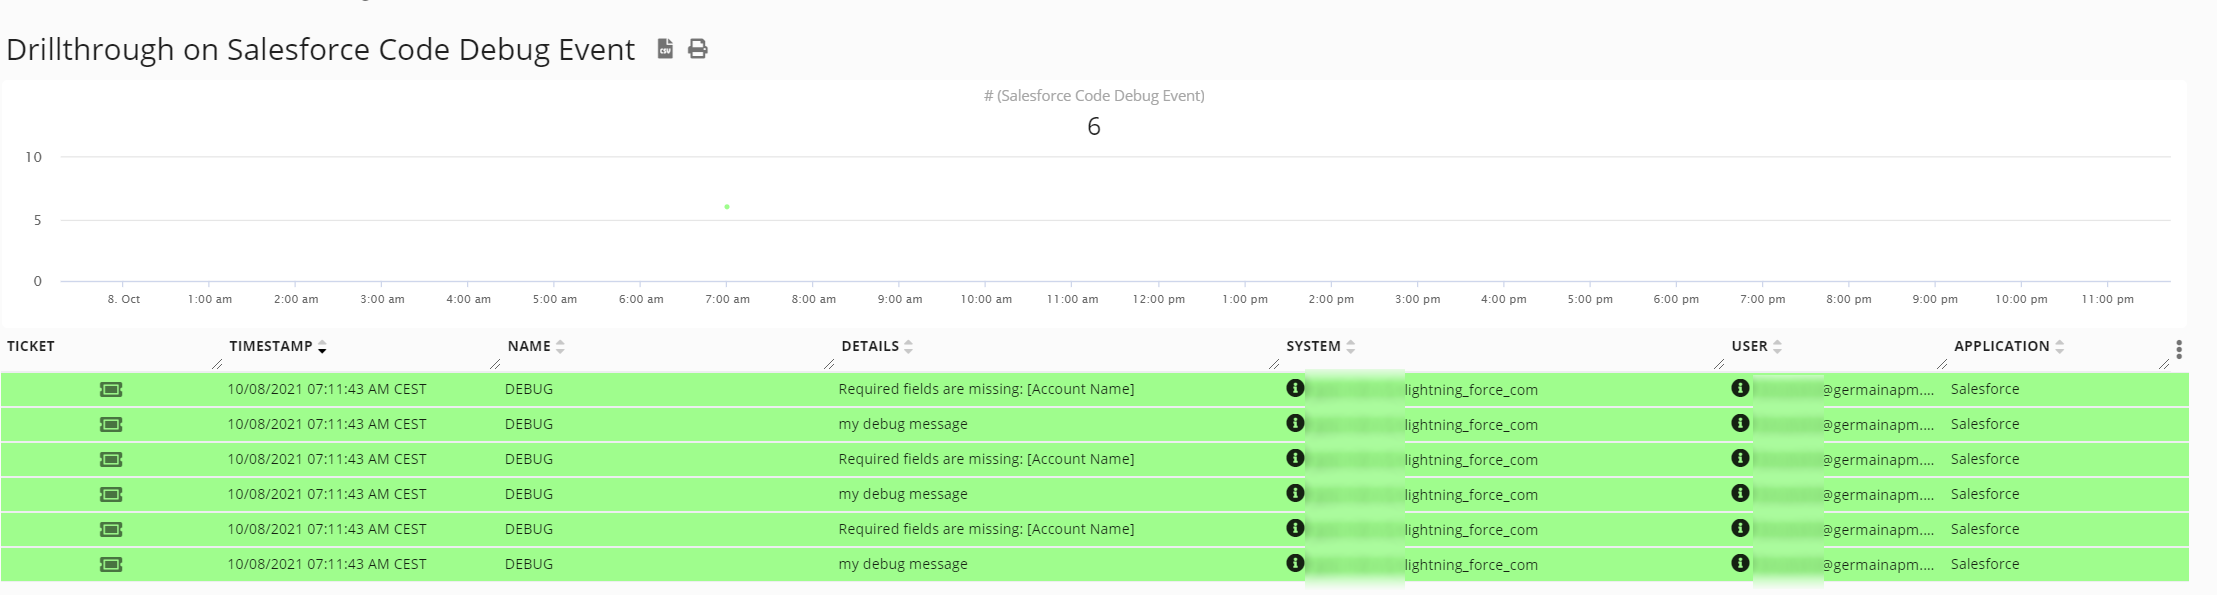
Dashboard
Germain Workspace > Left Menu > Dashboards > All > Salesforce Logs
Example
Component: Engine
Feature Availability: 2022.1 or later