Features
Various dashboards can help you understand the business impact of a given Key Performance Indicator (KPI) at scale.
-
Analytics Dashboards
-
Operational Dashboard (real-time 360 view)
-
SLA Violation Dashboard
Here are a few examples of business impact at scale. From these views, three levels of drilldown are available:
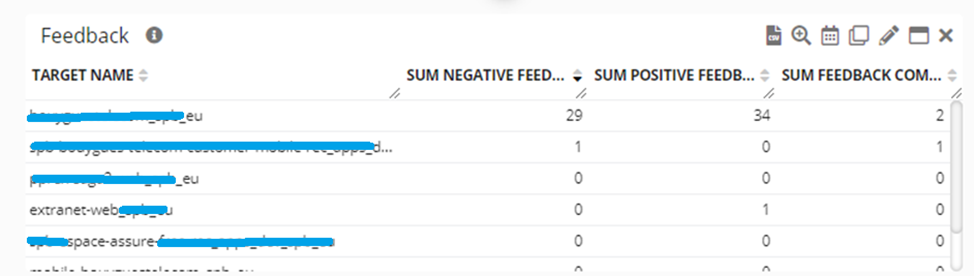
Feedback at Scale
Getting feedback from real users, in near real-time, is often more effective than conducting surveys. Surveys take time and effort, and they can’t provide the context of user actions at the exact moment a problem occurs.
Germain allows you to collect real user feedback either via Germain UX’s Feedback Popup or third-party chat technologies (e.g., Intercom, Zendesk, etc.).
Example: 96% of negative feedback is specific to one page or product.
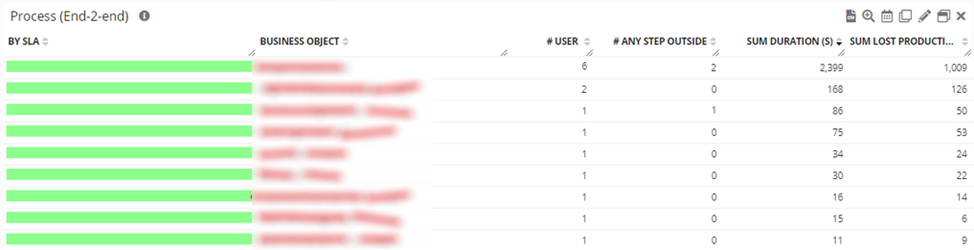
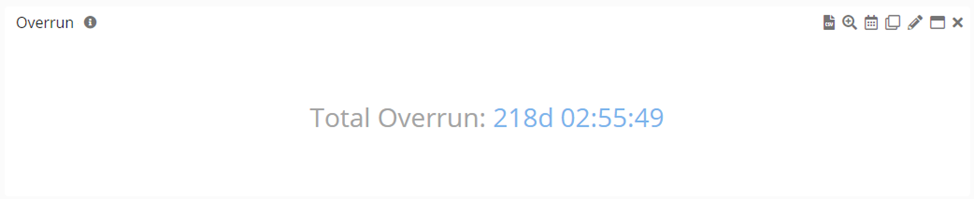
Overrun at Scale
Germain UX enables you to identify wasted work time, also known as Overrun, at scale and in real-time.
Overrun refers to any extra time spent performing a task beyond an accepted SLA. For example, if your service organization is expected to close a specific type of ticket within one day, overrun would be any time past 24 hours that the ticket remains open.
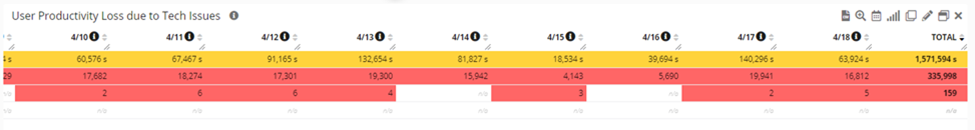
Tech Issues at Scale
Germain allows you to identify, at scale and in real-time, critical technology-related issues affecting your business (processes or users).
Examples of UX issues caused by technology, identified at scale by Germain UX:
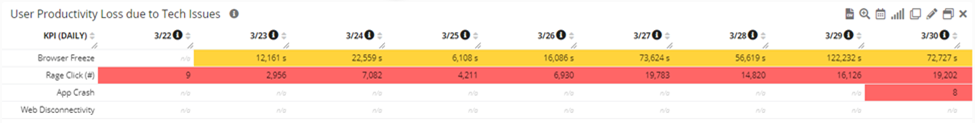
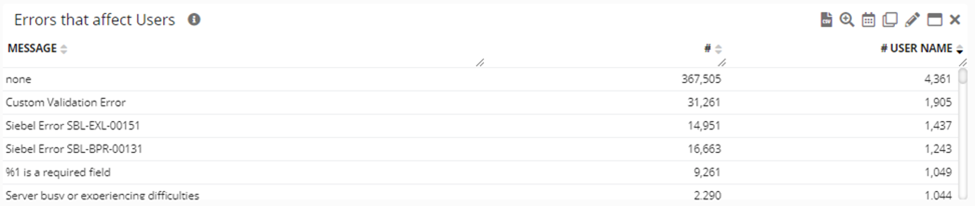
Important note: The millions of other Siebel errors that did not impact Siebel users are still monitored by Germain but are kept separate from user impact analysis. For more details on Tagging Oracle Siebel CRM Error.
Service: Analytics
Feature Availability: 2017.2