

GermainUX Workspace
State dashboard overview
Nodes
Inspect and manage nodes
JavaScript Deployments
Monitor JS deployment status
Remote Troubleshooting
Investigate entities remotely
GermainUX Health and Runtime Management
GermainUX provides three ways to monitor and manage the health of Germain Enterprise and its runtime services:GermainUX Workspace
The State dashboard provides administrators with a centralized view of GermainUX runtime health. Go to: GermainUX Workspace > Germain > State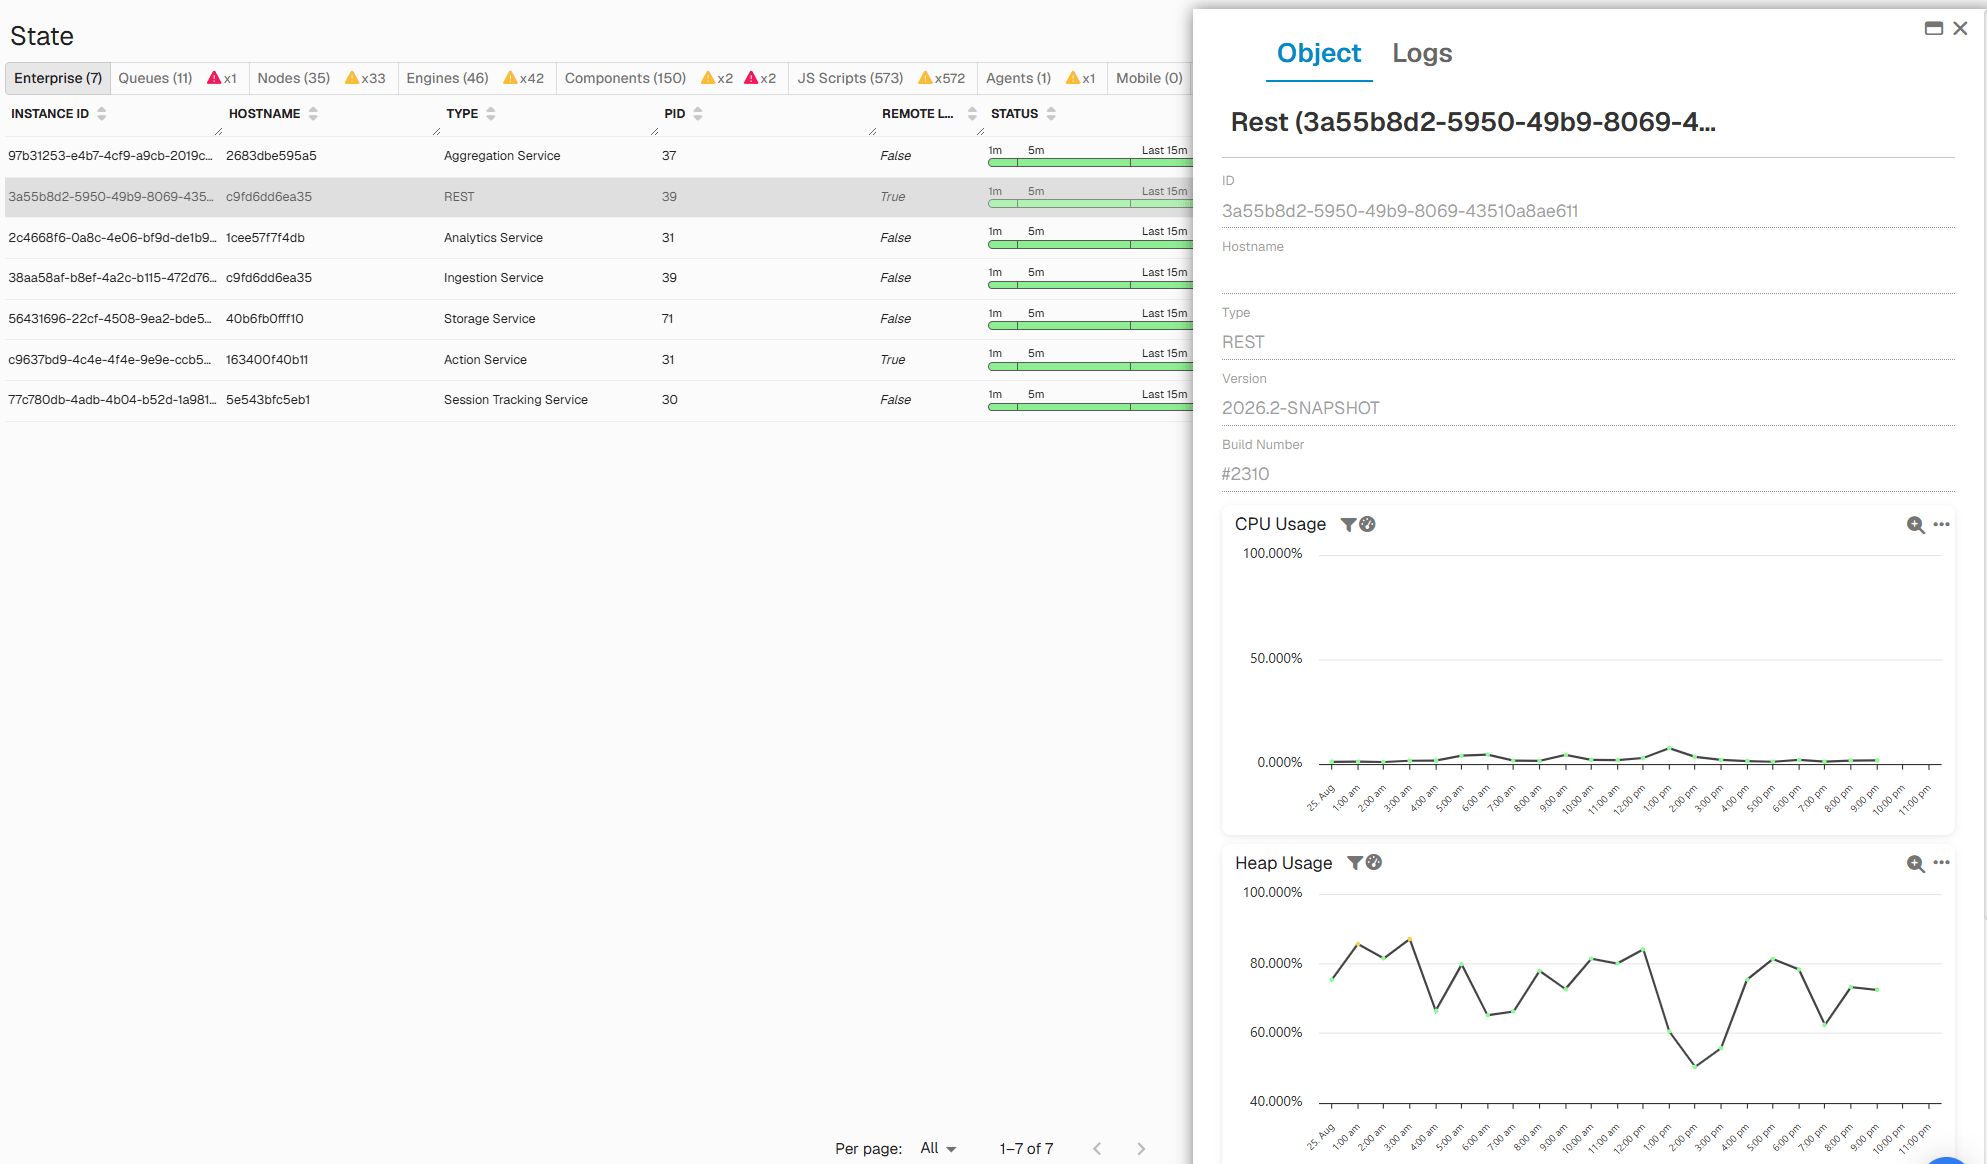
From this dashboard, authorized administrators can:
- Review service and component status
- Start, stop, or restart supported services
- Monitor queues
- Manage Nodes and Engines
- Deploy or update components
- Review agents, JavaScript deployments, and browser extensions
- Investigate configuration or runtime failures
Enterprise Services
Verify that all required Germain Enterprise services are running.
The services required in a specific environment depend on its architecture and enabled capabilities.
Queues
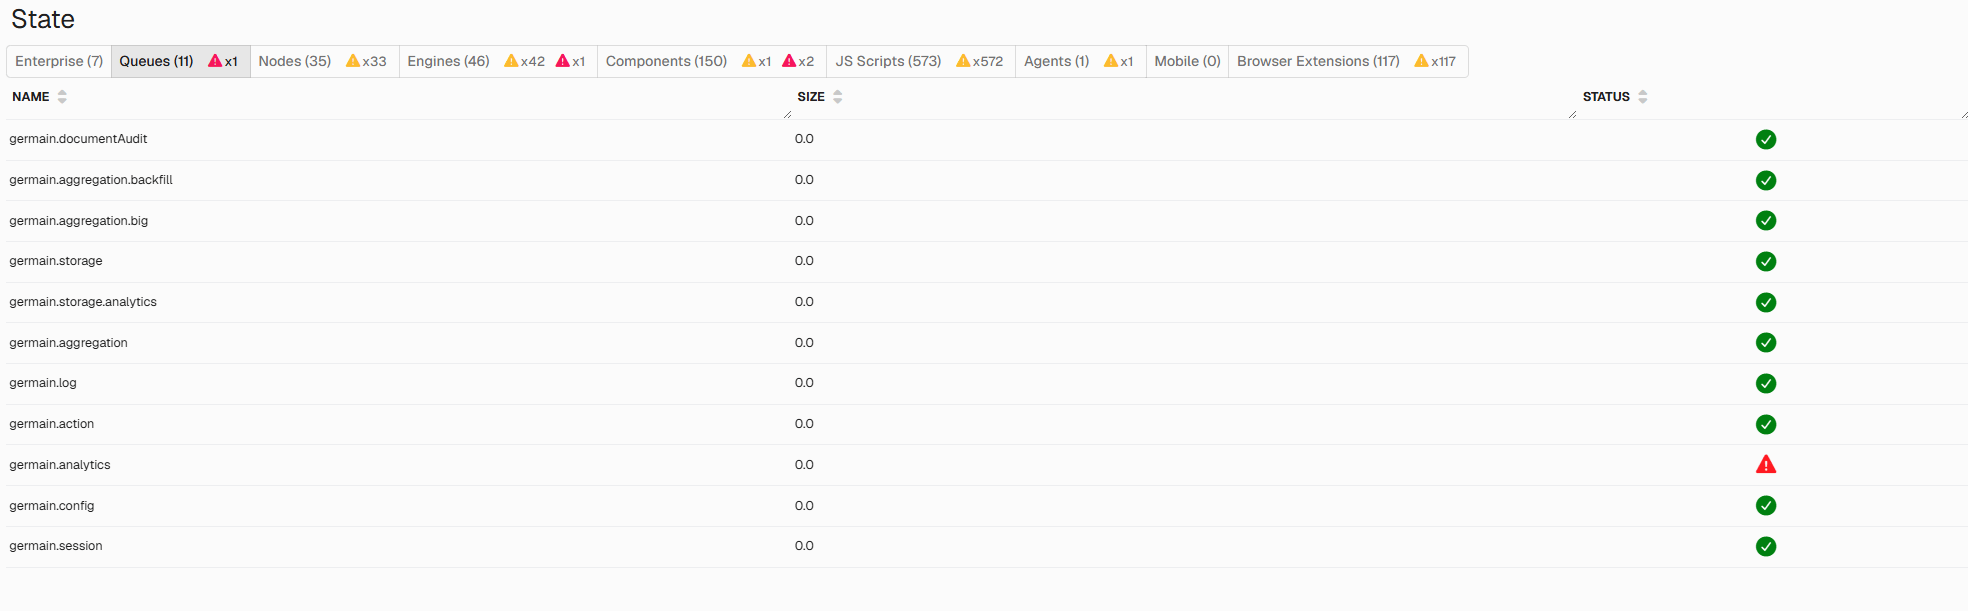
Use the Queues tab to review GermainUX processing queues. Monitor:- Current queue depth
- Whether the queue is growing or shrinking
- Processing rate
- Data-ingestion rate
- Age of the oldest queued item
- Failed or repeatedly retried items
Nodes
Use the Nodes tab to review and manage GermainUX Nodes. From this tab, administrators can inspect:- Node availability
- Runtime status
- Associated Engine Managers
- Deployed services and components
- Configuration or communication issues
Engines
Use the Engines tab to review and manage GermainUX Engine instances. Available operations may include:- Review Engine status
- Start or restart an Engine
- Inspect deployed components
- Review configuration
- Troubleshoot failed monitoring or automation
- Manage supported Engine updates
Engine Auto-Configuration
Engine auto-configuration helps standardize Engine deployment and configuration across applicable Nodes and environments. Review the generated configuration before applying it to production systems.Components
Use the Components tab to manage deployed GermainUX component instances. Depending on the component and user permissions, administrators can:- Review operating status
- Inspect configuration
- Deploy a component
- Update a component
- Enable or disable execution
- Configure a schedule
- Restart the component
- Investigate failures
Component Types
A component represents a monitoring, analytics, or automation workload executed by a GermainUX Engine. The available component types depend on the technologies and capabilities enabled in the environment.Component Scheduling
Components that support scheduled execution can run:- Every minute
- Hourly
- Daily
- Weekly
- At specified times
- According to an advanced CRON expression
JavaScript Deployments
Use the JS Scripts tab to manage JavaScript monitoring deployments, including: From this tab, administrators can review deployment and operating status for the JavaScript monitoring associated with their applications.Agents
Use the Agents tab to review and manage GermainUX monitoring agents. Administrators can use this view to:- Confirm that agents are connected
- Review their versions and status
- Identify inactive or unhealthy agents
- Troubleshoot communication issues
- Perform supported management operations
Browser Extensions
Use the Browser Extensions tab to review and manage GermainUX browser-extension deployments. GermainUX browser extensions can be distributed through supported public browser stores or hosted within an organization’s private store or cloud environment.Remote Troubleshooting
The State dashboard helps administrators remotely investigate GermainUX entities such as:- Enterprise services
- Nodes
- Engines
- Components
- Agents
- Browser extensions
- JavaScript monitoring deployments
Local Machine Management
A GermainUX runtime can also be inspected directly from the machine on which it operates. Examples include:- An Engine running on an application server
- An agent running within an application environment
- A browser extension installed on a user workstation
- A Germain Enterprise service running on its host
GermainUX Sentinel
GermainUX Sentinel is an independent self-monitoring capability that helps maintain GermainUX availability. Sentinel can:- Monitor the health of GermainUX services and components
- Detect stopped or failed processes
- Automatically restart supported services or components
- Reduce the need for manual recovery
- Help maintain continuous platform operation
Get Help
Contact GermainUX Support
The GermainUX team helps you get up and running faster, empower your team, turn data into actionable insights, and optimize performance to deliver measurable business outcomes.
Can't find what you need?
Search all GermainUX docs with Ctrl + K, or use the feedback buttons at the bottom of this page to tell us what is missing.
The content of this document is proprietary to GERMAIN SOFTWARE.