
⚙️ Configure Crash and Diagnostic-File Monitoring for SAP
Configure GermainUX to detect SAP-related process failures and diagnostic files using accessible logs, files, process status, browser telemetry, and custom parsers.
GermainUX can detect and analyze only the crash evidence made available through configured data sources. It does not automatically understand every SAP crash, ABAP short dump, or binary core file.
✅ Supported capabilities
Depending on the available telemetry, GermainUX can:
|
Capability |
|---|
|
Detect that a monitored process or service stopped |
|
Detect the creation of a diagnostic or crash file |
|
Collect approved file metadata |
|
Parse supported text-based diagnostic content |
|
Collect exceptions from accessible application logs |
|
Categorize recurring and new errors |
|
Correlate events using timestamps and available identifiers |
|
Associate browser activity with nearby backend events |
|
Alert when a new or recurring failure occurs |
|
Report crash and failure trends |
🏗️ Components
|
Component |
Purpose |
|---|---|
|
Engine |
Monitors processes, services, logs, files, supported databases, and HTTP endpoints |
|
RUM JS |
Provides browser-side sessions, errors, requests, freezes, and user actions |
|
Code Profiler |
Can capture exceptions in supported Java components when agent deployment is possible |
|
JS Profiler |
Provides browser-side JavaScript diagnostics; it does not analyze server crashes |
The primary component for this page is the GermainUX Engine.
📋 Prerequisites
Before configuring crash monitoring:
|
Prerequisite |
|---|
|
Deploy and start the GermainUX Engine. |
|
Identify the processes, services, logs, and diagnostic directories to monitor. |
|
Confirm that the Engine can reach the relevant hosts and files. |
|
Create read-only credentials where possible. |
|
Obtain representative examples of the diagnostic content. |
|
Determine whether the files are text or binary. |
|
Configure application and environment names. |
|
Establish privacy and retention requirements. |
|
Define which events should generate alerts. |
RUM JS is optional but useful when you want to examine browser activity near the time of a backend failure.
🔍 Identify available crash evidence
Document the sources available in the target SAP environment.
|
Source |
Potential evidence |
|---|---|
|
Process or service status |
Process stopped, service unavailable, unexpected instance count |
|
Application log |
Exception, fatal error, shutdown, startup, or termination event |
|
Diagnostic directory |
New dump, trace, or diagnostic file |
|
Text-based dump export |
Error type, timestamp, stack, component, or message |
|
Java application log |
Unhandled exception, out-of-memory condition, or process failure |
|
HTTP endpoint |
Application unavailable or returning an invalid result |
|
RUM session |
User actions, browser errors, requests, or freezes near the failure |
|
Synthetic scenario |
Login, application, or workflow no longer completes |
The exact sources depend on the SAP product and hosting model.
☁️ SAP Commerce Cloud
For SAP Commerce Cloud, formerly SAP Hybris, available monitoring depends on whether the environment is SAP-managed or customer-controlled.
🖥️ Customer-controlled Commerce environment
GermainUX may monitor:
|
Monitored item |
|---|
|
Java process availability |
|
Java application logs |
|
Web-server logs |
|
Accessible diagnostic files |
|
Host CPU, memory, and disk |
|
HTTP and OCC endpoints |
|
Supported databases |
|
Storefront browser errors |
|
Synthetic commerce journeys |
The GermainUX Code Profiler may capture supported Java exceptions when:
-
The runtime is supported.
-
Agent installation is permitted.
-
The organization controls the Java process.
-
The deployment has been approved.
🔒 SAP-managed Commerce Cloud
Direct access to servers, JVMs, logs, and diagnostic files may be restricted.
In that case, GermainUX monitoring is limited to the data sources made available to the customer, such as:
|
Available source |
|---|
|
Storefront RUM |
|
Browser errors and requests |
|
Accessible APIs |
|
Exported logs |
|
Available observability integrations |
|
Synthetic scenarios |
Do not claim server- or JVM-level crash monitoring until access has been confirmed.
🖱️ Configure process and service monitoring
Use the Engine to monitor supported operating-system processes or services associated with the SAP environment.
Configure:
|
Setting |
|---|
|
Server |
|
Operating system |
|
Engine |
|
Credentials |
|
Process or service name |
|
Expected running state |
|
Expected instance count |
|
Collection frequency |
|
Warning condition |
|
Critical condition |
|
Application |
|
Environment |
Potential conditions include:
-
Process missing
-
Service stopped
-
Instance count below expected
-
Repeated restart
-
Process unavailable after maintenance
A stopped process indicates an availability condition. It does not, by itself, identify the root cause.
📁 Configure log-based crash detection
Use an accessible log when the application records failure evidence as text.
⚙️ Configure the log source
Define:
|
Log setting |
|---|
|
Host |
|
Exact path |
|
File pattern |
|
Encoding |
|
Timestamp format |
|
Time zone |
|
Rotation behavior |
|
Multiline rules |
|
Parser |
|
Application and environment |
|
Privacy rules |
|
Polling interval |
 Configure failure patterns
Potential patterns include:
-
Fatal exception
-
Unhandled exception
-
Process terminated
-
Out-of-memory condition
-
Startup failure
-
Service shutdown
-
Repeated restart
-
Critical integration failure
Use patterns validated against real examples from the target environment.
Avoid generic keywords such as error or exception without context; they can produce large numbers of false positives.
🗂️ Configure diagnostic-directory monitoring
Use a directory monitor to detect new diagnostic files.
Configure:
|
Setting |
Description |
|---|---|
|
Name |
Descriptive monitor name |
|
Engine |
Engine that checks the directory |
|
Monitored server |
Host containing the directory |
|
Path |
Exact approved directory |
|
File pattern |
Diagnostic files to include |
|
Subdirectories |
Whether nested directories are included |
|
Existing files |
Whether files already present are processed |
|
Empty files |
Whether zero-length files are included |
|
Polling interval |
How frequently the directory is checked |
|
Application |
Associated SAP application |
|
Environment |
Associated environment |
Avoid broad paths that contain unrelated files.
📃 File metadata
Even when the file content cannot be parsed, GermainUX can use approved metadata such as:
|
Metadata |
|---|
|
File name |
|
Path |
|
Size |
|
Creation time |
|
Modification time |
|
Host |
|
Application |
|
Environment |
This can indicate that a diagnostic artifact was created without claiming to understand its contents.
📄 Configure diagnostic-file parsing
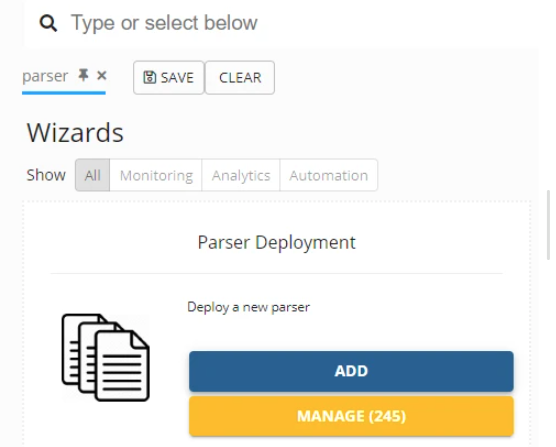
Use a parser only when the file format is supported or a custom parser has been implemented and tested.
📄 Text-based files
A generic or custom parser may extract:
|
Field |
|---|
|
Timestamp |
|
Error type |
|
Severity |
|
Component |
|
Message |
|
Stack trace |
|
Error code |
|
Host |
|
Process |
|
Thread |
|
Correlation identifier |
⛔ Binary files
Do not ingest binary core files as ordinary text logs.
GermainUX can detect their creation and collect metadata, but content analysis requires a compatible external tool or purpose-built parser.
📃 ABAP short dumps
GermainUX does not natively retrieve or interpret ABAP short dumps merely because SAP monitoring is enabled.
ST22 or other ABAP diagnostic data can be analyzed only when it is:
-
Exported through an accessible format
-
Retrieved through an approved integration
-
Supplied to GermainUX
-
Parsed by a compatible custom or supported parser
☕ Configure Java exception monitoring for SAP Commerce Cloud
For a supported, customer-controlled Java runtime, GermainUX may collect exceptions through:
-
Java application logs
-
Code Profiler instrumentation
-
Process monitoring
-
HTTP availability checks
Potential Java failure evidence includes:
-
Unhandled exception
-
Out-of-memory error
-
Thread failure
-
Application startup failure
-
Process termination
-
Repeated restart
-
Failed downstream request
Code Profiler availability depends on runtime support and permission to install the agent.
🌐 Configure browser-side evidence
When RUM JS is deployed, GermainUX can capture the browser activity preceding or surrounding a user-visible failure.
Available evidence can include:
|
Evidence |
|---|
|
User action |
|
Logical page |
|
JavaScript error |
|
Unhandled promise rejection |
|
Failed request |
|
Resource error |
|
Browser freeze |
|
Session Replay |
|
Application message |
This evidence can show what the user experienced. It does not prove that the user action caused a backend process to crash.
🔗 Configure correlation
GermainUX can associate evidence when compatible identifiers or timing are available.
Potential correlation attributes include:
|
Attribute |
|---|
|
Application |
|
Environment |
|
Host |
|
Timestamp |
|
User |
|
RUM session |
|
Request identifier |
|
Correlation identifier |
|
Transaction identifier |
|
Process or service |
🆔 Identifier-based correlation
Use a shared request or correlation identifier when available. This provides stronger evidence than time proximity alone.
⏰ Time-based correlation
Time-based correlation can identify potentially related events, such as:
-
User performs an action.
-
Browser request fails.
-
Application log records a fatal exception.
-
Monitored process stops.
-
Diagnostic file appears.
This sequence supports investigation but does not automatically prove causation.
Ensure that browser, Engine, SAP, server, and database clocks are synchronized.
🏷️ Configure categorization
Go to:
Germain Workspace -> Settings -->Analytics -> Categorization
Categorize failures using stable attributes such as:
-
Error type
-
Normalized message
-
Stack signature
-
Error code
-
Component
-
Process
-
File type
Remove variable values such as:
-
Timestamp
-
User ID
-
Session ID
-
Request ID
-
Memory address
-
Thread ID
-
Dynamic business identifier
-
Generated file suffix
🔎 Exact and fuzzy matching
Where the parsed data supports it:
-
Use exact matching for stable attributes that must be identical.
-
Use fuzzy matching for normalized messages or stack information that can vary slightly.
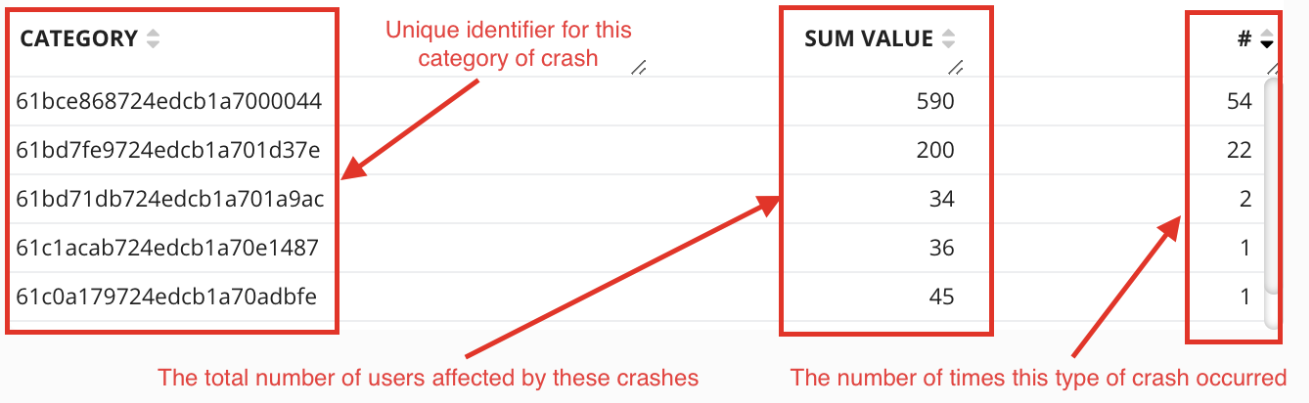
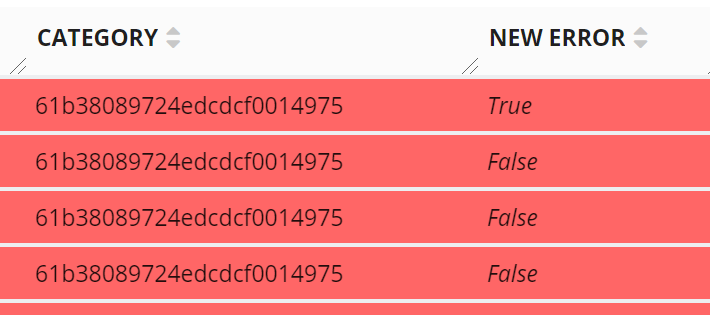
Categorization can help distinguish:
-
New failure categories
-
Recurring failures
-
Increasing failures
-
Failures introduced after a release
-
Similar failures across multiple hosts
Categorization quality depends on the fields successfully extracted from the source.
📈 Configure KPIs
Potential KPIs include:
|
KPI |
Description |
|---|---|
|
Process Unavailable |
Monitored process is not running |
|
Service Unavailable |
Monitored service is stopped |
|
Diagnostic File Created |
New matching file detected |
|
Fatal Log Event |
Configured fatal pattern detected in a log |
|
Java Exception |
Supported Java exception collected |
|
Browser Error |
Browser-side failure associated with a user session |
|
Synthetic Failure |
Synthetic SAP scenario did not complete |
|
HTTP Unavailable |
Configured endpoint did not return an acceptable result |
|
Failure-Affected Users |
Distinct monitored users associated with the failure |
|
Failure Category |
Categorized group of similar failures |
Create only KPIs backed by actual configured data sources.
📊 Configure dashboards
Go to:
Germain Workspace → Settings -> Dashboards -> All
Search for applicable SAP, availability, error, or technology dashboards, or create a custom dashboard.
Recommended views include:
-
Failures over time
-
New versus recurring categories
-
Failures by application
-
Failures by environment
-
Failures by host
-
Process and service availability
-
Java exceptions
-
Diagnostic files created
-
Affected users and sessions
-
Failures by release
-
Related synthetic failures
Provide drill-through access to the underlying evidence and related sessions where available.
🔔 Configure alerts
Create alerts for actionable conditions such as:
-
Critical process stopped
-
Required service unavailable
-
New diagnostic file detected
-
New fatal error category
-
Failure volume increased
-
Java process restarted repeatedly
-
HTTP endpoint unavailable
-
Synthetic scenario failed
-
Multiple users affected by the same failure
Use:
-
Consecutive-failure thresholds
-
Deduplication
-
Categorization
-
Cooldown periods
-
Maintenance periods
-
Warning and critical severities
Avoid generating one alert for every repeated log line.
📃 Configure reports
Schedule reports for:
-
Failure trends
-
New and recurring categories
-
Failures by host or application
-
Process availability
-
Java exception trends
-
Diagnostic-file activity
-
Affected-user counts
-
Failures introduced after releases
-
Resolution and recurrence
🔏 Privacy and retention
Diagnostic content can contain:
-
User identifiers
-
Business-document identifiers
-
File paths
-
Hostnames
-
SQL fragments
-
Request data
-
Authentication information
-
Personal or confidential data
Configure:
-
Field masking
-
Pattern-based redaction
-
Attribute exclusion
-
File-content restrictions
-
Retention
-
Role-based access
-
Export restrictions
Do not collect complete diagnostic content unless it is required and approved.
✅ Validate the configuration
⚙️ Process and service validation
Confirm that:
-
The intended process or service is monitored.
-
Its expected state is correct.
-
A safe test condition produces the correct KPI.
-
Recovery clears or updates the condition.
📂 File detection validation
Confirm that:
-
Only matching files are detected.
-
Existing files are handled as intended.
-
A new test file creates one event.
-
Restarts do not duplicate previously processed files.
-
Rotation behavior is correct.
🧪 Parser validation
Confirm that:
-
Timestamp and time zone are correct.
-
Multiline data remains one event.
-
Error type and severity are extracted correctly.
-
Variable values are normalized.
-
Sensitive data is protected.
-
Unsupported binary data is not treated as text.
🔍 Correlation validation
Confirm that:
-
Related evidence shares a validated identifier or plausible time relationship.
-
Unrelated events are not automatically joined.
-
Session Replay is linked only when an appropriate session exists.
-
The analysis does not imply causation without supporting evidence.
🚫 Limitations
GermainUX does not automatically:
-
Profile ABAP execution
-
Retrieve ABAP short dumps
-
Interpret every SAP diagnostic format
-
Parse arbitrary binary core files
-
Determine the root cause from file creation alone
-
Prove that a particular user action caused a backend crash
-
Correlate events without compatible identifiers or validated rules
-
Access restricted SAP-managed cloud infrastructure
These capabilities require accessible telemetry and, in some cases, a custom integration or parser.
📚 Related documentation
|
Document |
Link |
|---|---|
|
SAP Monitoring |
|
|
Configure Monitoring for SAP |
https://docs.germainux.com/main/configure-monitoring-for-sap |
|
Configure Application Monitoring for SAP |
https://docs.germainux.com/main/application-monitoring-for-sap-configure?utm_source=chatgpt.com |
|
Engine Deployment for SAP |
|
|
Configure Error Monitoring for SAP |
https://docs.germainux.com/main/error-monitoring-for-sap-configure |
|
Configure User Monitoring and Session Replay for SAP |
https://docs.germainux.com/main/user-monitoring-and-session-replay-for-sap-configu |
|
KPIs for SAP |
ℹ️ Get More Information
GermainUX can help determine which monitoring, analytics and automation capabilities are appropriate for your SAP environment.
Component: Engine, JS Profiler, Mobile App, RPA Bot Recorder, RUM JS
Feature Availability: 2022.1 or later