
📊 IIS Monitoring
GermainUX monitors the availability, traffic, performance, application pools, worker processes, Windows resources, and logs of Microsoft Internet Information Services (IIS).
The GermainUX Engine collects IIS logs, Windows Performance Counters, service status, and availability data for real-time analytics, troubleshooting, SLA evaluation, alerting, reporting, and approved automated actions.
🎯 Business outcomes
IIS monitoring helps organizations:
-
Detect unavailable or slow websites and services.
-
Identify increases in HTTP errors and failed requests.
-
Find slow pages, endpoints, or application operations.
-
Monitor application-pool and worker-process health.
-
Detect CPU, memory, disk, or network constraints.
-
Analyze request volume, traffic patterns, and bandwidth.
-
Identify errors by website, endpoint, server, status code, or user segment.
-
Correlate IIS problems with browser sessions, application code, databases, and infrastructure.
-
Reduce the time required to diagnose web-application incidents.
-
Validate performance and stability after releases or configuration changes.
Website availability and responsiveness
GermainUX can monitor IIS-hosted websites and endpoints for:
-
Availability
-
HTTP response status
-
Response time
-
Unexpected content or responses
-
Connection failures
-
TLS or connectivity problems visible to the configured monitor
-
Performance changes across time or servers
Synthetic HTTP or browser-based scenarios can supplement log monitoring by testing critical websites and workflows proactively.
IIS access-log monitoring
GermainUX parses IIS W3C access logs and converts individual requests into structured, searchable telemetry.
Depending on the fields enabled in IIS, GermainUX can analyze:
|
IIS field |
Analysis |
|---|---|
|
|
Request timestamp |
|
|
IIS website |
|
|
Server handling the request |
|
|
Server address and port |
|
|
HTTP method |
|
|
Requested page, endpoint, or resource |
|
|
Query parameters, subject to privacy controls |
|
|
Authenticated user, when logged and authorized |
|
|
Client address, subject to privacy requirements |
|
|
Browser, client, or integration agent |
|
|
Referring page |
|
|
HTTP response status |
|
|
IIS-specific status detail |
|
|
Windows-level request result |
|
|
Response and request sizes |
|
|
IIS request duration |
The fields available to GermainUX depend on the W3C fields enabled in IIS. Fields that are not written to the log cannot be analyzed retrospectively.
Request and traffic analytics
Parsed IIS logs can provide insights such as:
-
Request volume and rate
-
Successful and failed requests
-
HTTP status-code distribution
-
Most frequently accessed websites and endpoints
-
Slowest endpoints
-
Response-time percentiles and trends
-
Request and response size
-
Traffic by server, application, user agent, or client
-
Unusual spikes or reductions in activity
-
Error rate by URL, method, server, or application
-
Usage of specific application features exposed through identifiable URLs
Query strings, client addresses, usernames, and referrer values may contain sensitive information. Collect and retain them only when authorized.
IIS errors
GermainUX can detect and analyze:
-
HTTP 4xx client responses
-
HTTP 5xx server failures
-
IIS substatus codes
-
Windows status codes
-
Failed or incomplete requests
-
Repeated errors affecting the same endpoint
-
Sudden changes in error rate
-
Application errors written to configured logs
-
Related Windows Event Log entries, when separately configured
An HTTP status does not always identify the root cause. Correlate it with application logs, Windows events, application-pool state, code exceptions, database activity, and user experience where those data sources are available.
Application pools and worker processes
Using supported Windows and IIS performance telemetry, GermainUX can monitor:
-
Application-pool availability and state
-
Worker-process availability
-
Worker-process count
-
Application-pool recycling
-
CPU consumption
-
Memory consumption
-
Request queues
-
Active and rejected requests
-
Process restarts or unexpected termination
-
Resource usage by
w3wp.exe
The exact metrics available depend on the IIS version, Windows Performance Counters, permissions, and installed monitoring configuration.
IIS and Windows performance
GermainUX can collect relevant performance counters for:
-
Request rate
-
Current connections
-
Queued requests
-
Bytes sent and received
-
CPU utilization
-
Available and used memory
-
Disk activity and capacity
-
Network utilization
-
Process resource consumption
-
Server uptime
Infrastructure measurements should be evaluated together with request traffic. High CPU during an expected traffic increase may have a different cause and impact than high CPU at normal request volume.
Application and error logs
In addition to IIS access logs, the GermainUX Engine can monitor:
-
IIS error logs
-
HTTP error logs
-
Application logs
-
Windows Event Logs
-
Failed Request Tracing logs, when configured in a supported consumable format
-
Custom text or structured logs written by the hosted application
GermainUX can extract configured fields, categorize recurring errors, detect new conditions, and create KPIs from relevant log events.
Application-level monitoring
IIS logs show the request handled by the web server but do not automatically expose the internal application execution, database query, or code path responsible for it.
For deeper analysis, IIS telemetry can be combined with:
|
Component or data source |
Additional visibility |
|---|---|
|
Supported .NET, Java, or other application-code execution and errors |
|
|
Application logs |
Exceptions, internal operations, and business events |
|
Database monitoring |
Query duration, failures, locks, and database health |
|
Real-user browser activity, performance, errors, and Session Replay |
|
|
Browser monitoring when the application cannot include RUM JS |
|
|
Deeper browser-side JavaScript and network diagnostics |
|
|
Synthetic monitoring |
Proactive website and workflow validation |
Compatible timestamps and identifiers make it possible to correlate a user action with its browser request, IIS log entry, application transaction, error, database operation, and infrastructure conditions.
Configure IIS monitoring
Prerequisites
Before configuration, confirm that:
-
A GermainUX Engine can access the IIS server or its log files.
-
IIS W3C logging is enabled for the required websites.
-
The required W3C fields are enabled.
-
The monitoring account can read the configured log directories.
-
Windows Performance Counter access is available when required.
-
IIS and application log retention is sufficient.
-
Firewalls and security controls permit the required monitoring access.
-
Privacy requirements for URLs, query strings, usernames, client addresses, and headers have been reviewed.
Run the IIS wizard
-
Sign in to GermainUX Workspace.
-
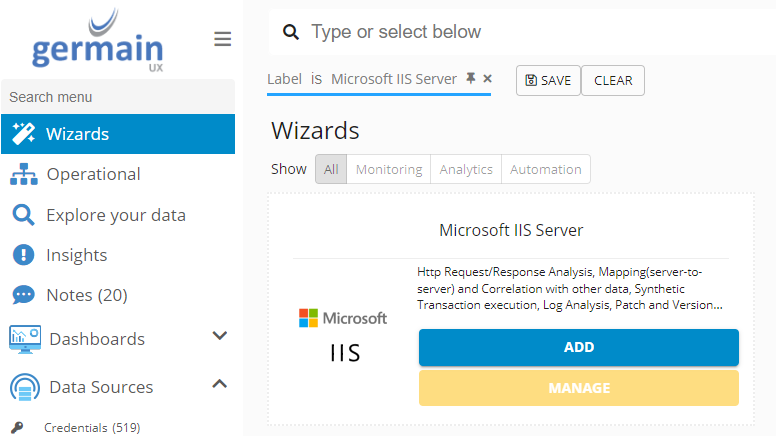
Go to Wizards.
-
Open Microsoft IIS Server.
-
Select the server on which the monitoring component will run.
-
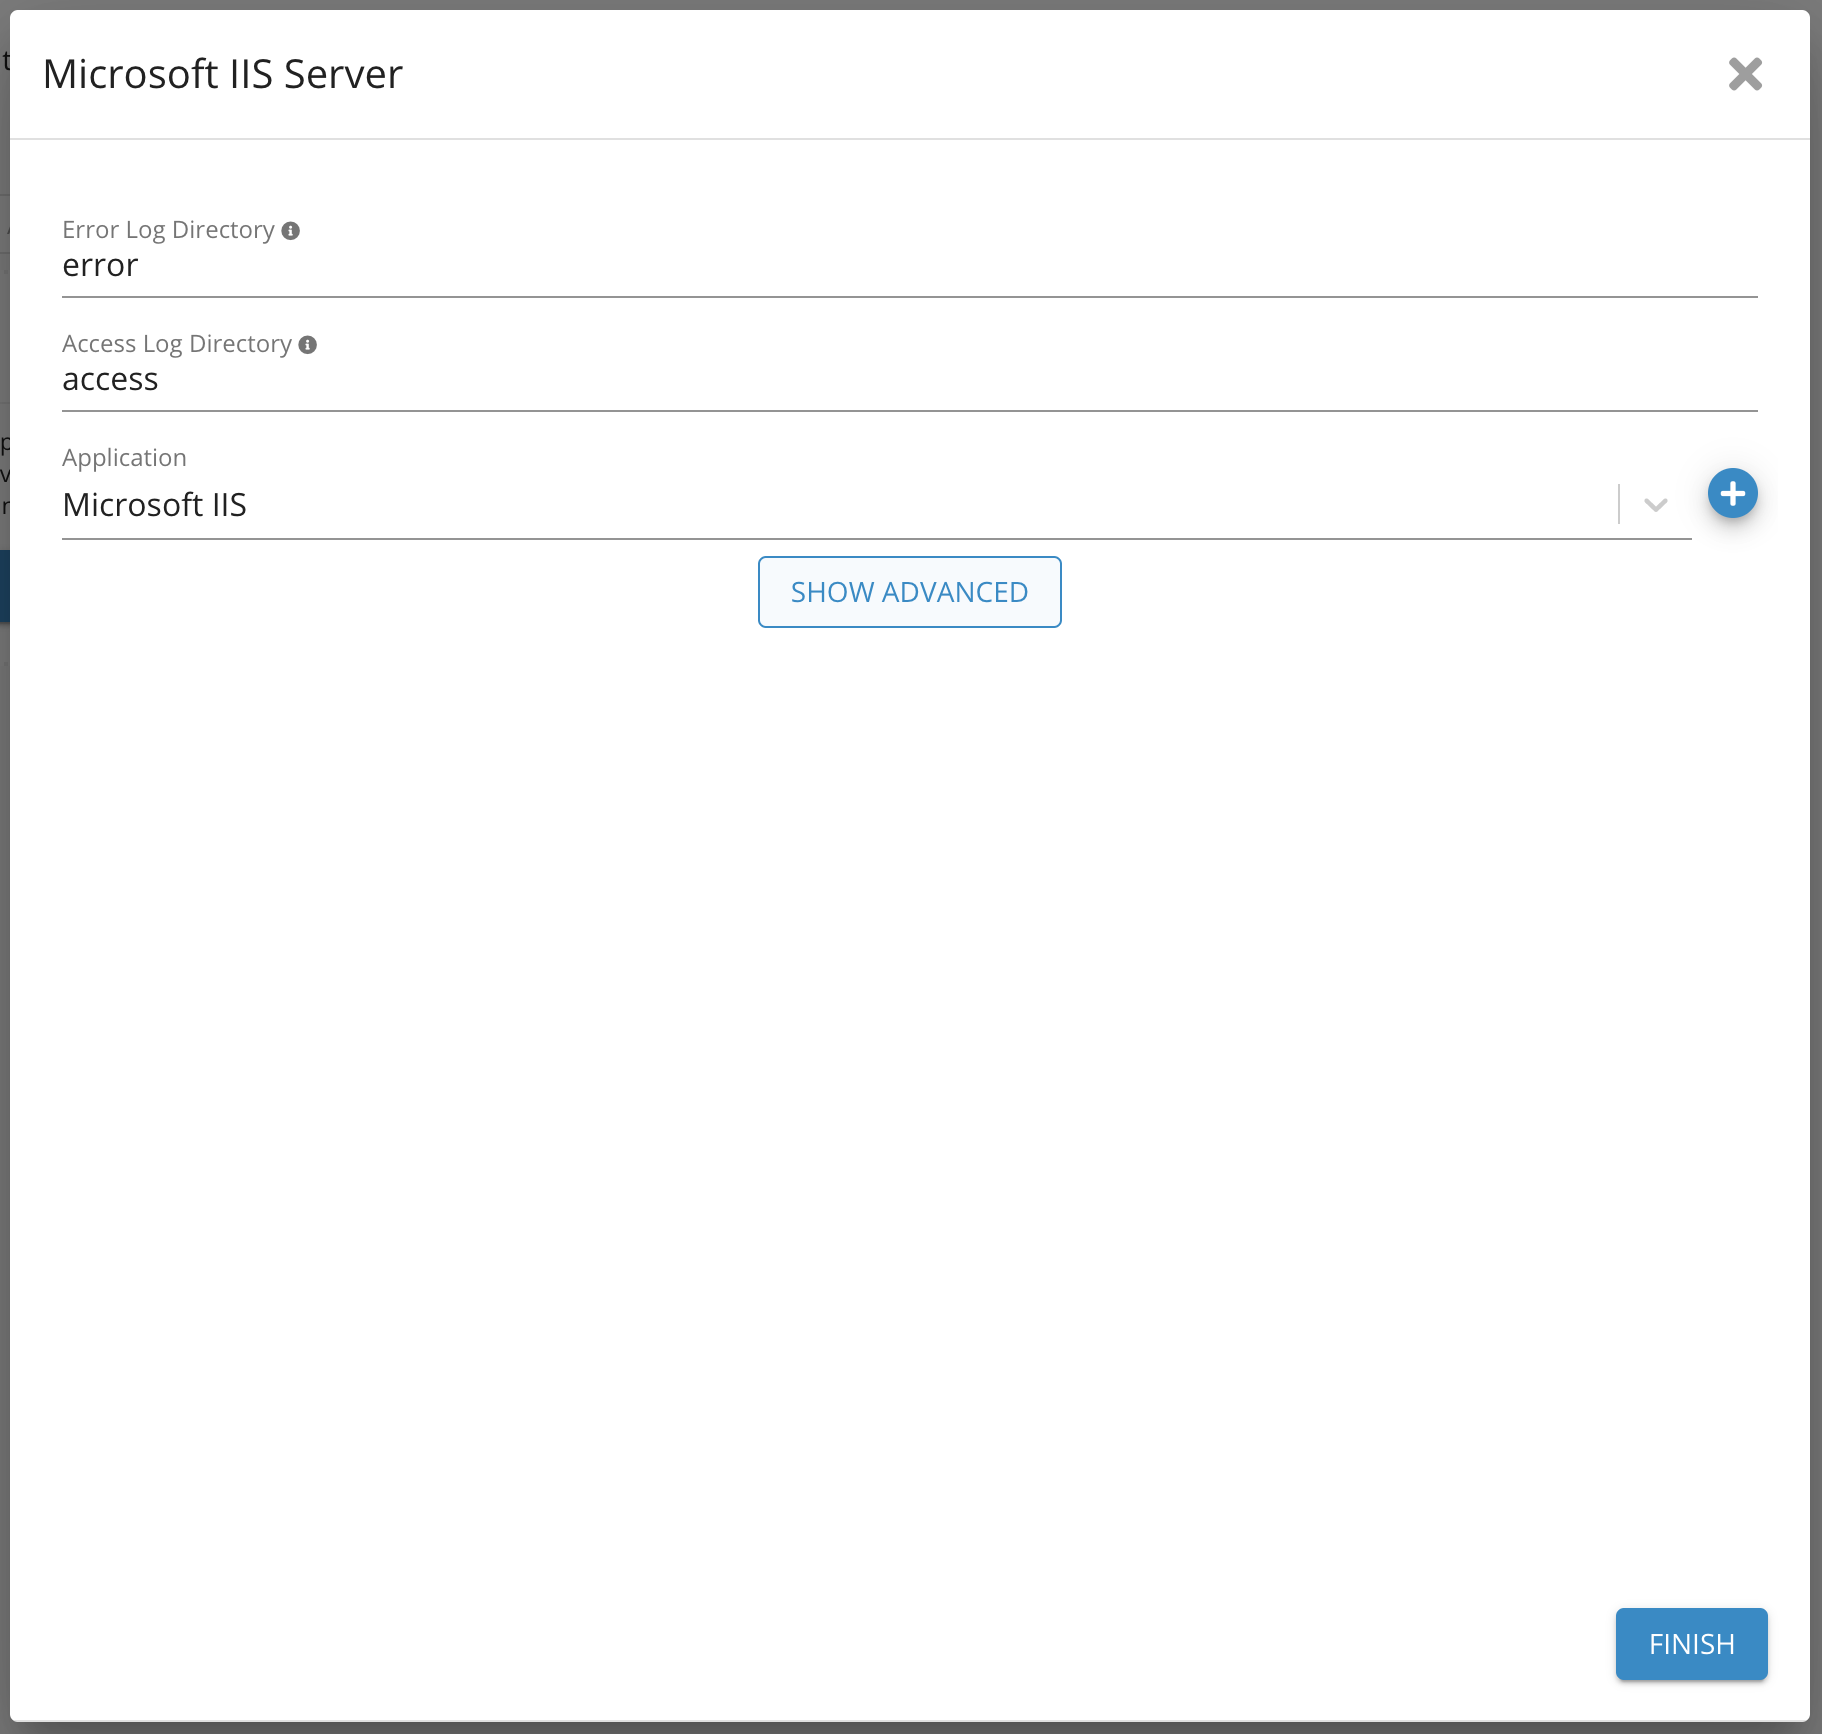
Select or create the IIS application and environment.
-
Enter the IIS access-log path.
-
Enter the IIS error-log path when applicable.
-
Select the GermainUX Engine responsible for collection.
-
Review the configuration.
-
Finish the wizard.
A typical IIS W3C log directory resembles:
C:\inetpub\logs\LogFiles\W3SVC1
The actual directory depends on the website configuration. Each IIS website can use a different directory.
Use a path pattern that includes the intended rotated log files without including unrelated sites or historical archives unnecessarily.
Force polling
Enable Force Polling only when the normal file-change mechanism cannot reliably detect new log content, such as certain remote, shared, synchronized, or storage-specific configurations.
To enable it:
-
Open the advanced wizard settings.
-
Enable Force Polling.
-
Select an appropriate polling interval.
-
Validate the resulting storage, network, and server overhead.
Normal local-file monitoring should generally use the standard detection mechanism.
Log rotation and continuity
IIS commonly creates new log files on a configured schedule.
Confirm that GermainUX:
-
Monitors newly created files matching the configured path.
-
Continues reading appended data without rereading completed files.
-
Preserves collection state across Engine restarts.
-
Handles the configured IIS rotation schedule.
-
Can access the new files using the monitoring account.
-
Does not lose data when logs are moved, compressed, or deleted.
Retain source logs long enough to recover from temporary collector outages.
Analytics, SLAs, and alerts
Configure SLAs for conditions such as:
-
Website unavailable
-
Response time above the accepted threshold
-
HTTP error rate above the accepted level
-
Sudden increase in 5xx responses
-
Request queue growing
-
Application pool unavailable
-
Worker process missing or restarting
-
CPU or memory pressure
-
IIS log data no longer received
Use baselines, percentiles, and sustained conditions where appropriate. A single slow request or expected application-pool recycle may not justify an incident.
Detected conditions can trigger:
-
Email or SMS alerts
-
Watches for interested GermainUX users
-
Scheduled reports
-
Incident creation or enrichment
-
Approved diagnostic actions
-
Authorized application-pool or service remediation
See Automation. Production actions that restart an application pool, service, or server require restricted permissions, safeguards, and operational approval.
Privacy and security
IIS logs can contain personal information, internal URLs, business identifiers, authentication-related values, and sensitive query parameters.
-
Avoid logging credentials, tokens, or secrets.
-
Disable unnecessary IIS fields.
-
Mask, anonymize, or exclude sensitive values.
-
Restrict access to raw and parsed logs.
-
Protect monitoring credentials.
-
Use least-privilege access.
-
Define appropriate retention periods.
-
Review custom parsing rules before production deployment.
-
Avoid collecting complete request or response bodies unless explicitly required and authorized.
See Data Privacy.
Validate monitoring
After configuration:
-
Request a monitored IIS page or endpoint.
-
Confirm that IIS writes the request to the expected W3C log.
-
Verify that the GermainUX Engine reads the new entry.
-
Confirm that the timestamp, website, server, method, URL, status, and duration are parsed correctly.
-
Generate an approved test 4xx response.
-
Generate an approved test application or 5xx error where safe.
-
Verify that both conditions appear in GermainUX.
-
Confirm that application-pool and Performance Counter metrics appear when configured.
-
Validate SLAs and alerts using controlled test conditions.
-
Confirm that sensitive query parameters and user information are protected.
Deployment and configuration
|
For your IIS environment |
|---|
|
Deploy or select a GermainUX Engine with access to the IIS servers and logs. |
|
Run the Microsoft IIS Server wizard in GermainUX Workspace. |
|
Configure File and Log Monitoring for IIS, application, and related Windows logs. |
|
Configure Windows and IIS Performance Counters required for application-pool, worker-process, request, and resource monitoring. |
|
Configure correlation and tracing with browser, application, database, and infrastructure telemetry where available. |
|
Deploy the GermainUX Code Profiler when supported application-code analysis is required. |
|
Deploy GermainUX RUM JS or the RUM Extension when real-user browser monitoring and Session Replay are required. |
|
Configure SLAs, alerts, dashboards, and reports. |
|
Configure approved automated actions when diagnostic or remediation workflows are required. |
ℹ️ Get Help
The Germain Team can help you set this up. Contact GermainUX Support.
Component: Engine, JS Profiler, Mobile, RPA Bot Recorder, RUM JS, RUM Extension
Feature Availability: 2017.1 or later