Here is how to narrow down your analysis of errors, and only focus on the ones that affect users and exclude the ones that don’t directly impact users (i.e. remove “the noise”).
Important to note that it is obviously not because users don’t see an error that an error should be ignored. Some errors may impact business operations and not impact users. Contact us if you need to discuss this or get help on configuring automation around that.
Only show errors seen by users
Here is how to display on an aggregate dashboard, the errors that are seen by Users. That can be achieved with most portlet.
-
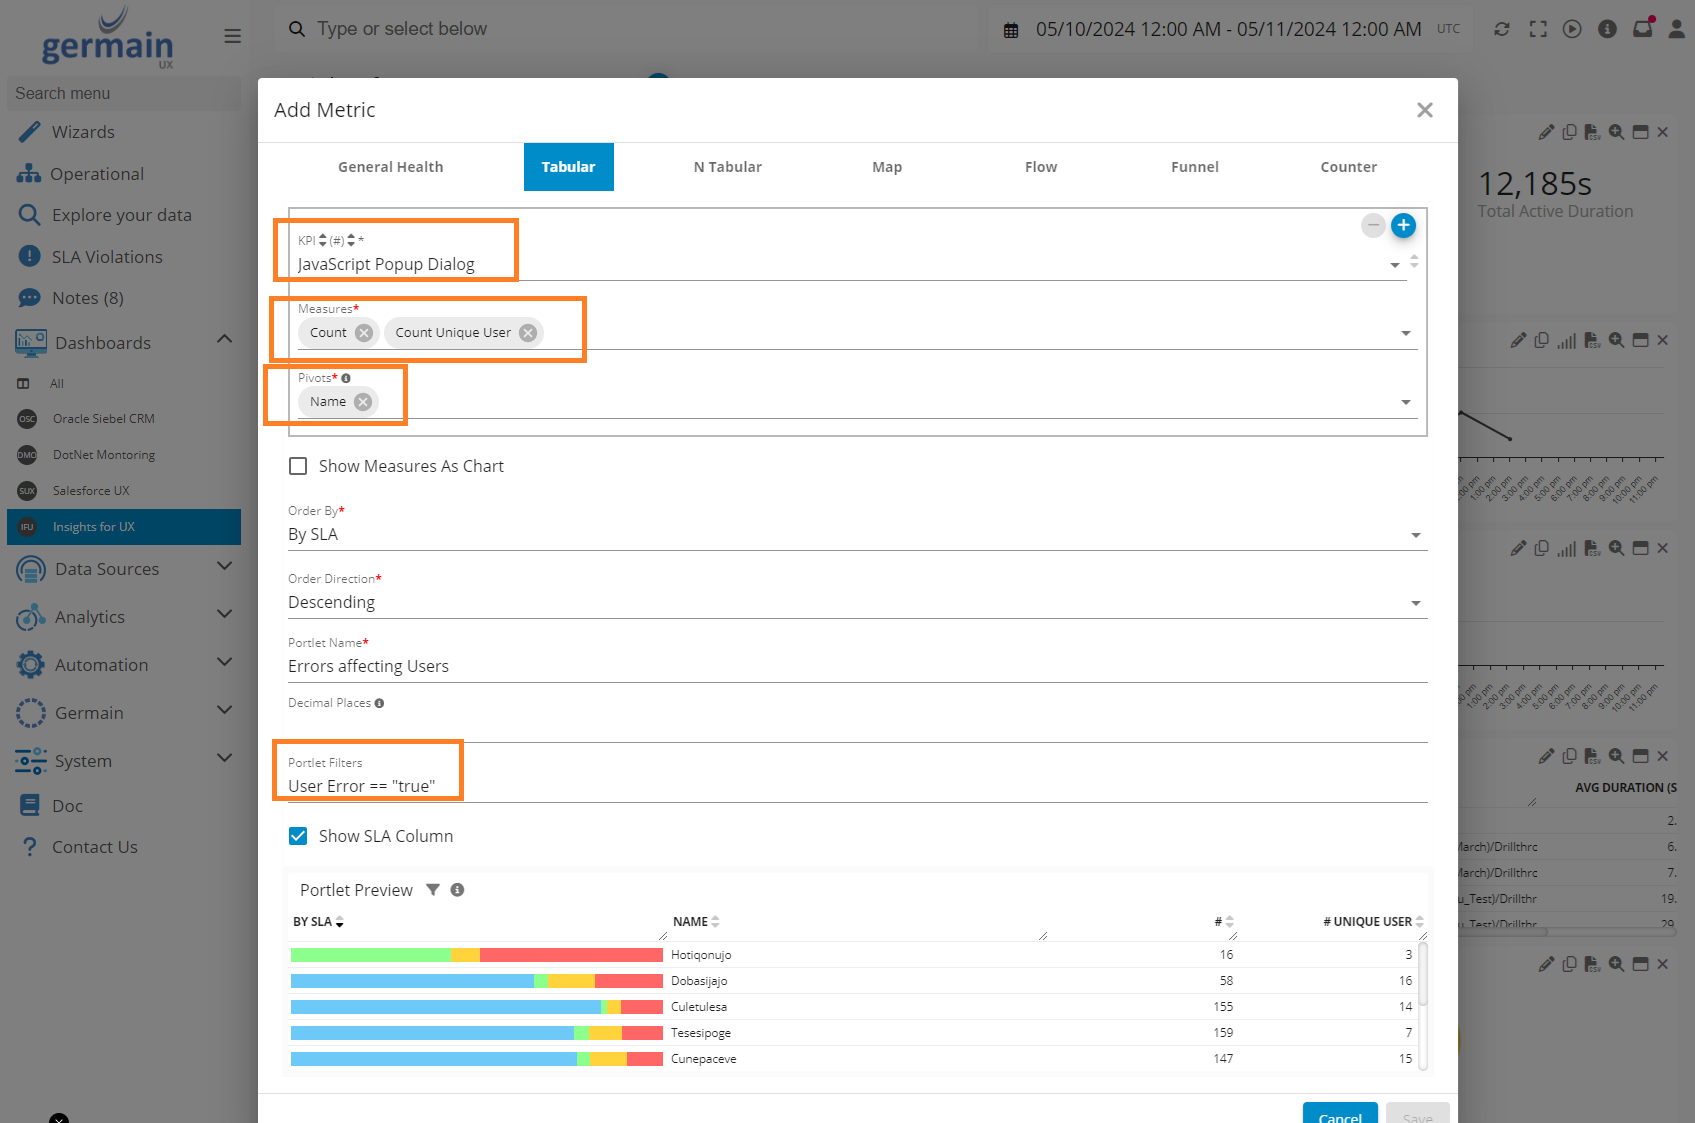
KPIs (any catching errors such as):
-
(or any other KPI you have created in conjunction to monitoring errors).
-
Measures:
-
“Count”, “Count Unique User”, etc
-
-
Pivots:
-
”Name” or ”Message”
(depending on the KPI)
-
-
Filters:
-
”User Error” == “true”
-
Example of a Tabular portlet only showing error seen by users:
Here are more details on how to configure Germain UX to monitor and analyze errors that affect users for these technologies:
For other applications, please contact us.
Note that Germain UX’s Error Monitoring mechanism is half plug-an-play, why? Errors are not always detected in the same way across various applications e.g., Salesforce, Siebel, and Shopify are built on different JS framework , architected differently, and as such employ different error-producing mechanisms. As a result, Germain UX’s Error Monitoring mechanism has to be configured specifically for each of your applications.
Feature Availability: 2022.1 or later