Customer(s)
American Airlines, General Electric, Largest US-Based Healthcare, Volvo
Description
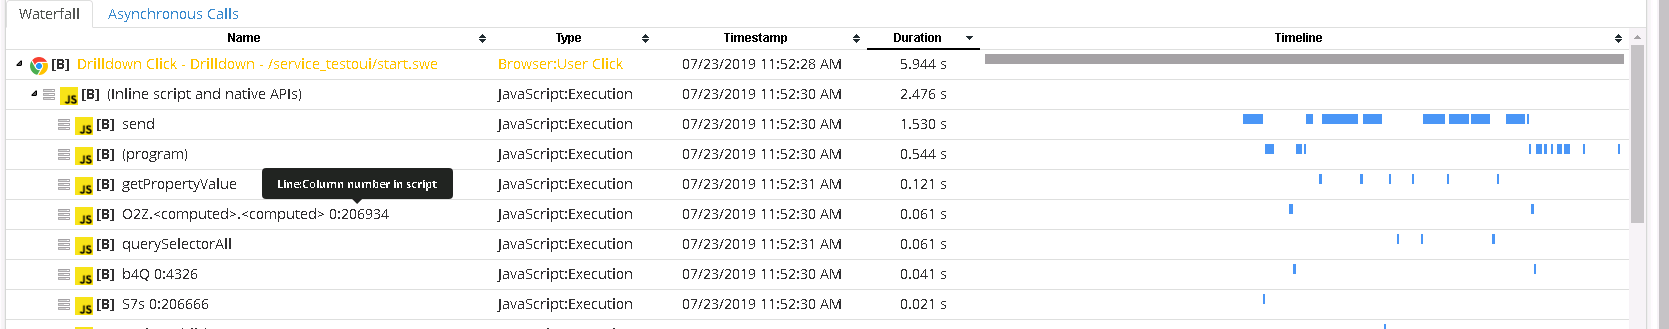
Real-time performance monitoring and analysis of Javascript function, down to the line of code, for any web application. That feature completes the end-to-end time breakdown of a user click (>java script>network request>web request>application code>database sql,...levels and any integration layers)
Metrics provided: any metric that Google Chrome provides, including:
-
Javascript method execution time
-
Javascript line (of code) execution time
-
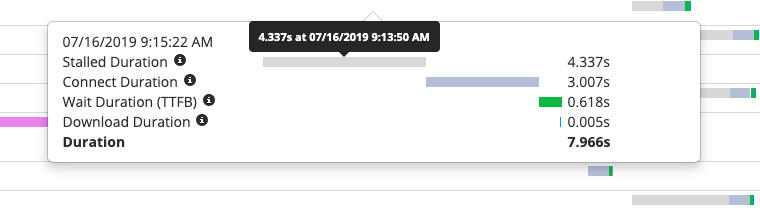
Stall duration
-
Download duration
-
Wait duration
-
etc
Supported Technologies:
-
AngularJS
-
ReactJS
-
VueJS
-
Javascript
Reminder: that end-to-end analysis of a user click or transaction, is configurable by you, so you can further define data relationship and can include any data sources (e.g. integration layer) into the mix.
Configure
Try It (15-day free trial)
https://germainux.com/cloud-signup/
Examples
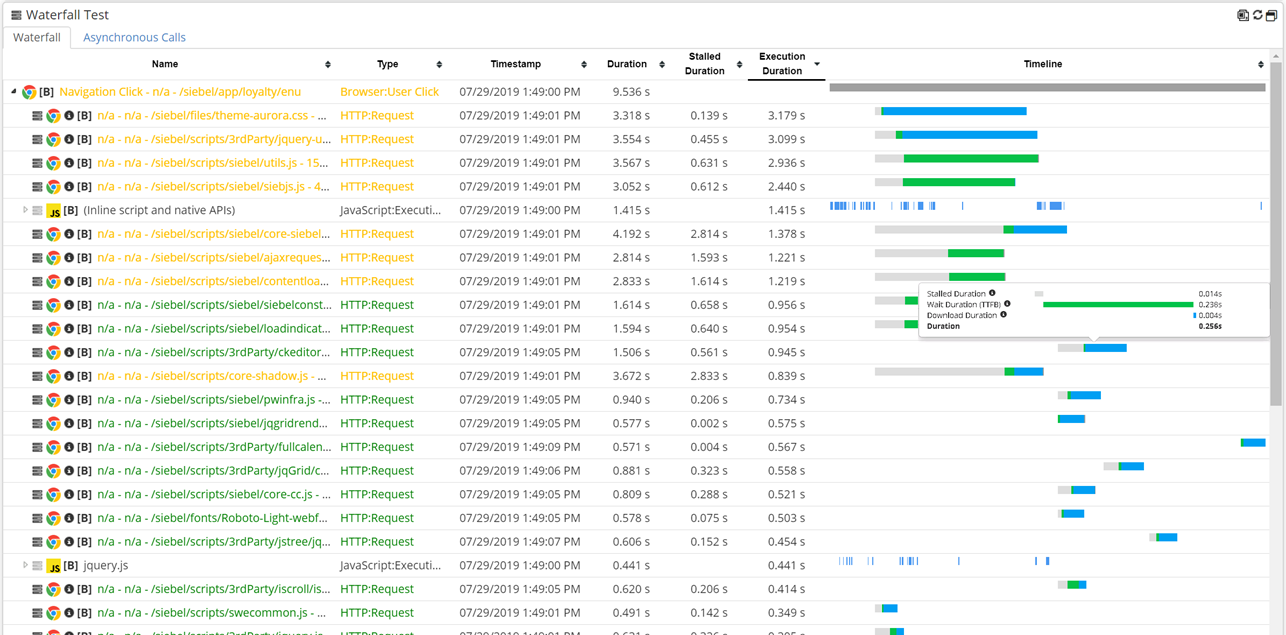
a better view of a java script execution time breakdown
and some insights on whether this is stall, connection, wait, download ,etc
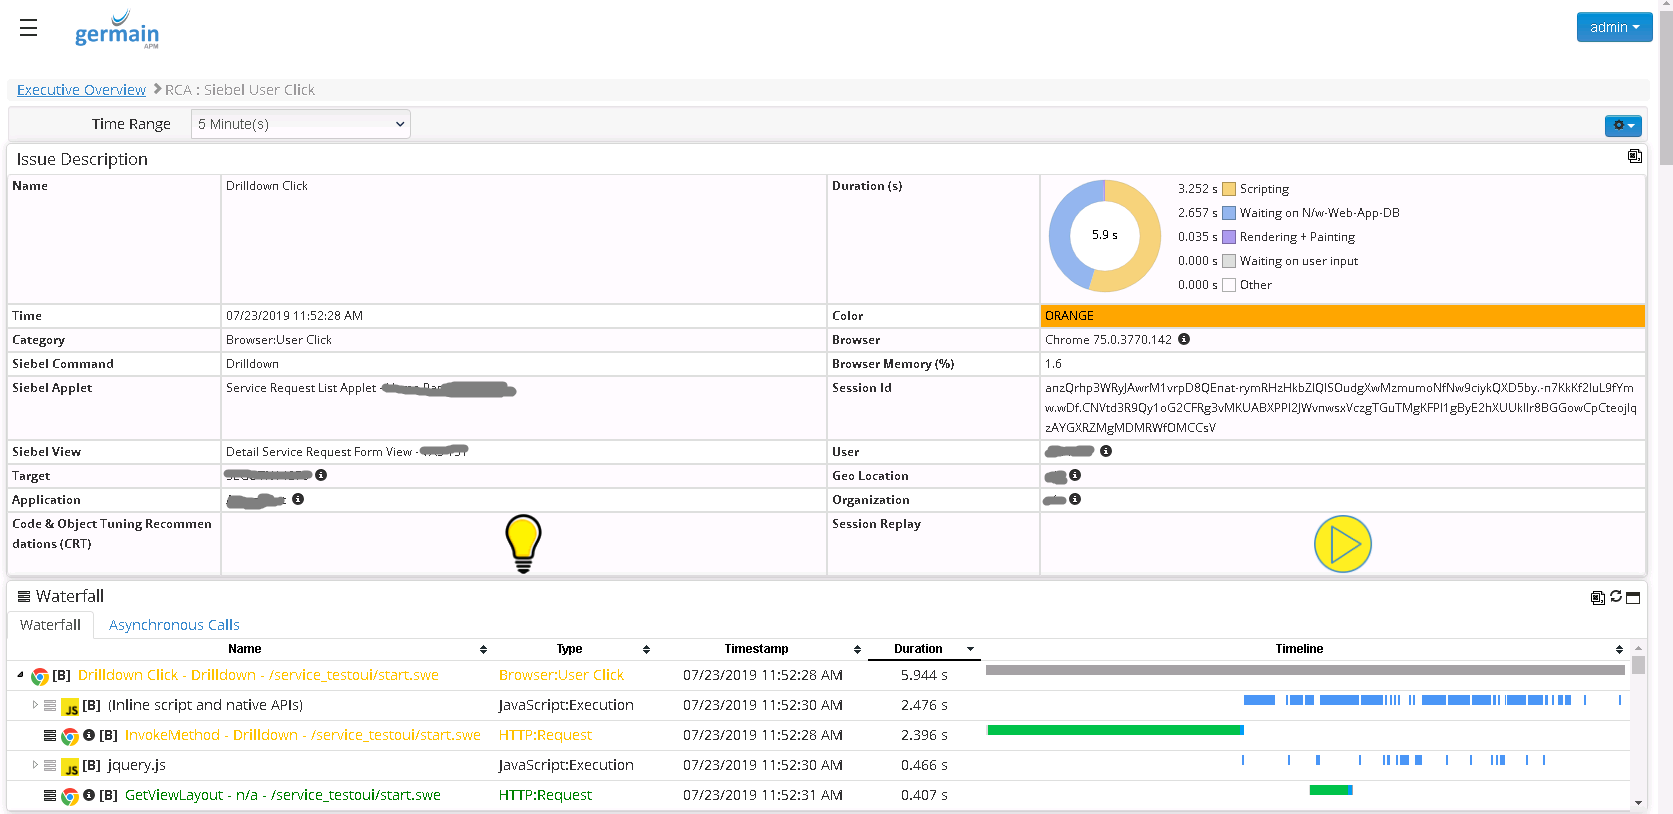
and for a User Click RCA, that s how it looks: