Feature
Correlates two symmetric sets of data (ex: HTTP requests recorded in browser with backend transaction) when it is not possible to send along / receive correlation IDs.
This approach relies on a fuzzy matching algorithm that tries to pair up data from two sources when there is no unique ID available, based on a customizable Cost Function that defines what criteria to use to do the matching e.g.time and duration.
This mechanism can be used in conjunction with ID-based correlation to fill in gaps (for example, context UX HTTP requests with backend transactions when no access to HTTP headers is available on a webserver).
Cost Function are fully customizable.
Configuration
The following example defines a Stream Correlation scenario to match and link UX requests (collected by Germain from within user's browsers) and info available in a Web Server access logs, of a generic web application.
-
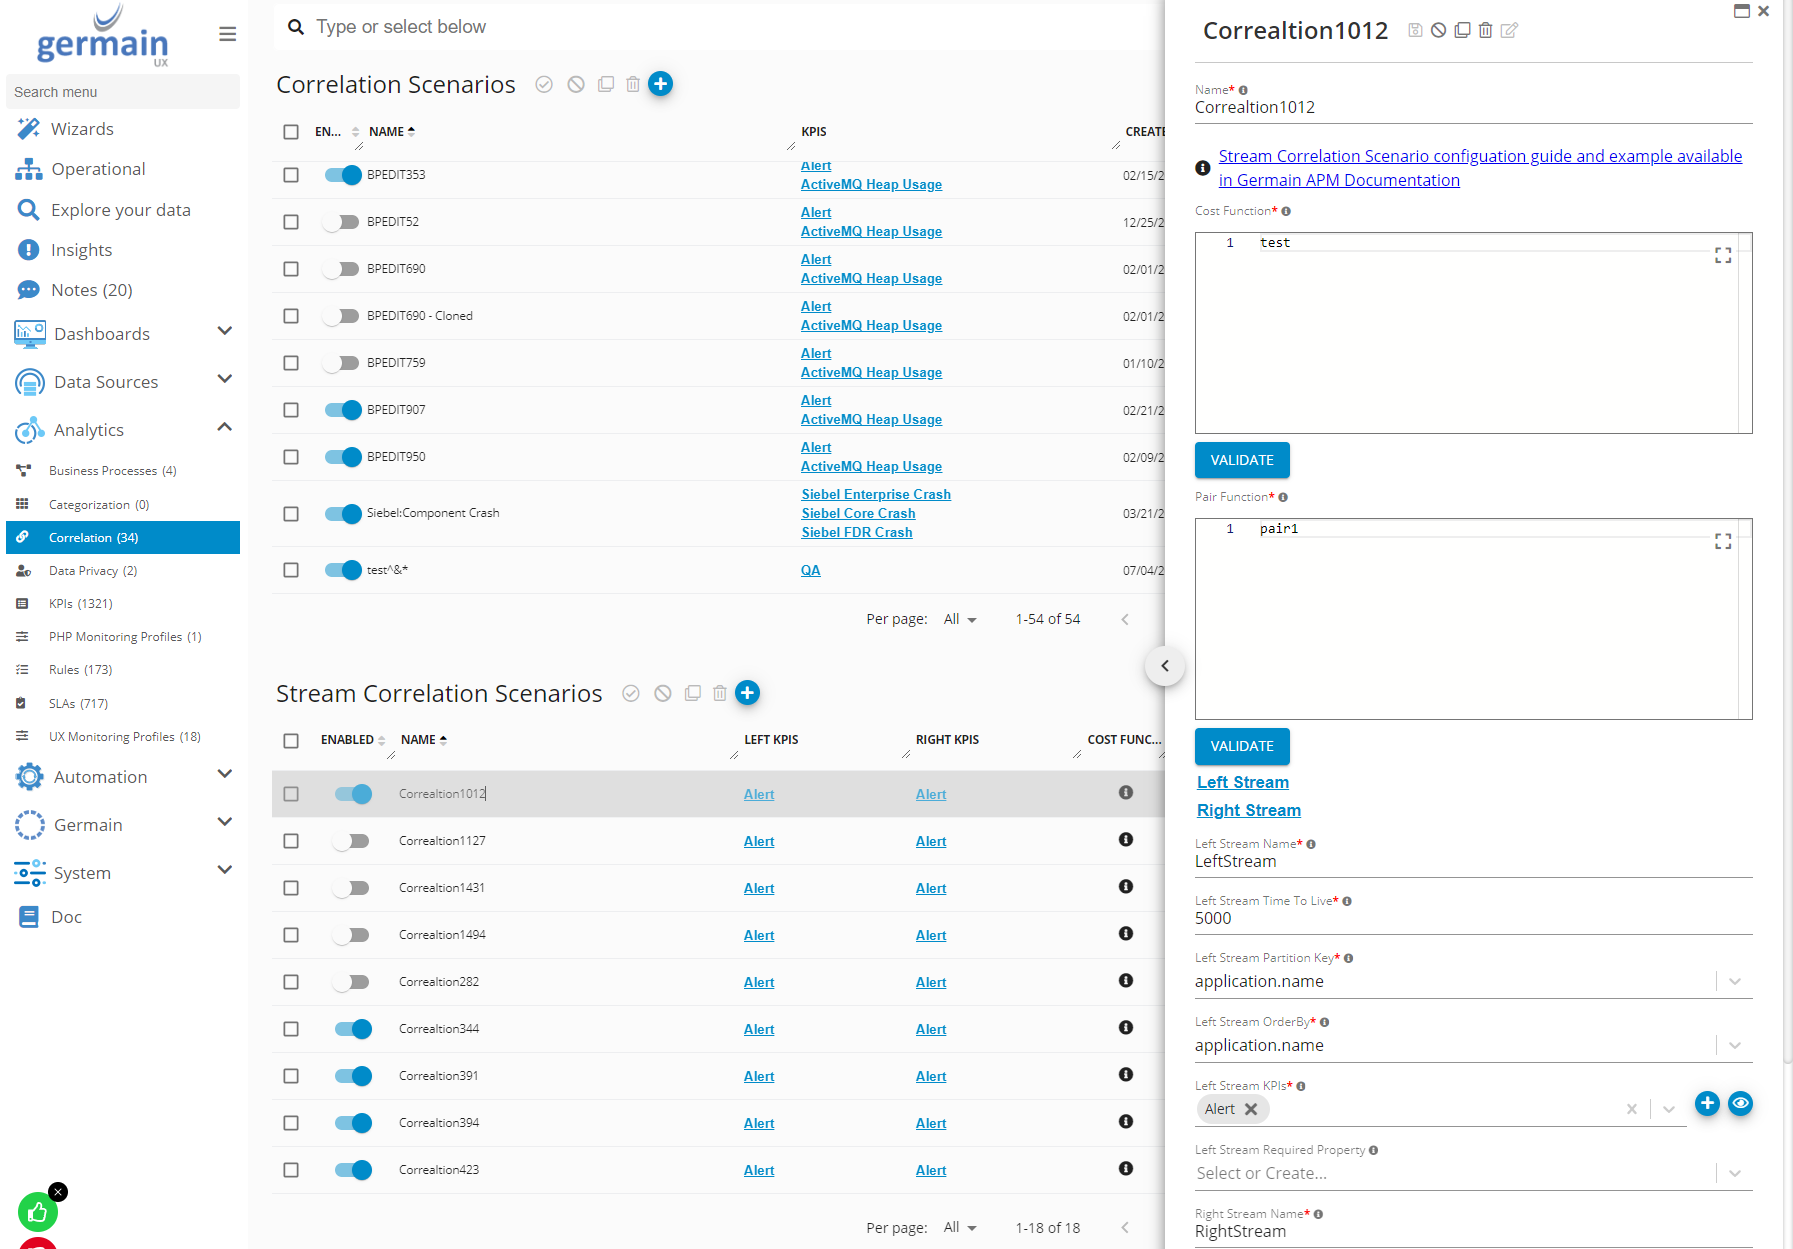
Navigate to Analytics → Correlation
-
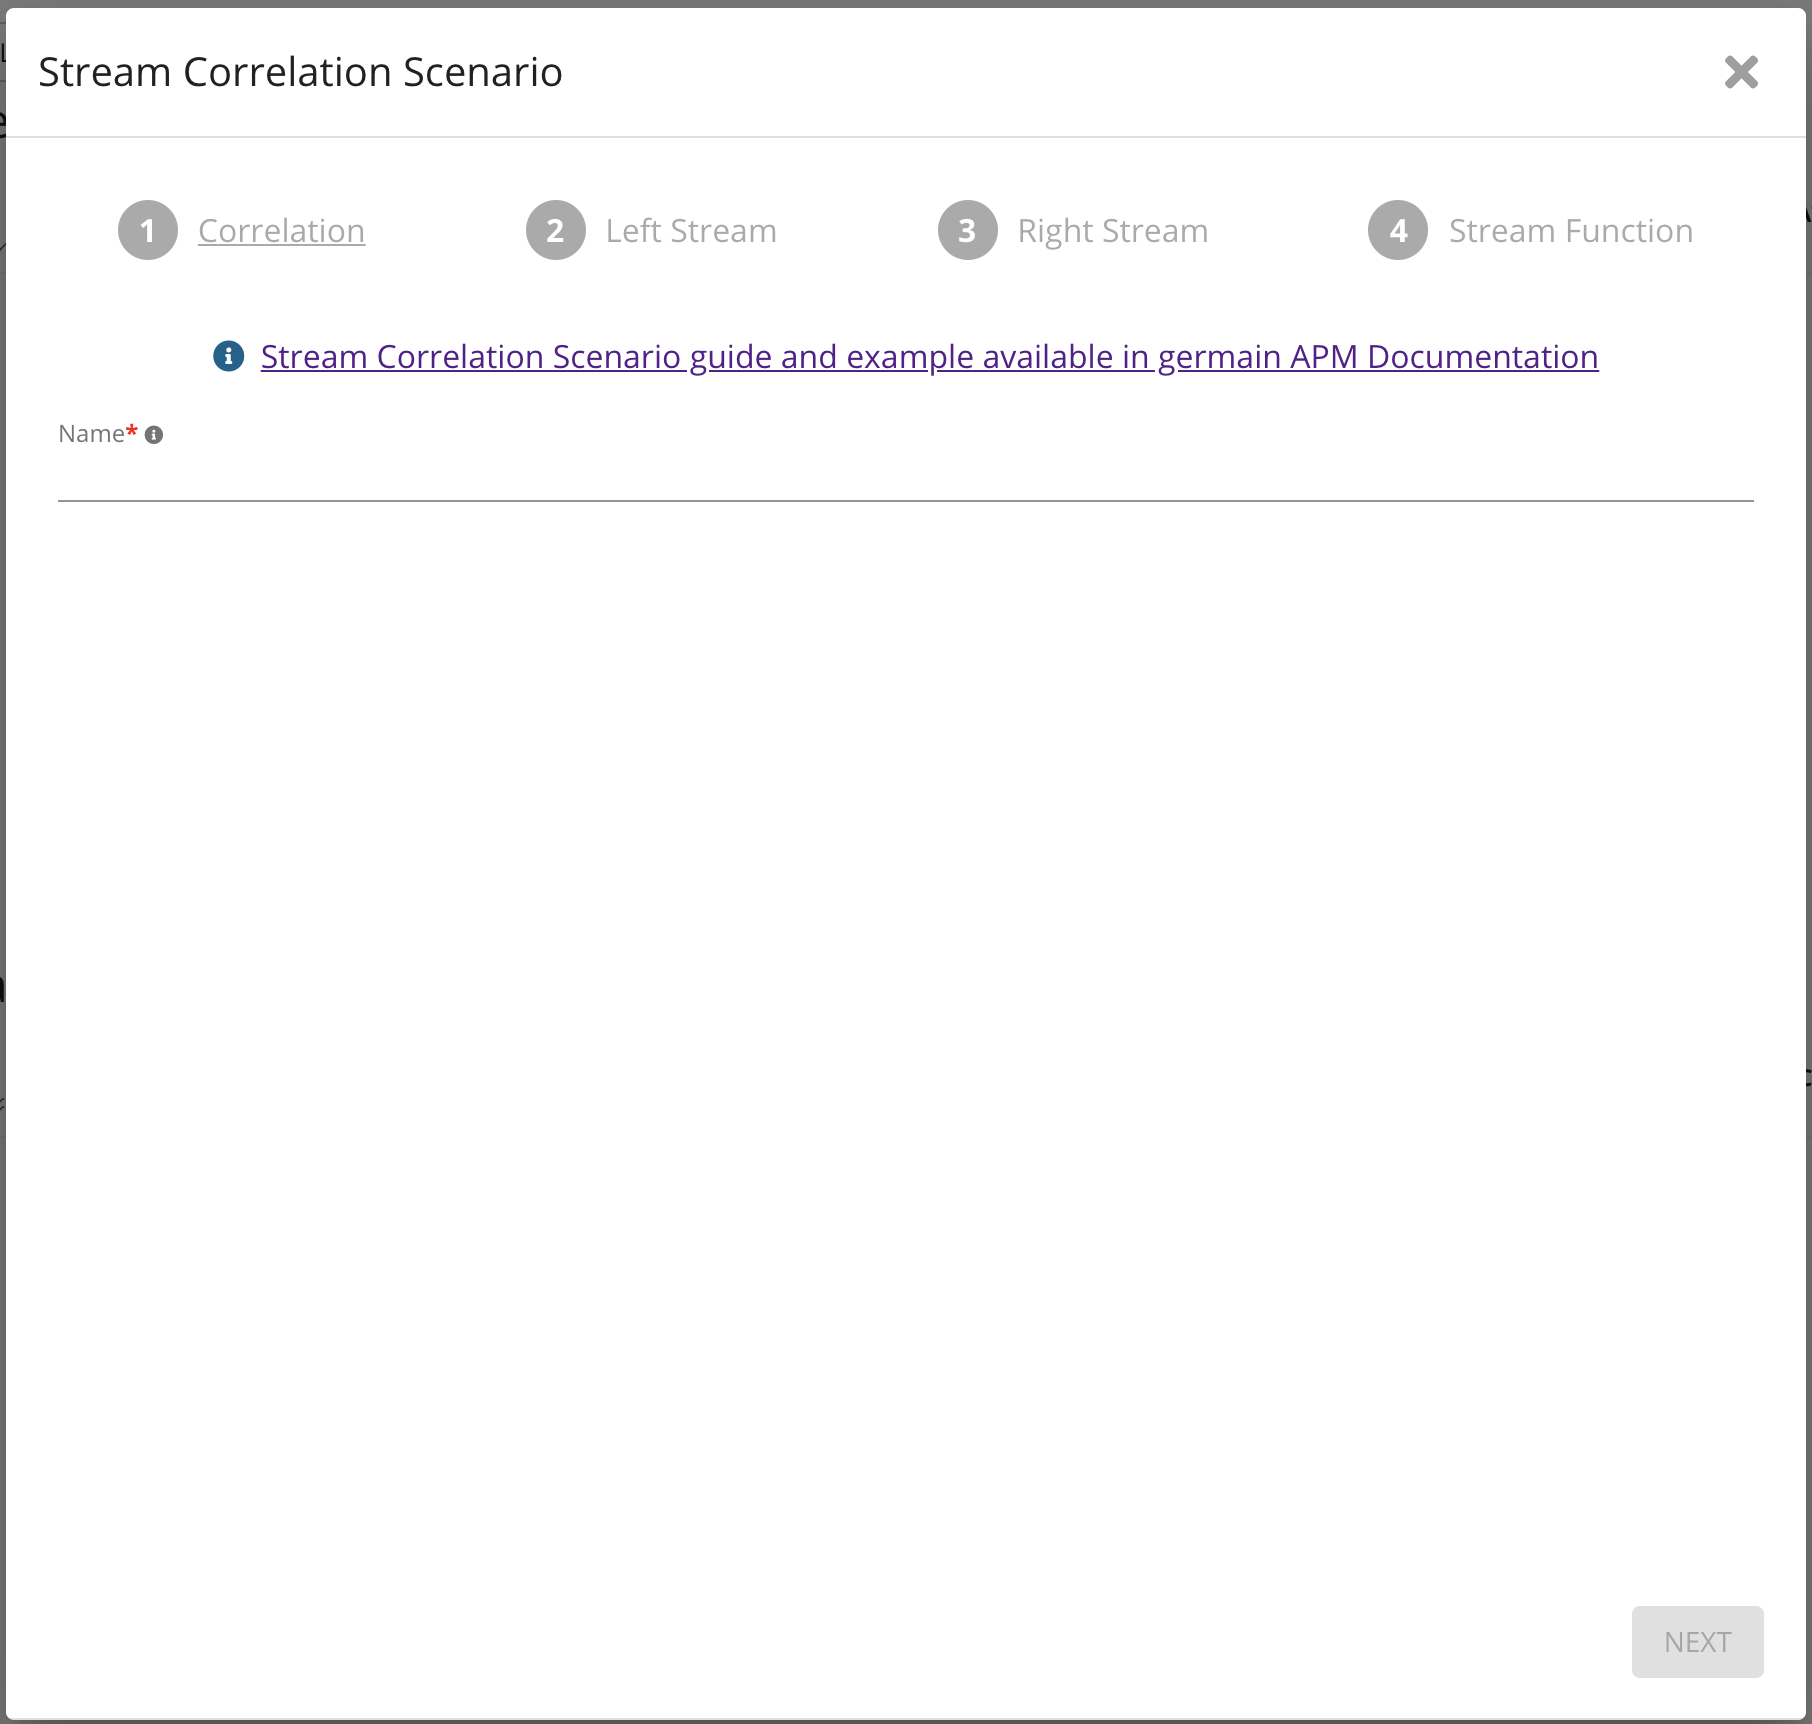
Click add/plus button under Stream Correlation Scenarios
-
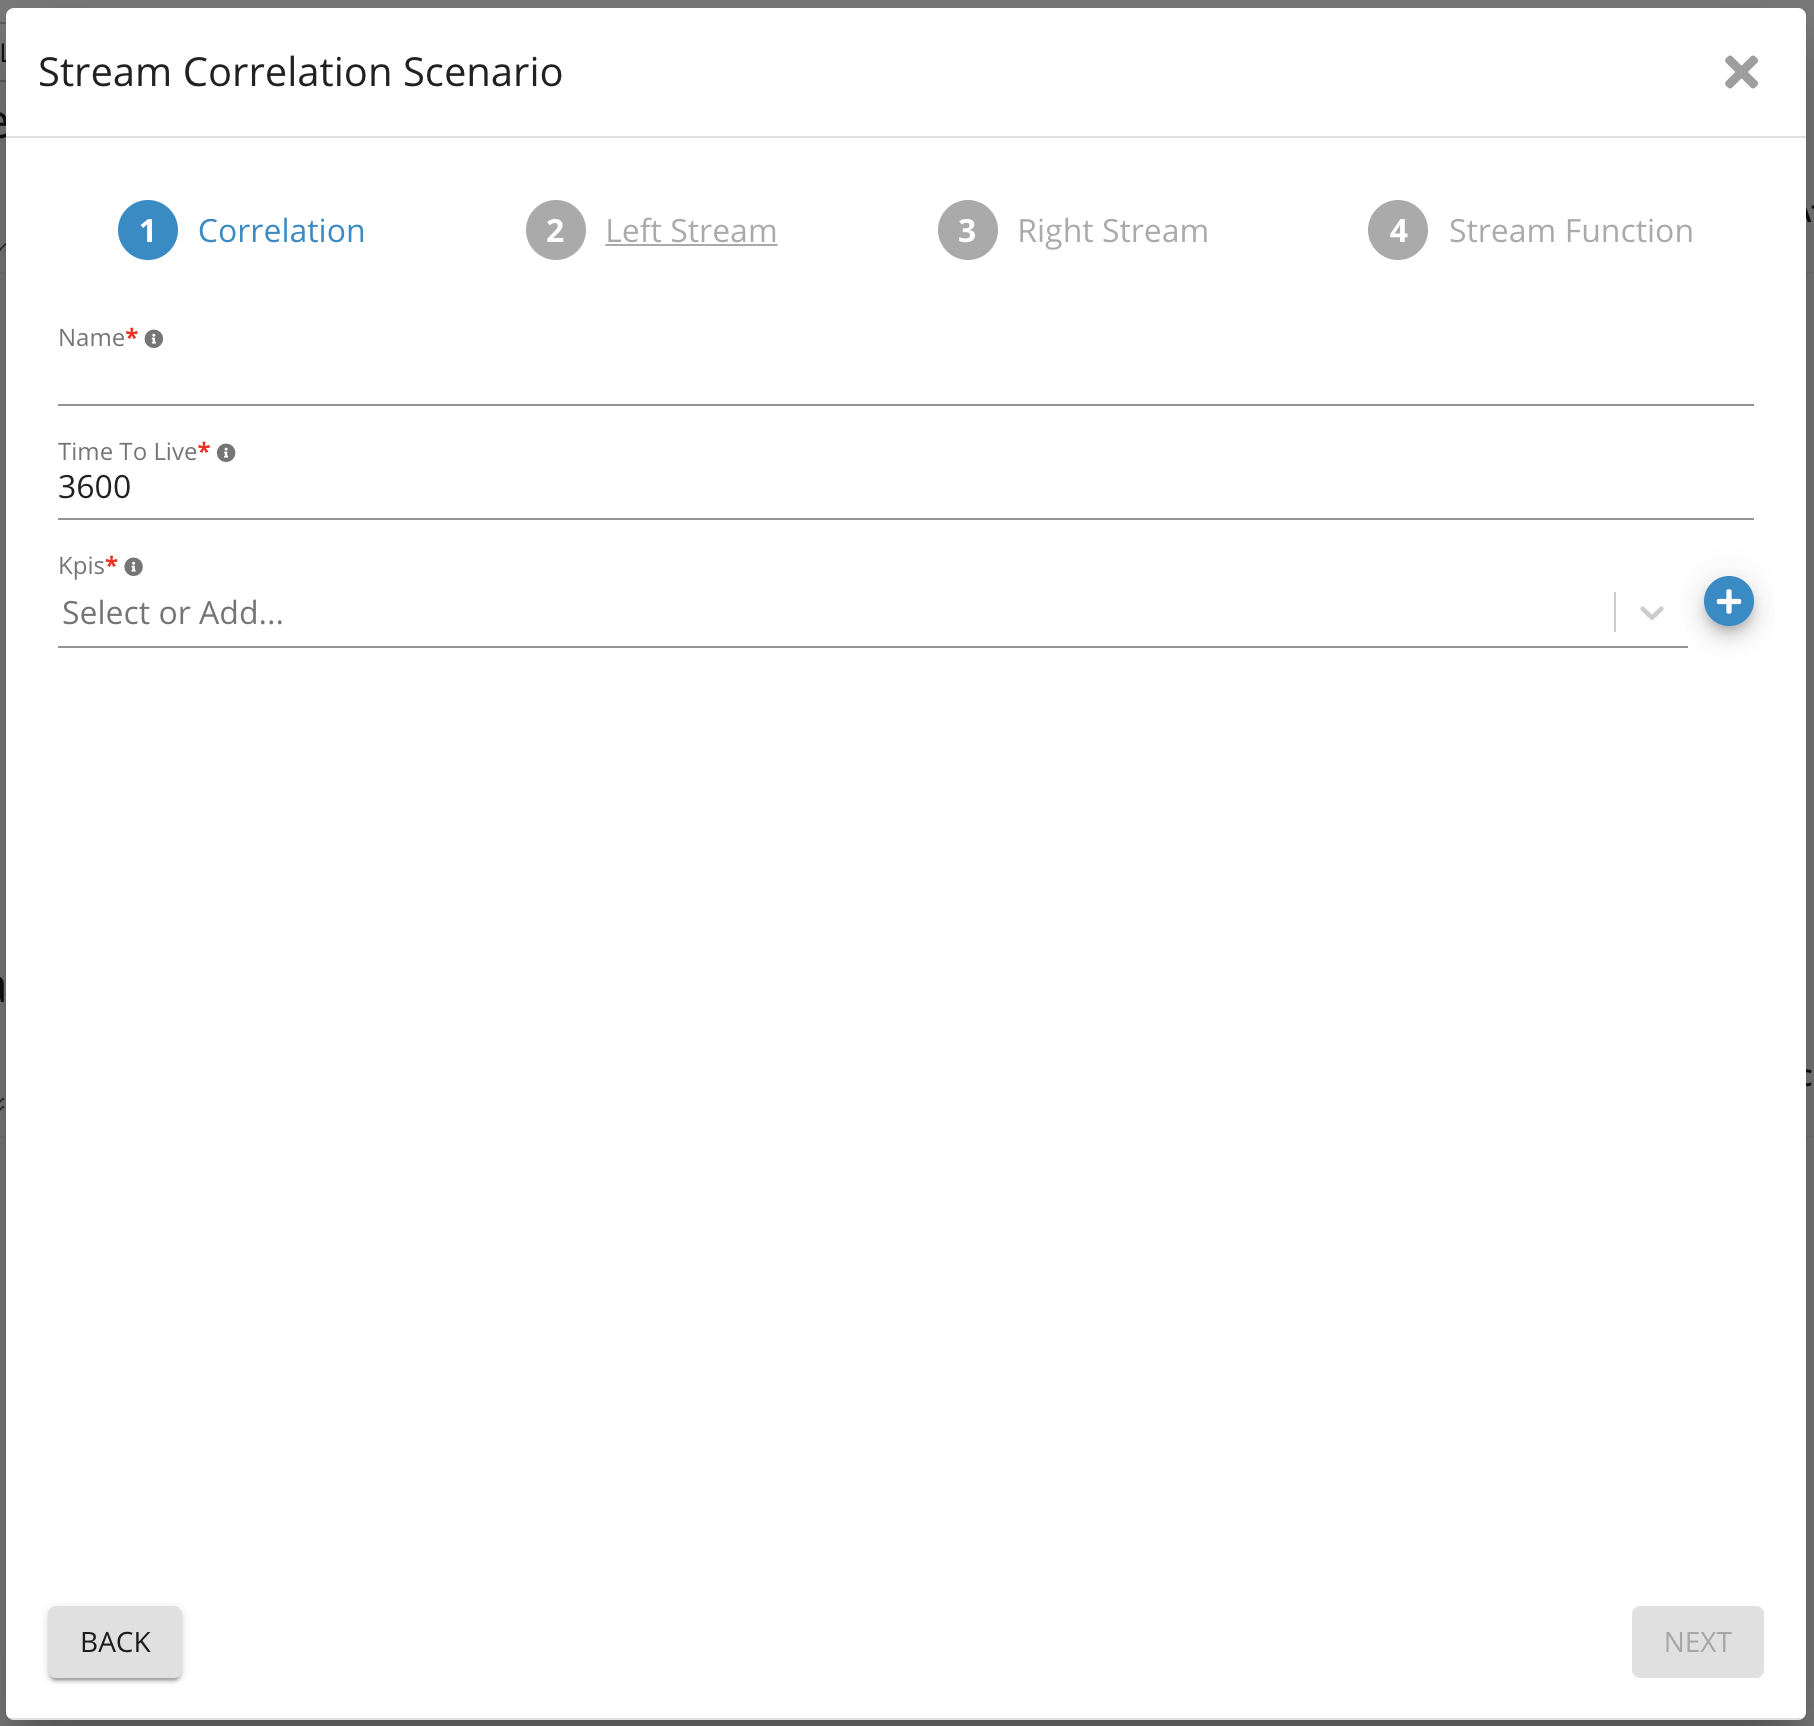
Provide a name for this correlation scenario
-
Click Next
-
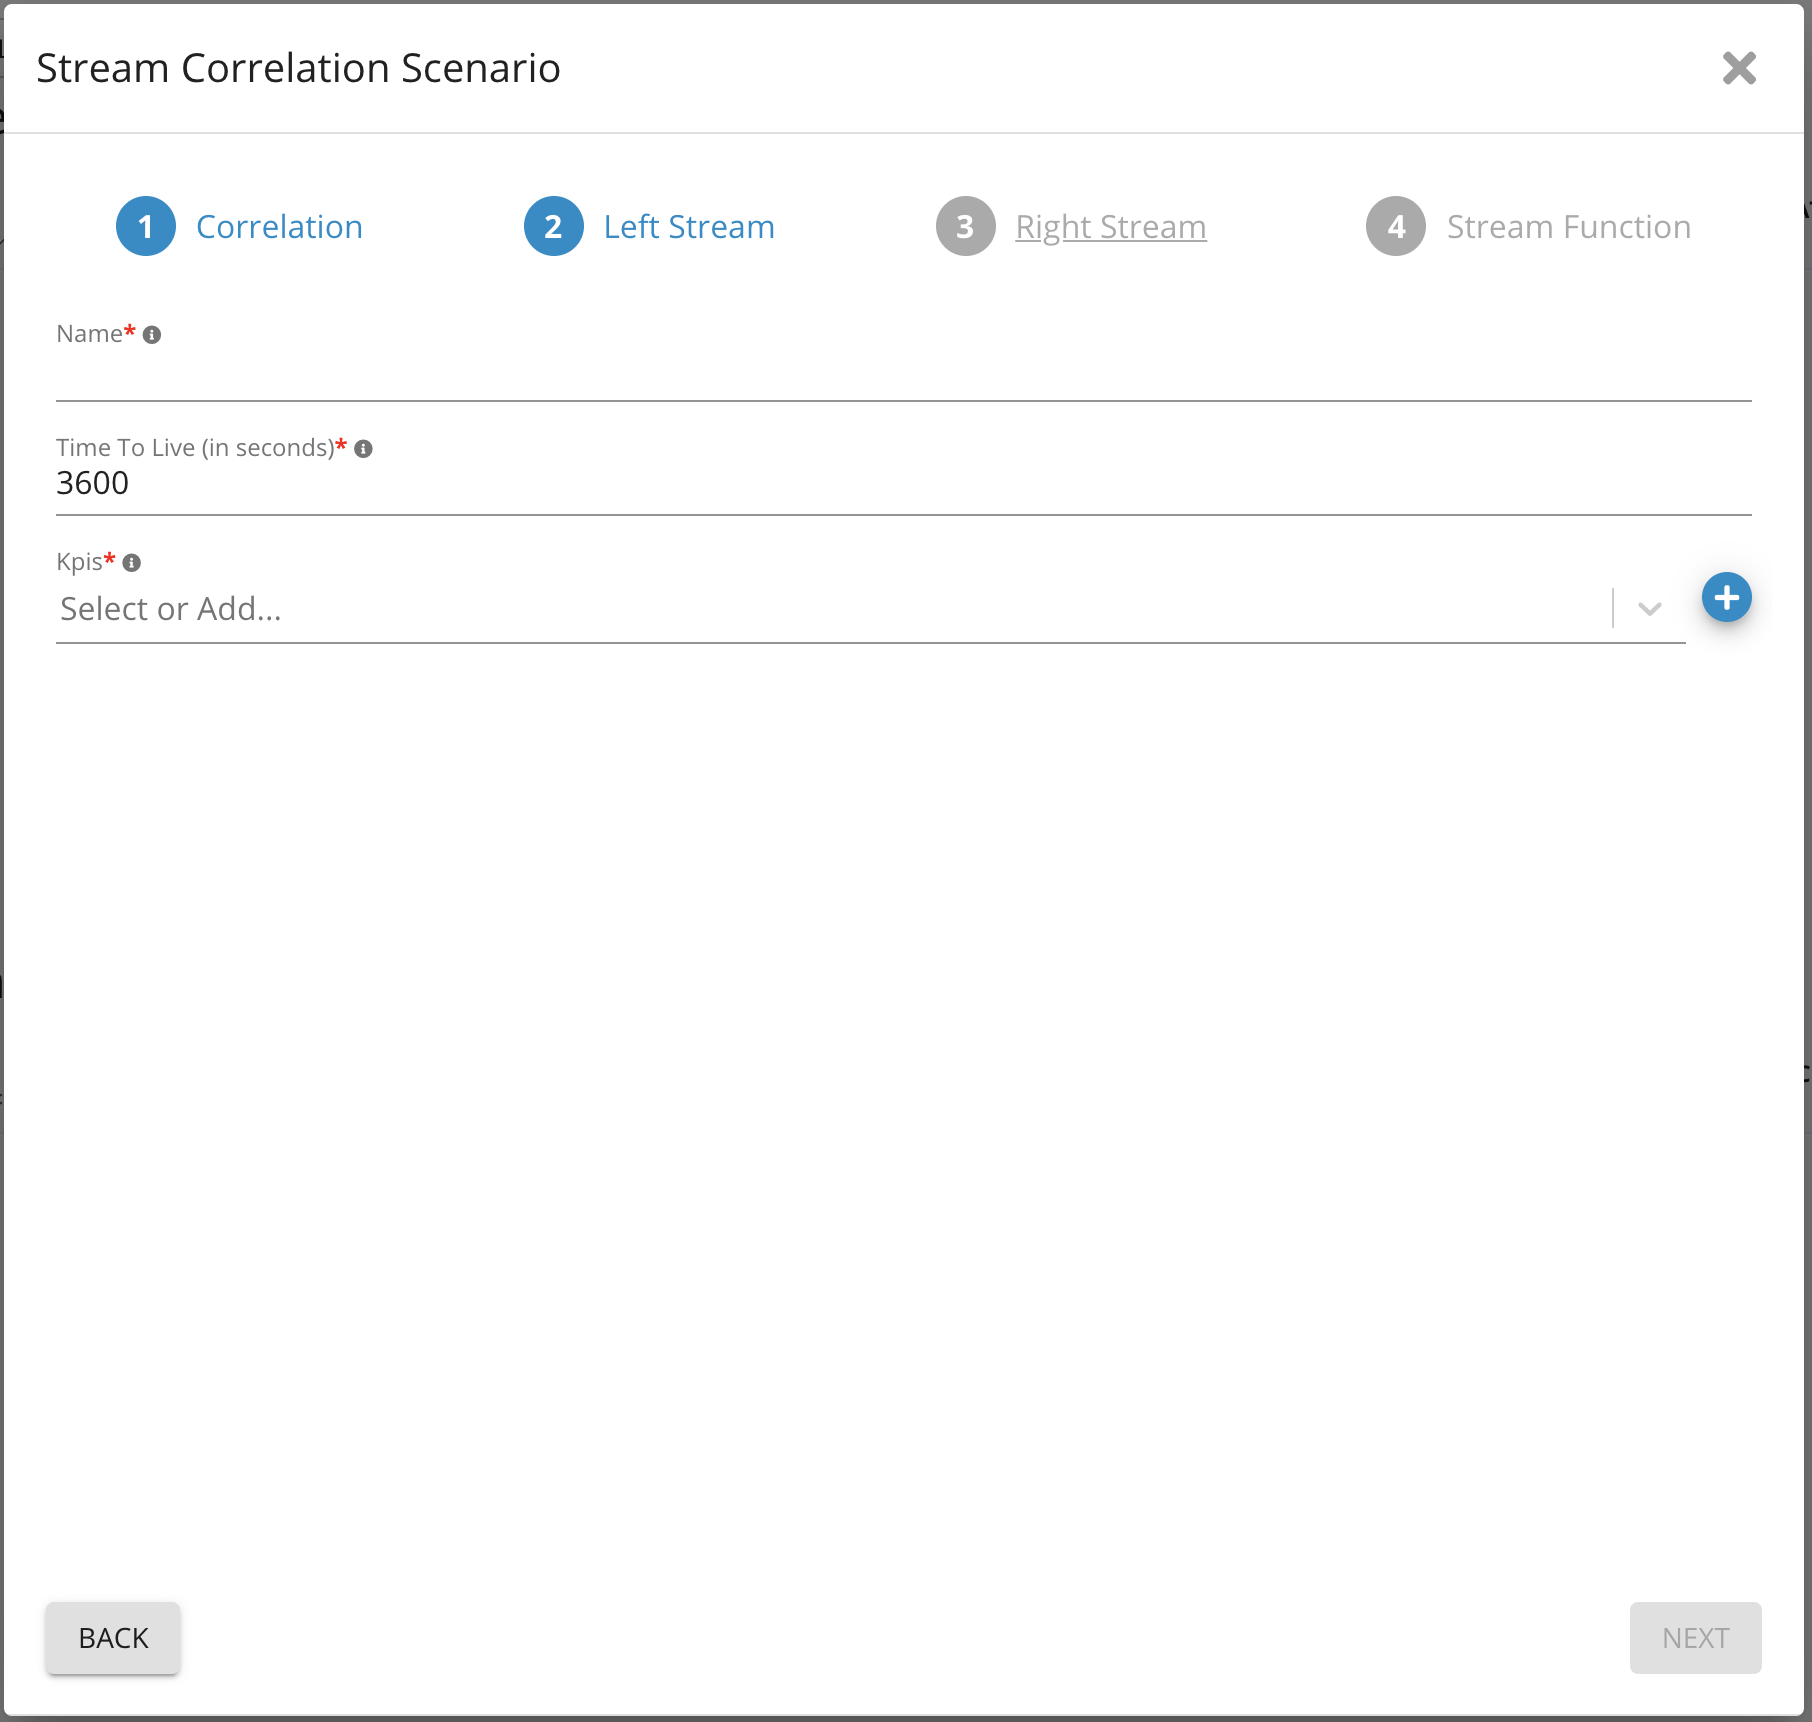
Provide a name for the Left Stream(This is the first source of data that we will correlate)
-
Select a KPI from the drop-down list
-
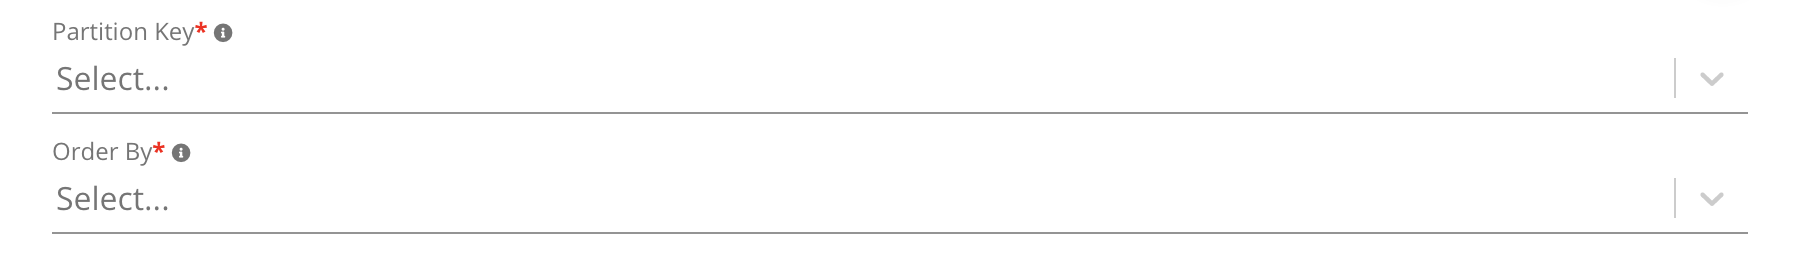
Select Partition Key (This will be the field used to correlate with the second data source. For example, sessionId)
-
Choose which field to order by
-
Click Next
Repeat steps 5-10 for Right Stream (This is the second data source)
-
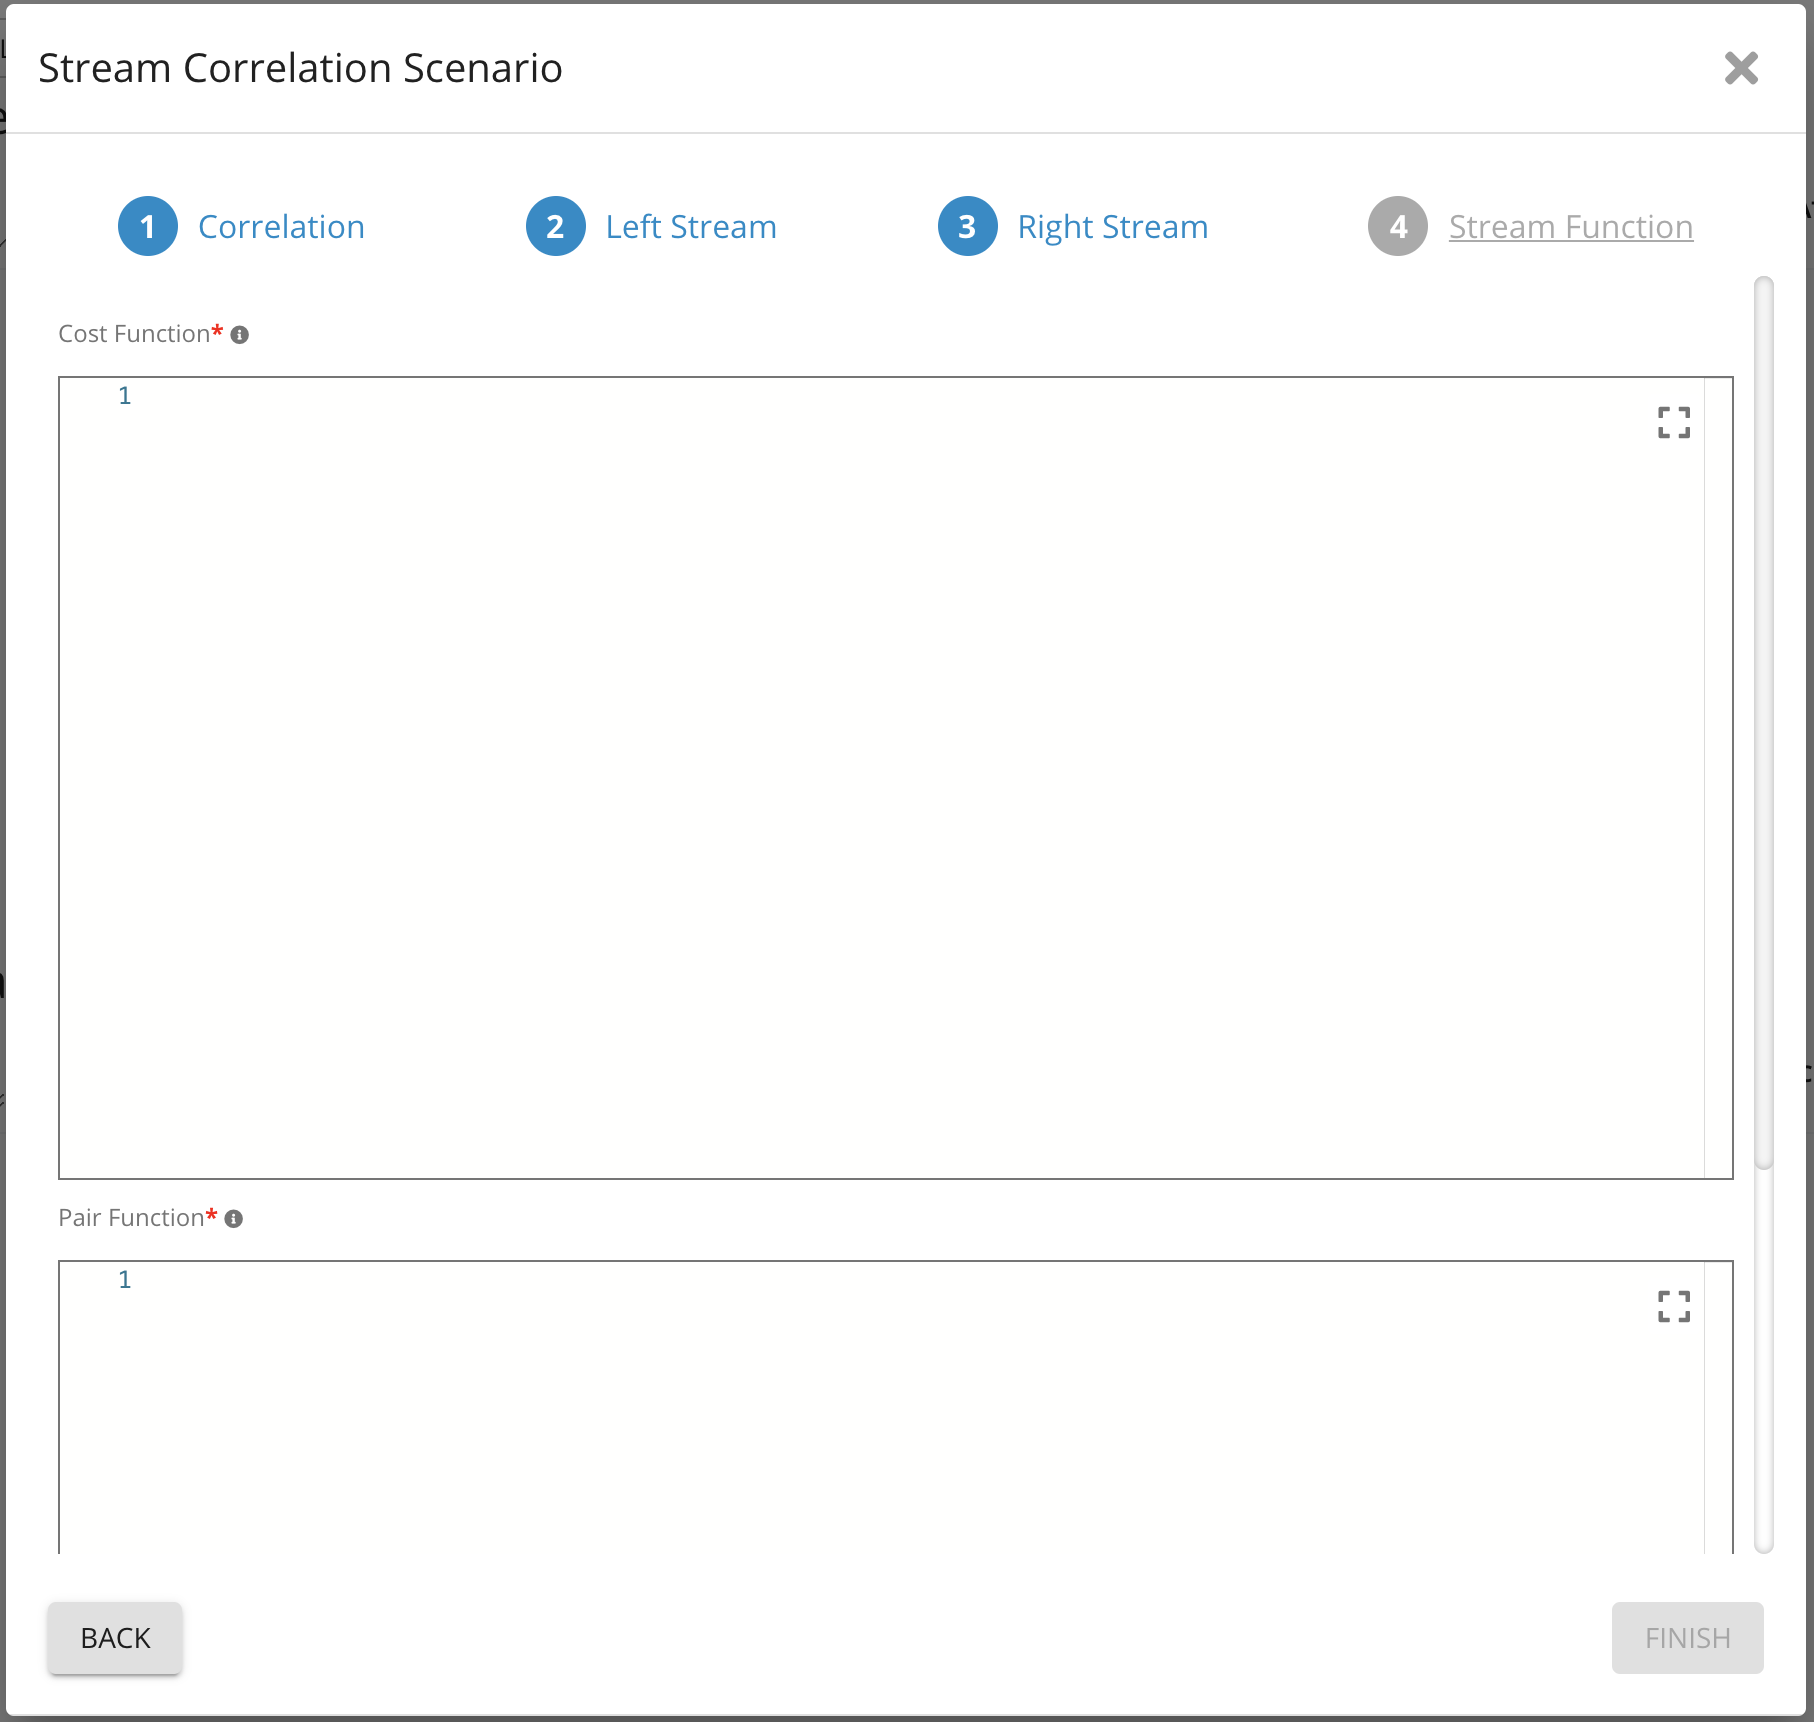
Now that we have defined the data to be correlated, let’s define a cost function. The function should return a numeric value that represents how similar two data points are – the lower the cost, the more similar they are, with a cost of 0 indicating that they are identical. In this case, we’ll only compare the data timestamps and durations.
Cost Function Example
if (left == null II right == null) //1 Returns a fixed cost to skip either left or right return 20 * 60.0; double cost = 0.0; long timestampLeft = left.timestamp.toEpochSecond(java.time.ZoneOffset.UTC); long timestampRight = right.timestamp.toEpochSecond(java.time.ZoneOffset.UTC); cost += Math.abs(timestampLeft - timestampRight); // add cost based on difference in timestamp cost += Math.abs(left.duration - right.duration); // add cost based on difference in duration return cost; -
Finally, we define the pair function – in this example, if a pair was found, we store the ID of the access log transaction on the UX transaction to be able to show this link on an RCA
Pair Function Example
if (left == null II right == null)
    return; // no match was found

left.backendSequence = right.sequence; // If copy sequence value from log tx to ux request tx
processor.updateFact(left);  // update use request in datamart
At this point, the stream correlation scenario is complete and the Germain analytics service will start processing the selected data.
Component: Engine
Service: Analytics
Feature Availability: 8.6.0 or later