
🌐 Browser Monitoring
GermainUX continuously monitors the performance, behavior, errors, and user experience of browser-based applications.
By combining Real User Monitoring, Session Replay, heatmaps, automated friction detection, network analysis, and customizable business events, GermainUX helps teams understand what users experienced, why an issue occurred, who was affected, and its business impact.
🎯 Business outcomes
Browser Monitoring helps organizations:
|
Outcome |
|---|
|
Improve user experience by detecting behavioral and technical friction. |
|
Increase conversion by identifying errors, slowness, and abandonment. |
|
Improve application adoption by revealing confusing or underused features. |
|
Increase employee productivity by identifying inefficient workflows and time lost. |
|
Reduce issue-investigation time with searchable Session Replay and technical evidence. |
|
Detect browser-specific regressions and compatibility issues. |
|
Prioritize improvements according to affected users and business impact. |
|
Notify teams or initiate approved actions when important conditions occur. |
📦 Deployment options
|
Deployment |
When to use |
|---|---|
|
The monitoring script can be deployed in the web application |
|
|
Script injection is unavailable, browser-level deployment is required, or the application’s root page is controlled by a third party |
|
|
Deeper JavaScript execution analysis is required for selected diagnostic users |
|
|
Critical browser workflows must be tested proactively |
The precise coverage depends on the application architecture, browser security model, selected GermainUX component, browser capabilities, and configured privacy controls.
👁️ Real User Monitoring
GermainUX records authorized browser activity as users interact with the monitored application.
Depending on the configuration, collected activity can include:
|
Activity |
|---|
|
Page loads and single-page application navigation |
|
Clicks, touches, searches, and selections |
|
Form and input activity |
|
Application and browser metadata |
|
JavaScript and console events |
|
Network requests |
|
User-visible messages |
|
Popup dialogs |
|
Browser freezes and long tasks |
|
Business-process milestones |
|
Customer-defined events |
|
User feedback |
The collected data remains structured, timed, and searchable for analytics and investigation.
🔁 Session Replay
GermainUX Session Replay visually reconstructs each monitored browser session with millisecond-level event timing.
Authorized users can:
|
Capability |
Description |
|---|---|
|
Sequence |
See what a user did before and after an issue. |
|
Navigate |
Navigate directly to errors, slow requests, or workflow events. |
|
Visibility |
Determine whether an error was visible to the user. |
|
Inspect |
Inspect related console and network activity. |
|
Search |
Search for users, pages, text, actions, and business identifiers. |
|
Compare |
Compare successful and unsuccessful sessions. |
|
Investigate |
Investigate complaints without requiring the user to reproduce the problem. |
Session Replay is more than a video. The underlying activity remains available as structured events that can be analyzed across the entire monitored population.
See User Session Monitoring, Replay & 6 Heatmaps.
🔥 Heatmaps
GermainUX provides six heatmap and behavioral-overlay types for analyzing activity within individual sessions or across groups of users.
Heatmaps can help identify:
|
Insight |
Details |
|---|---|
|
Frequently used areas |
Frequently used page areas |
|
Neglected elements |
Elements that attract little attention |
|
Dead clicks |
Dead or ineffective clicks |
|
Repeated interactions |
Repeated interactions |
|
Rage clicks |
Rage clicks |
|
Engagement patterns |
Engagement and navigation patterns |
|
Scroll behavior |
Scroll and visibility behavior |
|
Segment differences |
Differences between user segments or outcomes |
Heatmaps should be interpreted alongside Session Replay and business outcomes. A frequently clicked element may be successful, confusing, or unresponsive depending on what happens afterward.
🖱️ Click and interaction monitoring
GermainUX monitors browser clicks and can automatically distinguish:
|
Interaction |
Description |
|---|---|
|
Standard click |
A normal mouse click or touch interaction |
|
Dead click |
An interaction that produces no detected page effect within the configured period |
|
Error click |
An interaction followed by a JavaScript console error |
|
Rage click |
Repeated, consecutive interactions with the same element |
|
User action |
A customer-defined interaction associated with a feature or business event |
Thresholds and exclusions can be adjusted for the monitored application.
See Dead, Error and Rage Click Monitoring.
🚤 Page and user-experience performance
GermainUX measures browser performance as experienced by real users.
Available insights can include:
|
Metric |
Details |
|---|---|
|
Page-load duration |
Page-load duration |
|
SPA route changes |
Single-page application route changes |
|
Interaction response |
User-interaction response time |
|
Resource load |
Resource-load duration |
|
Network duration |
Network-request duration |
|
Element visibility |
Element visibility and performance |
|
Custom marks
|
Custom performance marks and measures |
|
Long tasks |
Browser long tasks |
|
Freezes |
Browser freezes |
|
JS memory |
JavaScript memory consumption |
|
Page memory |
Page memory consumption |
|
Server-Timing |
Server-Timing values |
Results can be segmented by page, route, browser, browser version, device, operating system, geography, application version, user group, or another authorized attribute.
🧭 Core Web Vitals
GermainUX collects supported Core Web Vitals and related browser-performance metrics made available by the monitored browser.
These can include:
|
Vital |
Details |
|---|---|
|
Largest Contentful Paint |
Largest Contentful Paint |
|
Cumulative Layout Shift |
Cumulative Layout Shift |
|
Responsiveness |
Browser responsiveness metrics available to the installed GermainUX and browser versions |
|
Related measurements |
Related page-load and interaction measurements |
Browser support and the Core Web Vitals defined by browser vendors evolve over time. The available metrics therefore depend on the GermainUX version, browser, and browser API support.
See Core Web Vitals.
📑 Element and performance-mark monitoring
Monitor the visibility and performance of important page elements and customer-defined browser performance marks.
Examples include:
|
Example |
Details |
|---|---|
|
CTA appearance |
Time until a primary call to action appears |
|
Search results |
Time until search results are displayed |
|
Dashboard usability |
Time until a dashboard or report becomes usable |
|
Modal appearance |
Time until a modal or customer record appears |
|
Milestone duration |
Duration between two application-defined milestones |
|
Element presence |
Whether an expected element was displayed |
See Element and Mark Performance Monitoring.
🐛 JavaScript errors and console events
GermainUX captures supported browser-console activity and JavaScript errors, including:
|
Captured |
Details |
|---|---|
|
Exceptions |
JavaScript exceptions |
|
Console issues |
Console errors and warnings |
|
Promise rejections |
Unhandled promise rejections |
|
App messages |
Application-generated console messages |
|
Stack traces |
Stack traces when available |
|
User-associated errors |
Errors associated with a user interaction |
|
Contextual errors |
Errors associated with an application version or page |
Teams can analyze:
|
Analysis |
Details |
|---|---|
|
New vs recurring |
New versus recurring errors |
|
Affected users |
Affected users and sessions |
|
Trends |
Frequency and trend |
|
Context |
Application, page, browser, and version |
|
Visibility |
Whether the error was visible to the user |
|
Related activity |
Related user actions and network requests |
|
Business impact |
Conversion, workflow, or productivity impact |
See JavaScript Console and Error Monitoring and Unhandled Promise Rejection Monitoring.
⏳ Browser freezes and JavaScript long tasks
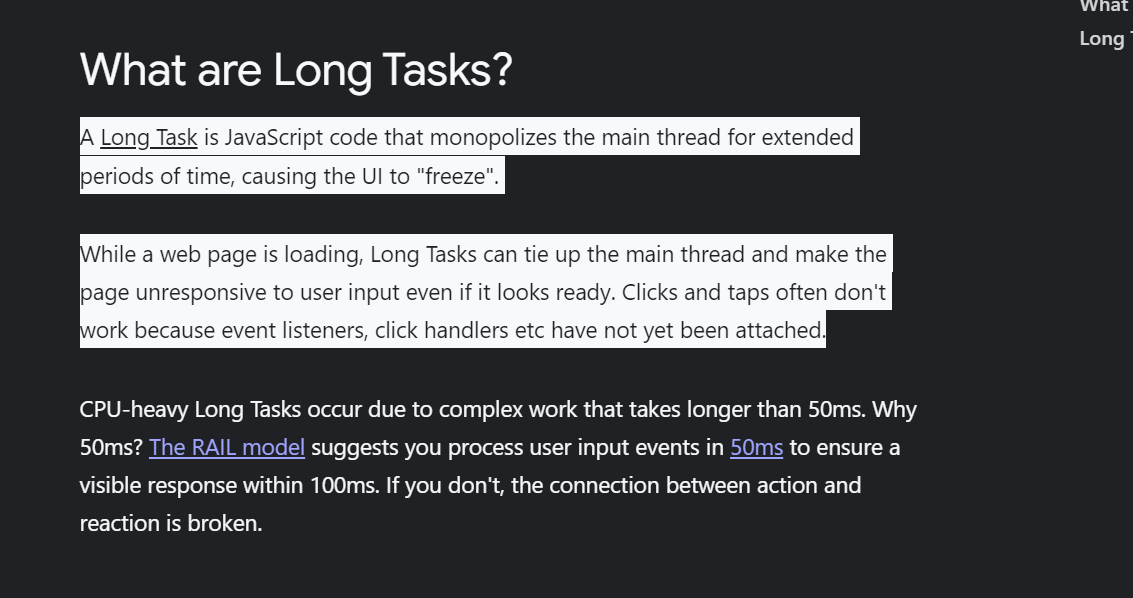
GermainUX detects supported JavaScript long tasks that can make a browser page feel slow, frozen, or unresponsive.
Freeze/Long-task insights can be correlated with:
|
Correlation |
Details |
|---|---|
|
The interaction |
The affected user interaction |
|
Page/route |
Page or route |
|
App version |
Application version |
|
Browser/device |
Browser and device |
|
JS errors |
JavaScript errors |
|
Network |
Network activity |
|
Session Replay |
Session Replay |
|
Business delays |
Business-process delays |
A long task is evidence that the browser’s main thread was occupied; it does not by itself identify the responsible function. Deploy the JS Profiler when function-level JavaScript analysis is required.
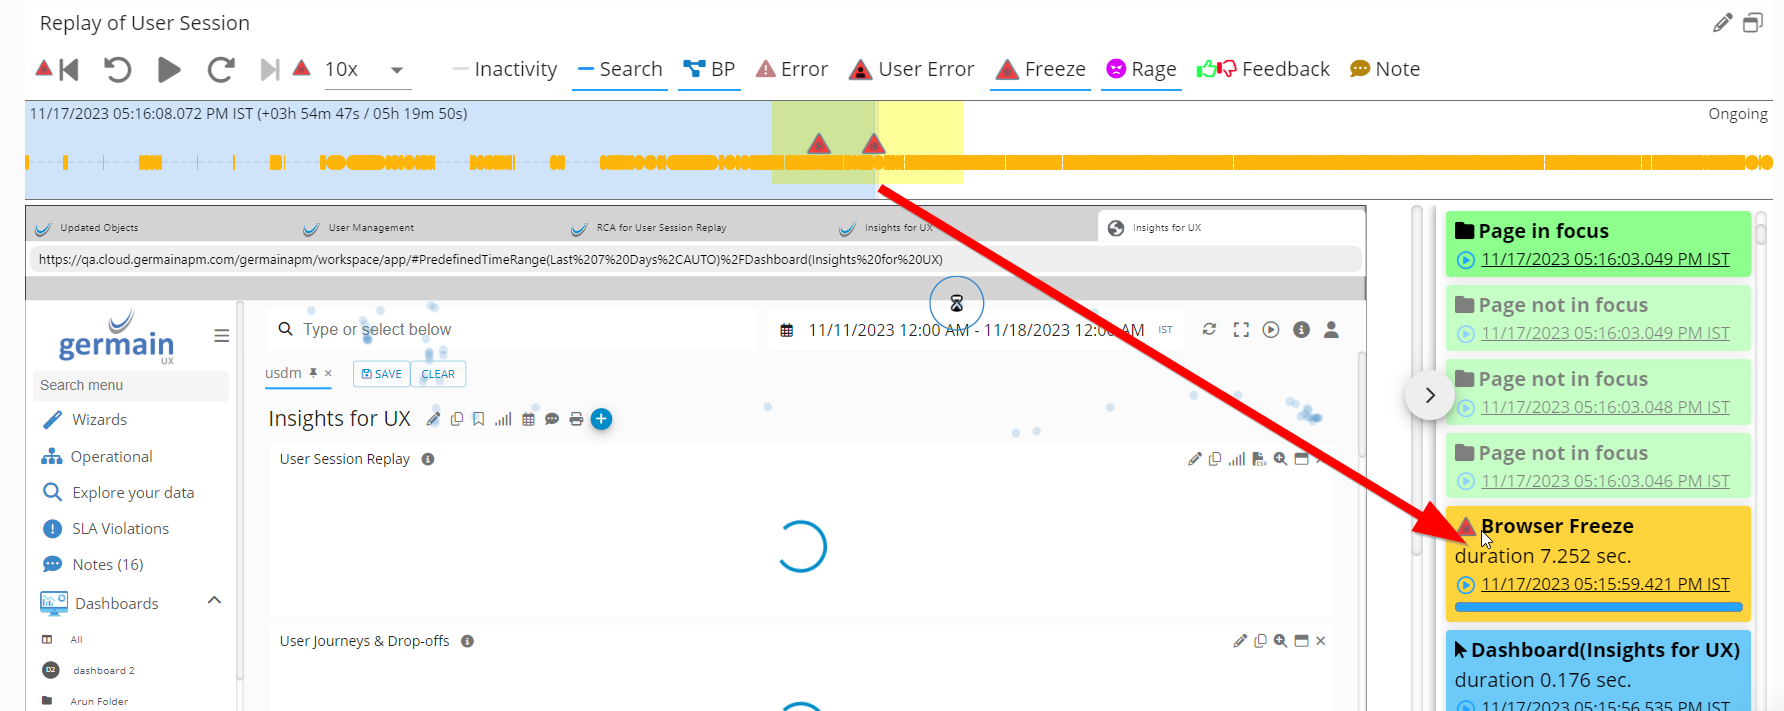
See JavaScript Long Task or Browser Freeze Detection.
💾 Browser memory
GermainUX can collect supported JavaScript and page-memory measurements.
Memory monitoring can help detect:
|
Issue |
Details |
|---|---|
|
Rising memory |
Increasing memory consumption |
|
High usage pages |
Pages or workflows associated with high memory usage |
|
Version differences |
Differences between application versions |
|
Progressive slowness |
Sessions that become progressively slower |
|
Possible leaks |
Possible memory leaks requiring further investigation |
The available memory information varies by browser and browser API support. A rising memory measurement can indicate a problem but does not by itself prove that a memory leak exists.
See JavaScript and Page Memory Monitoring.
📡 Network-request monitoring
GermainUX monitors supported requests initiated from the browser, including fetch and XMLHttpRequest activity where accessible.
Collected information can include:
|
Field |
Details |
|---|---|
|
URL & method |
URL and HTTP method |
|
Duration |
Request duration |
|
HTTP status |
HTTP status |
|
Size |
Request and response size |
|
Failures |
Failed or canceled requests |
|
Timing
|
Request timing |
|
Related interaction |
Related user interaction |
|
Custom attributes |
Customer-defined request and response attributes |
|
Correlation IDs |
Correlation identifiers |
Use network monitoring to identify:
|
Problem |
|---|
|
Slow APIs |
|
Failed requests |
|
Authentication problems |
|
Repeated requests |
|
Unavailable dependencies |
|
Requests associated with user-visible errors |
|
Network activity causing workflow delays |
Sensitive URLs, headers, query parameters, request bodies, response bodies, cookies, and tokens must be excluded or masked.
See Network Requests Monitoring.
⚙️ Server-Timing monitoring
When an application returns the standard Server-Timing response header, GermainUX can collect the metrics made available by the server.
These values can help divide an observed browser request into application-defined server stages, such as:
|
Examples |
|---|
|
Application processing |
|
Database activity |
|
Cache access |
|
External-service calls |
|
Rendering or preparation |
The browser can expose only the Server-Timing information returned by the application and permitted by cross-origin policies.
🔌 WebSocket monitoring
GermainUX can monitor supported WebSocket activity within instrumented browser applications.
Depending on configuration and browser access, insights can include:
|
Insights |
|---|
|
Connection opening and closing |
|
Connection duration |
|
Errors |
|
Message activity |
|
Customer-defined WebSocket events |
|
Activity associated with a user session or workflow |
WebSocket payload collection should be limited to data that is necessary and authorized.
See WebSocket Monitoring.
💬 Popup-dialog monitoring
GermainUX can detect native browser dialogs such as:
|
Type |
|---|
|
|
|
|
|
|
It can record when a dialog appears or closes and, when configured, measure how long it remained active.
Dialog content may contain sensitive business or personal data and should be masked or excluded when required.
🛡️ Browser reports and policy violations
Where supported by the browser, GermainUX can collect browser-reported events such as:
|
Details |
|---|
|
Content Security Policy violations |
|
Permissions Policy violations |
|
Deprecated feature usage |
|
Browser interventions |
These insights help developers identify compatibility, security-policy, and future browser-support risks.
Browser support varies. The current capability is primarily available in Chromium-based browsers.
See Browser Deprecated Features and Policy Violations Monitoring.
💥 Browser crash detection
GermainUX can detect supported signals indicating that a monitored browser tab or page terminated unexpectedly.
Crash analysis can help identify:
|
Details |
|---|
|
Affected pages and workflows |
|
Browser and browser version |
|
Device and operating system |
|
Application version |
|
Activity preceding the termination |
|
Memory, errors, or long tasks observed before the event |
Browser security and lifecycle behavior prevent any browser-side monitor from detecting every possible process, operating-system, power, or network termination.
🔋 Battery monitoring
On supported browsers and devices, GermainUX can create an event when:
|
Event |
Details |
|---|---|
|
Low battery |
The battery level falls below a configured threshold. |
|
Charging change |
The charging status changes. |
Battery information can provide useful context for mobile or field users, but availability is limited by browser support and device permissions.
🏷️ Application metadata
Metadata extractors associate browser activity with authorized application and business context.
Extracted metadata can include:
|
Metadata |
|---|
|
Username |
|
Session ID |
|
Role/team |
|
Tenant |
|
App version |
|
Identifiers |
|
Product |
|
Business process |
|
Custom attributes |
Metadata can be extracted from authorized page content, application state, cookies, or asynchronous application logic.
See Metadata Extractors.
📞 Chat and CTI monitoring
For supported chat and CTI components embedded in a monitored web application, GermainUX can capture events such as:
|
Event |
Details |
|---|---|
|
Chat visibility |
Chat expanded, minimized, or hidden |
|
Conversation state |
Conversation started or ended |
|
Message send |
Message sent |
|
Link click |
Link clicked |
|
Operator status |
Operator available or unavailable |
|
Conversation duration |
Conversation duration |
|
Response time |
Operator response time |
Message-content collection and analysis require appropriate technical access and organizational authorization.
See Chat/CTI Monitoring.
🎥 Video interaction monitoring
GermainUX can monitor supported user interactions with embedded video players without streaming or storing the video itself.
Depending on the player integration, events can include:
|
Details |
|---|
|
Play |
|
Pause |
|
Seek |
|
Completion |
|
Viewing duration |
|
Playback progress |
|
Player errors |
See Video Monitoring.
📈 Business-process, adoption, and conversion monitoring
Browser events can represent milestones in customer journeys and employee workflows.
GermainUX can analyze:
|
Process Analysis/Insights details |
|---|
|
Process starts and completions |
|
Step and end-to-end duration |
|
Repeated steps |
|
Abandonment and drop-off |
|
Feature adoption |
|
Conversion |
|
Lost productivity |
|
Errors and performance conditions affecting the outcome |
|
Differences by user or customer segment |
Examples include registration, checkout, case management, quote creation, application processing, and employee approvals.
👍 User feedback
The GermainUX Feedback Popup can collect ratings, comments, and customer-defined feedback within a monitored application.
Feedback can be connected to the corresponding:
|
Linked to |
|---|
|
User session |
|
Session Replay |
|
Page or route |
|
Business-process milestone |
|
Error or performance condition |
|
Application version |
|
User or customer segment |
This helps teams understand what happened before the feedback was submitted and measure whether other users encountered the same condition.
🔧 Browser APIs and custom events
The GermainUX browser APIs can be used to:
|
Capability |
|---|
|
Create custom events and transactions |
|
Add application and business metadata |
|
Define workflow milestones |
|
Record customer-specific measures |
|
Control supported monitoring behavior |
|
Associate browser activity with application identifiers |
|
Extend monitoring for custom UI components |
See APIs for Browser Monitoring.
📊 Analytics and correlation
Browser insights can be analyzed using:
|
Tools |
|---|
|
KPIs, measures, and pivots |
|
Historical trends |
|
Segmentation |
|
SLAs |
|
Outlier and anomaly detection |
|
Session Replay |
|
Heatmaps |
|
Business-impact analysis |
|
Custom dashboards and reports |
|
AI-assisted analysis when configured |
With compatible identifiers, browser activity can be correlated with:
|
Correlate with |
|---|
|
Backend transactions |
|
Application code |
|
APIs |
|
Logs |
|
Databases |
|
Integrations |
|
Servers and infrastructure |
|
Business processes |
See KPIs for Browser Monitoring, Analytics, and Correlation or Tracing.
🔔 Alerts and automated actions
When GermainUX detects a relevant browser insight, it can:
|
Action |
Details |
|---|---|
|
Send alert |
Send an alert. |
|
Notify via Watch |
Notify interested users through a Watch. |
|
Generate report |
Generate a report. |
|
Call endpoint |
Call an authorized HTTP endpoint. |
|
Execute script |
Execute an approved diagnostic script. |
|
Initiate ticket |
Initiate a ticket or operational workflow. |
|
Start remediation |
Start an approved remediation action. |
Examples include notifying a team when a new JavaScript error affects users, an API failure exceeds its SLA, conversion declines, or a synthetic browser workflow fails.
See Automation.
🔒 Security and privacy
Before enabling browser monitoring:
|
Step |
Details |
|---|---|
|
Define scope |
Define which applications, pages, and users may be monitored. |
|
Configure consent |
Configure consent where required. |
|
Mask sensitive fields |
Mask or exclude sensitive fields and content. |
|
Exclude secrets |
Exclude passwords, payment information, authentication tokens, and secrets. |
|
Review collection |
Review URL, network, console, WebSocket, popup, chat, and metadata collection. |
|
Restrict Replay |
Restrict Session Replay and sensitive analytics to authorized roles. |
|
Configure retention |
Configure retention and deletion policies. |
|
Validate privacy rules |
Validate privacy rules across dynamic application states. |
|
Review configuration |
Review the configuration whenever the application changes. |
Collect only the information required for the approved monitoring purpose.
 Limitations
Browser-monitoring coverage depends on:
|
Dependency |
Details |
|---|---|
|
Browser/version |
Browser and browser version |
|
Architecture |
Application architecture |
|
Origin boundaries |
Same-origin and cross-origin boundaries |
|
Content Security Policy |
Content Security Policy |
|
API support |
Browser API support |
|
Permissions |
RUM JS or extension permissions |
|
Ownership |
Application ownership |
|
Privacy config |
Privacy configuration |
|
Sampling/consent |
Sampling and consent |
|
GermainUX version |
Deployed GermainUX version |
RUM JS observes only the browser contexts it can access. Cross-origin frames and third-party applications may require the GermainUX RUM Extension or additional authorized instrumentation.
Browser monitoring does not automatically expose internal backend execution. Deploy the GermainUX Engine and supported Code Profiler components when server-side evidence is required.
⚙️ Deployment and configuration
|
For your browser-based application |
|---|
|
Review Deploy Monitoring of Browser. |
|
Deploy GermainUX RUM JS when the monitoring script can be added to the application. |
|
Deploy the GermainUX RUM Extension when script injection or root-page access is unavailable. |
|
Configure browser monitoring through Configure Monitoring of Browser. |
|
Configure the application, URLs, single-page application routes, metadata, and UX Monitoring Profile. |
|
Configure Session Replay, heatmaps, consent, masking, exclusions, sampling, and retention. |
|
Enable the required click, error, network, performance, memory, long-task, WebSocket, popup, browser-report, chat, video, and battery monitoring. |
|
Configure custom business events and business-process milestones. |
|
Deploy the GermainUX JS Profiler when function-level JavaScript analysis is required. |
|
Deploy the GermainUX Engine and Code Profiler for backend monitoring and frontend-to-backend correlation. |
|
Configure KPIs, SLAs, dashboards, alerts, Watches, reports, and approved actions. |
|
Validate data collection, browser compatibility, privacy controls, and business-event accuracy before production rollout. |
ℹ️ Get Help
The Germain Team can help you set this up. Contact GermainUX Support.
Component: JS Profiler, RUM JS, RUM Extension
Feature Availability: 2022.1 or later