Steps on how to configure monitoring for JavaScript.
Standard JavaScript Monitoring Enabling
Details on how to enable Javascript monitoring.
Deep JavaScript Monitoring Enabling
Chrome Extension (No banner)
This option avoids the Debugging banner from appearing on the end-user’s browser while JavaScript Execution Time/profiling is being collected in the background. Have the End-Users launch Chrome with an additional flag
-
Go to Germain Workspace > Left Menu > Analytics > UX Monitoring Profiles
-
Select UX Monitoring Profile to update
-
Select JavaScript Profiling Monitoring in the Configuration Editor
-
Locate the shortcut file used to launch Chrome: search for the shortcut in the Start Menu, right-click the shortcut, choose "Open file location"
-
Edit the properties of the Chrome shortcut file: right click, properties
-
Add
--silent-debugger-extension-apito the end of the target value, leaving a space between -
Ensure that this modified shortcut is what is used when running Chrome to open the web page being monitored
Chrome Extension (Banner on end-user browser)
-
Go to Germain Workspace > Left Menu > Analytics > UX Monitoring Profiles
-
Select UX Monitoring Profile to update
-
Select JavaScript Profiling Monitoring in the Configuration Editor
As a security feature, Chrome will display a banner along the top of the browser window when a monitored page is open. It looks like the following:
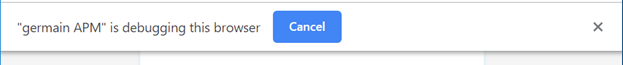
If the user clicks either the Cancel or X buttons, the JS profiler details will cease to be collected until the page is opened in a new tab and the banner re-appears.
Custom Response Header
-
Go to Germain Workspace > Left Menu > Analytics > UX Monitoring Profiles
-
Select UX Monitoring Profile to update
-
Select JavaScript Profiling Monitoring in the Configuration Editor
-
Add
Document-Policy: js-profilingresponse header to each page for which you want to collect JavaScript Time Execution / Profiling details
Deep JavaScript Monitoring Disabling
-
Go to Germain Workspace > Left Menu > Analytics > UX Monitoring Profiles
-
Select UX Monitoring Profile to update
-
Unselect JavaScript Profiling Monitoring in the Configuration Editor
Advanced Configuration
All the settings available on the settings.plugins.jsProfiling object are listed below. Please contact us If you need any help with this advanced configuration.
/** Minimum function/stack hits to end up in the result output. Default: 0. */
functionMinStackHits: number;
/** Maximum sample capacity for JavaScript Self-Profiling API only (in samples). Default: 1000. */
maxSampleBufferSize: number;
/** Maximum profiling duration (in seconds). Default: 30. */
maxProfileDuration: number;
/** Start profiler on first page ready event if true. Otherwise it will start from the next page load. Default: true. */
profileOnPageReady: boolean;
/** Target sample interval (in millis per sample). Default: 20. */
sampleIntervalMillis: Millis;
/** Check for JavaScript Self-Profiling API and before checking for JS Profiler extension. This avoids "Document policy violation: js-profiling is not allowed in this document." error message if API not allowed but we check for it. Default: false. */
useSelfProfilingAPI: boolean;
/** Run profiler for all except these usernames. Undefined or empty array means run for everyone. Default: undefined. */
excludedUsernames?: string[];
/** Run profiler only for these usernames. Undefined or empty array means run for everyone. Default: undefined. */
includedUsernames?: string[];
For more detailed information, please reach out to us. We will provide you with further guidance and assistance tailored to your needs.
Component: RUM JS, JS Profiler
Feature Availability: 2022.2 or later