Microsoft SQL Server Monitoring
Features for SQL Server
Germain is configured to monitor the uptime and performance of SQL Server database servers.
Backup and recovery
Monitor the backup and recovery processes of the SQL Server database. Ensure that regular backups are performed successfully and monitor the backup completion status. Track recovery times in case of any database failures or data corruption.
Error logs
Monitor SQL Server error logs to identify and resolve any issues or errors that occur within the database. Log and track error messages, warnings, and informational events for troubleshooting and proactive maintenance.
Database connections
Monitor the number of active database connections and track connection usage. Identify any connection leaks or excessive connections that could impact the performance and scalability of the database.
Disk space and filegroup utilization
Monitor the disk space usage of the SQL Server database and its filegroups. Ensure that there is sufficient disk space available for data storage and log files. Identify any filegroups that are running out of space and take necessary actions to prevent data issues.
Performance metrics
Monitor key performance metrics of the SQL Server, including CPU usage, memory utilization, disk I/O, and network traffic. These metrics help identify any bottlenecks or resource constraints that could impact the performance of the database.
Query performance
Monitor the performance of SQL queries executed against the SQL Server database. Track metrics such as query response time, execution plans, and index usage. Identify slow-running queries and optimize their performance to improve overall database efficiency.
Server availability
Monitor the availability of the SQL Server instance to ensure it is up and running. Track uptime and receive alerts if the server goes down or experiences any connectivity issues.
Server and database configuration
Monitor server and database configuration settings to ensure they are optimized for performance and security. Keep track of any changes made to the configuration and validate their impact on the database.
Configuration
For basic monitoring of a single instance, Germain utilizes a regular database user account with CONNECT permissions. However, for more comprehensive monitoring, the database user account must be granted additional permissions to execute queries against a series of system views and tables.
It's important to note that Germain has the capability to monitor any other SQL Server tables, regardless of whether they are system tables or data tables. The requirements mentioned above represent the bare minimum requirements, but they can be extended to include monitoring of any other tables.
Table / View | Permission |
|---|---|
sys.dm_os_performance_counters | SELECT |
sys.dm_exec_sessions | SELECT |
Script to grant these permissions:
USE master;
GRANT SELECT ON sys.dm_os_performance_counters TO germain-user;
GRANT SELECT ON sys.dm_exec_sessions TO germain-user;
GRANT VIEW SERVER STATE TO germain-user;
Go to Germain Workspace > Left Menu > Wizards > Rules
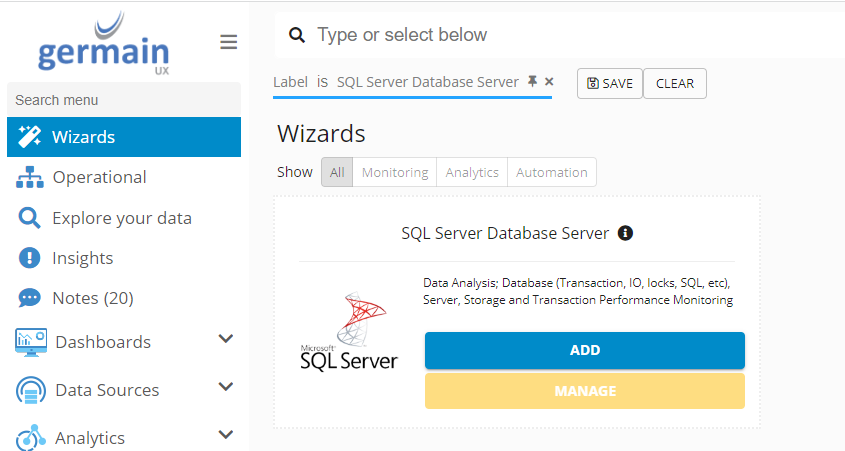
SQL Server Wizard - Germain UX
Add Database as Data Source
Germain workspace > Left Menu > Data Sources > Database > Add New Configuration

Add SQL Server Database as Data Source - Germain UX
Add DB Credentials
Germain Workspace > Left Menu > Data Sources > Credentials
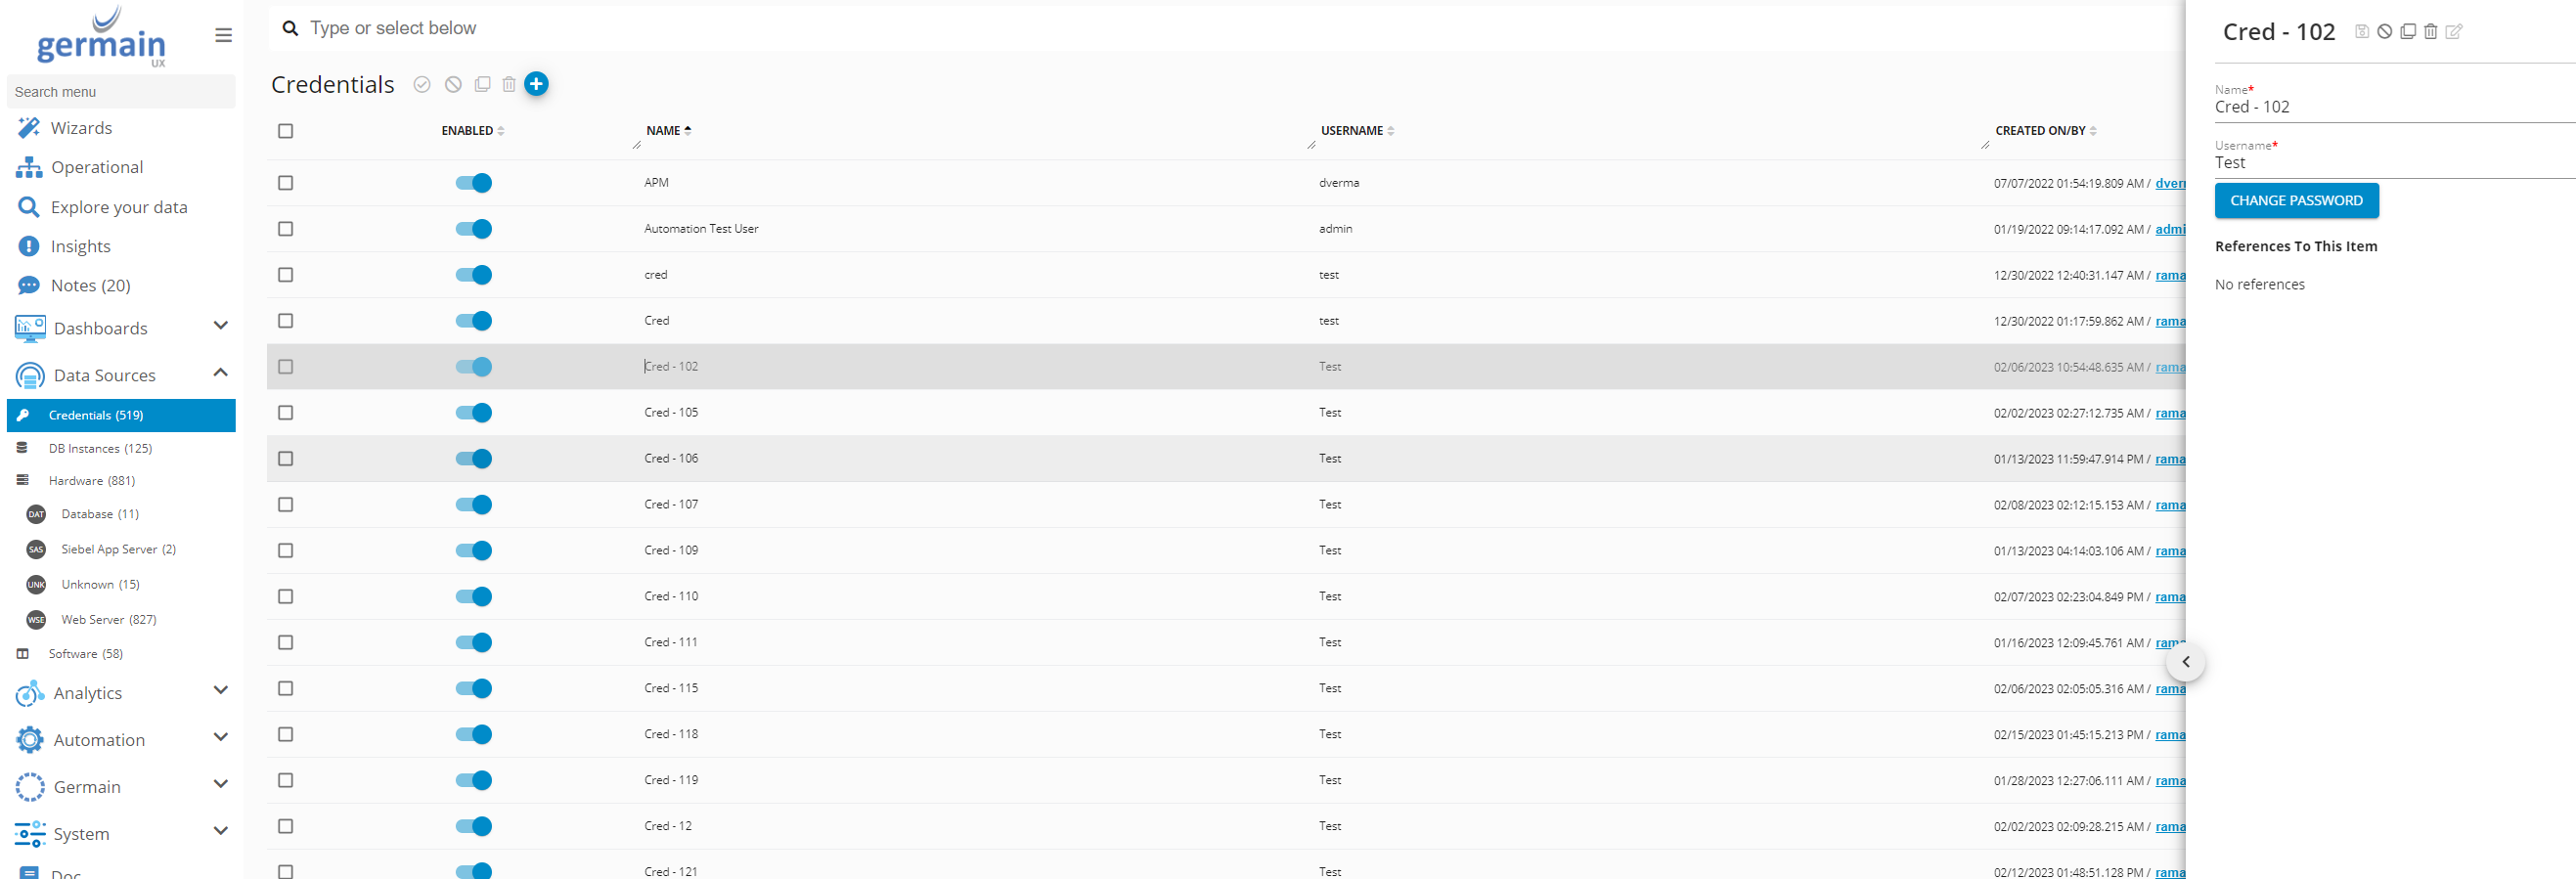
Add SQL Server Database Credentials for SQL Server- Germain UX
Add Database Query Monitor
Germain Workspace > Left Menu > Wizards > Database Query Monitor Deployment
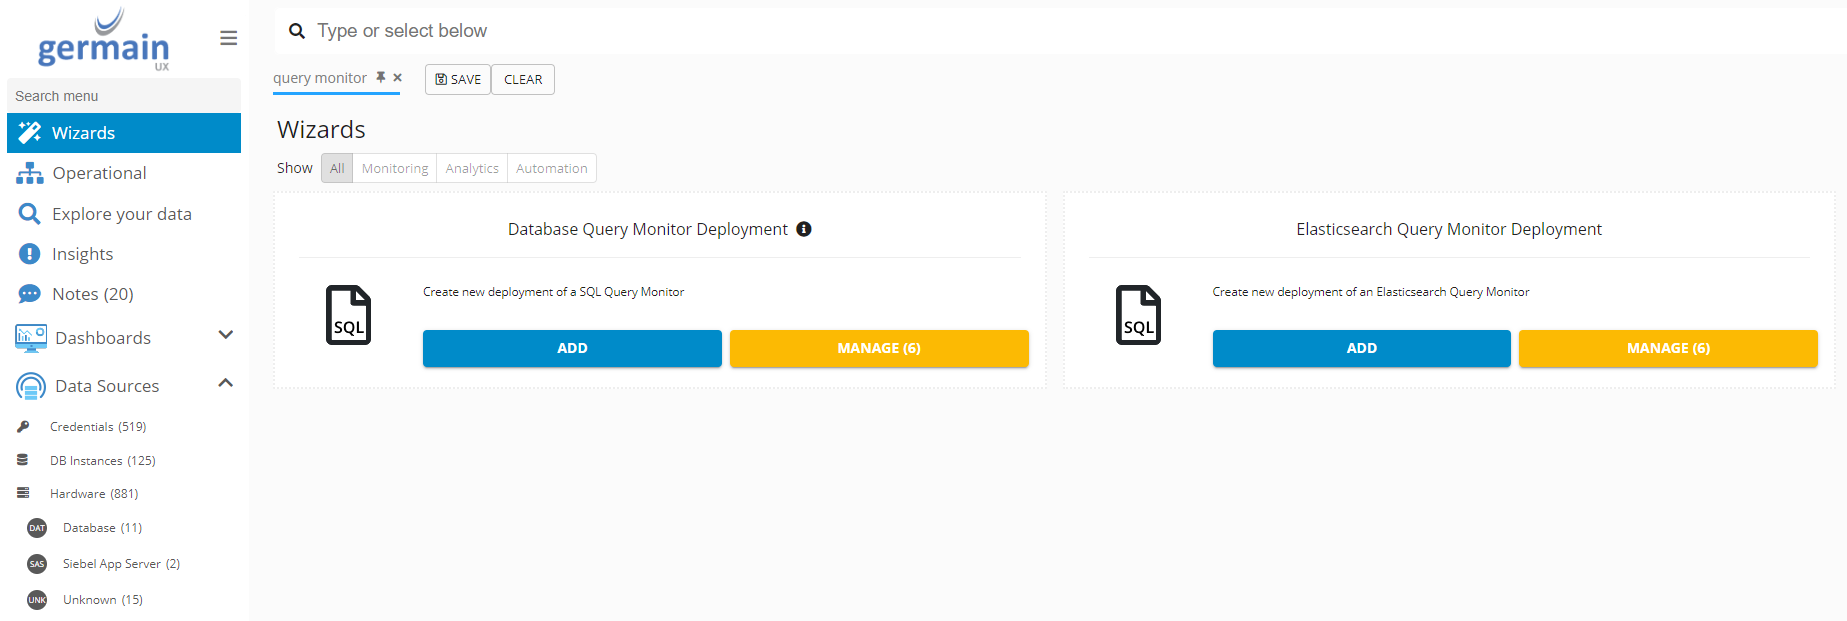
Add SQL Server Database Query Monitor for SQL Server - Germain UX
Enter Database details
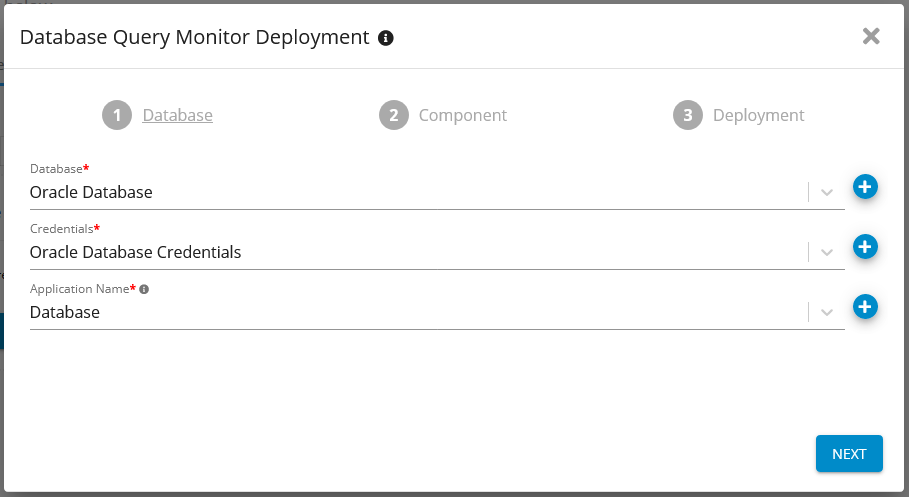
Enter SQL Server Database Details - Germain UX
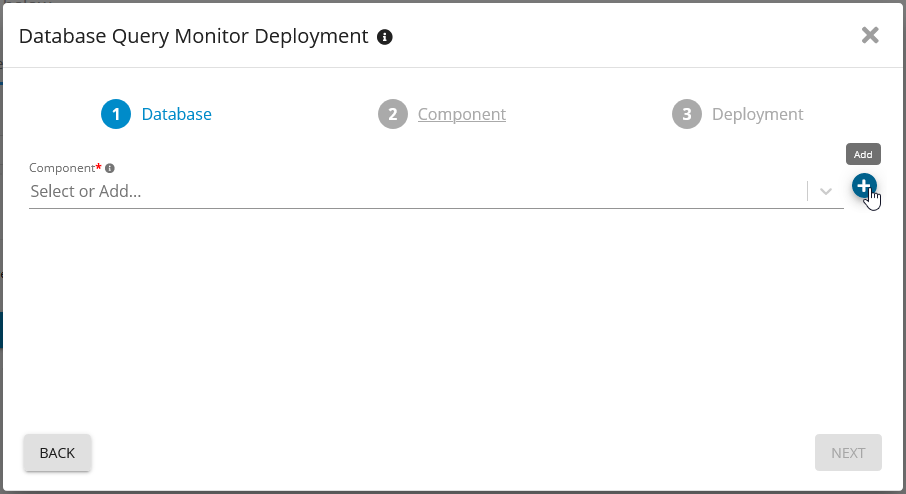
Add SQL Server database Query Monitor - Germain UX
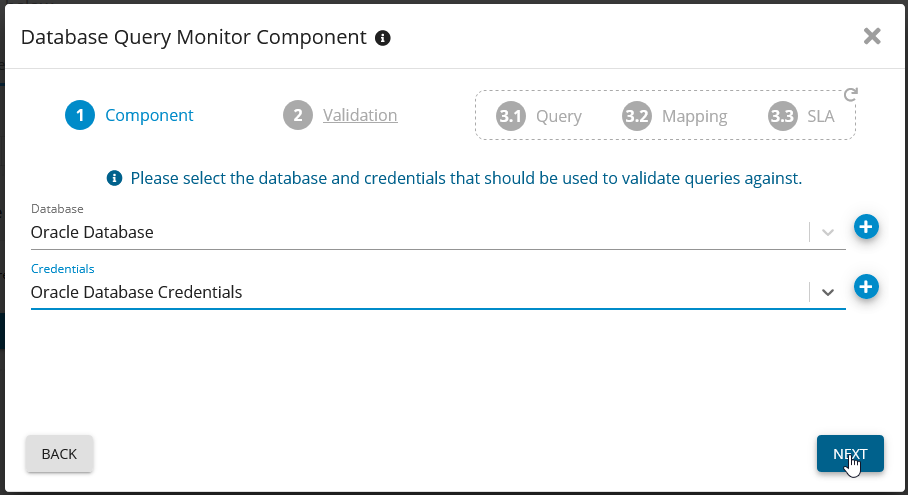
SQL Server Database Query Monitor - Germain UX
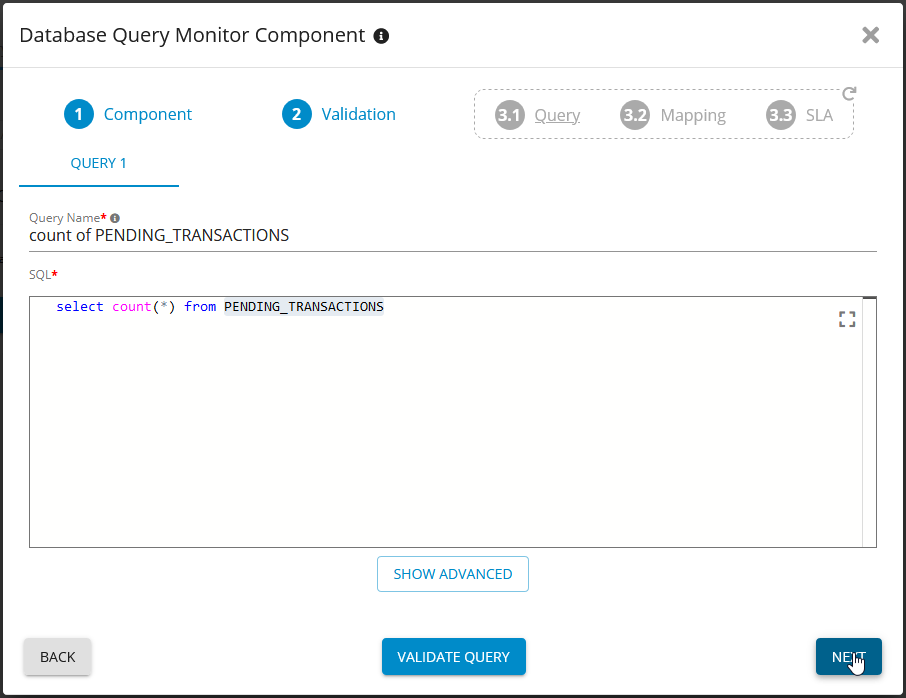
Add SQL Server Database Query Monitor Component - Germain UX
Add KPI
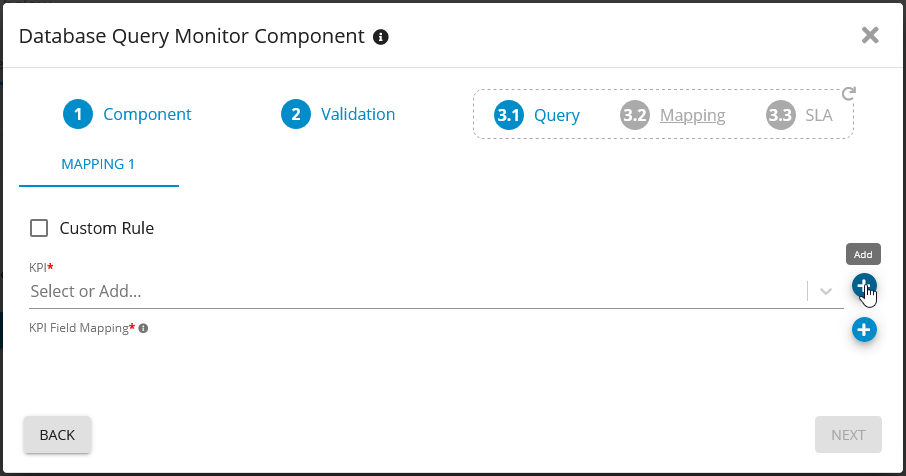
Add KPI for your SQL Server database- Germain UX
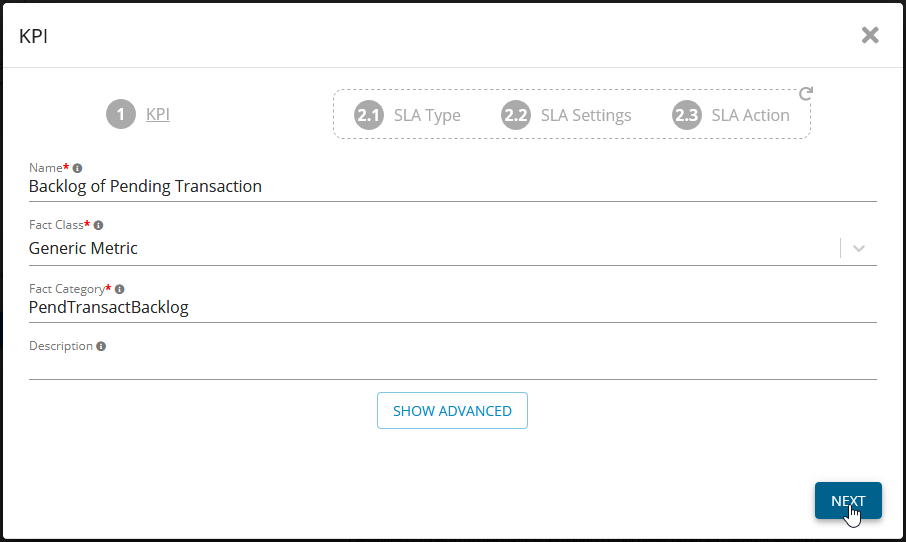
Add KPI for SQL Server - Germain UX
Create the base SLA for the new KPI. Choose Fact-based SLA
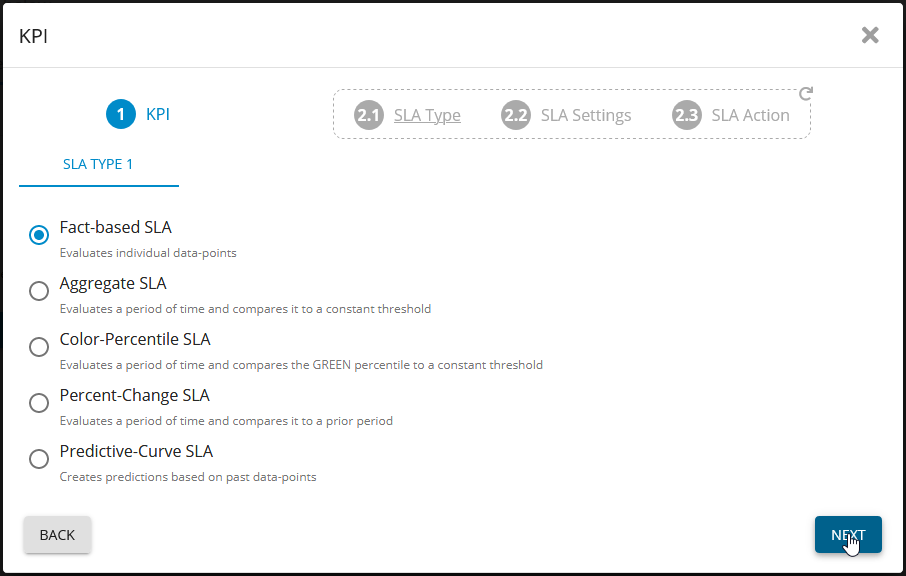
Add SLA for SQL Server - Germain UX
Add SLA
Alert Template: SLA.
Choose one or more of your actions (Alerts, Reports, Scripts, ect..)
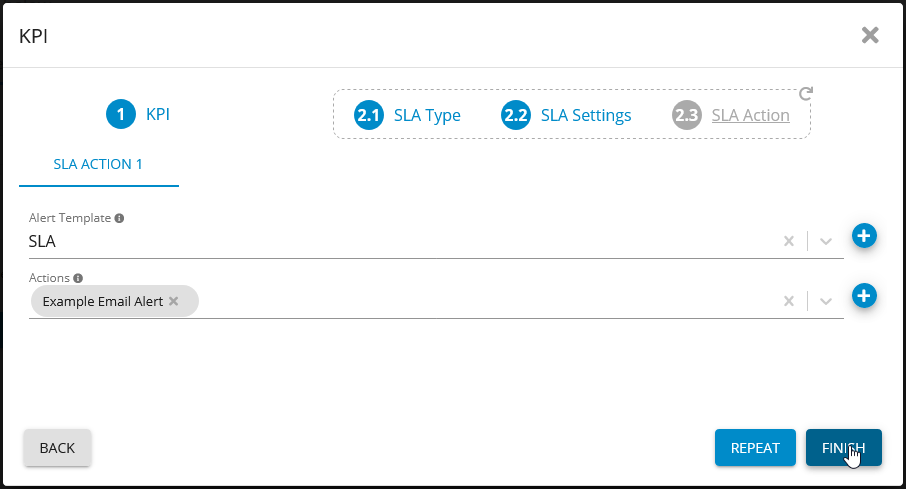
Add SLA Alert Template - Germain UX
Set KPI
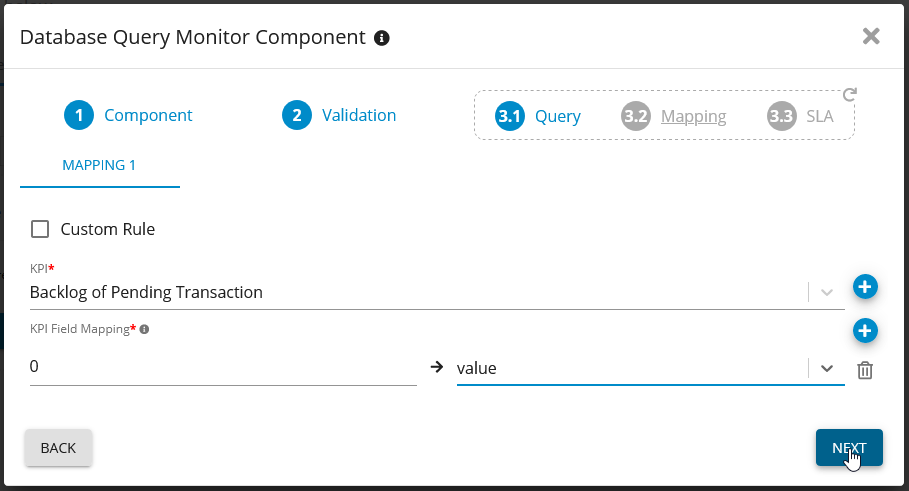
Configure KPI for SQL Server - Germain UX
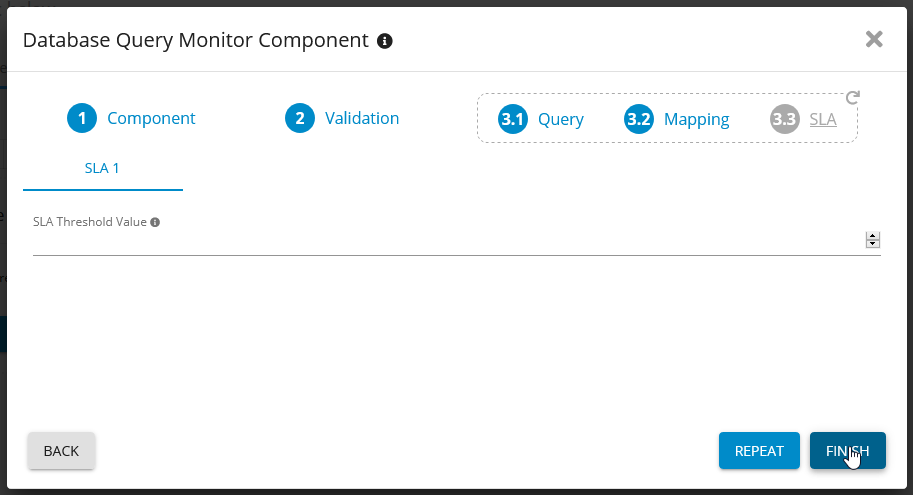
Add SLA Threshold for SQL Server - Germain UX
Deployment details
Monitoring Node: The Node that the Engine runs from
Engine: The engine you want to run the Monitor on
Fill in the schedule you would like the Monitor to run on
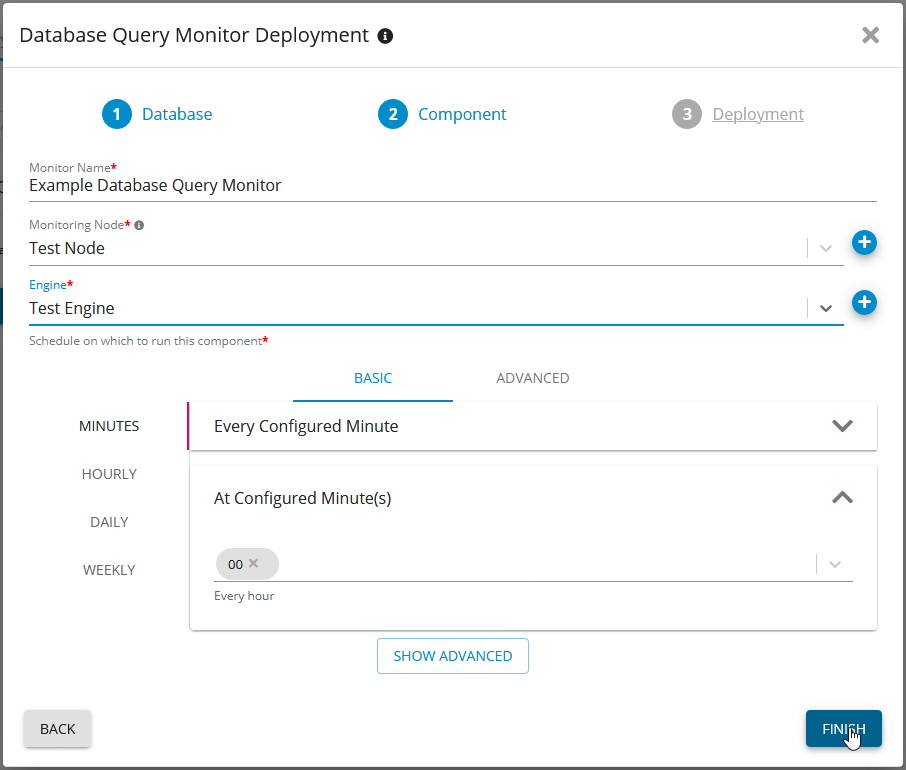
Deploy Database Query Monitor for SQL Server - Germain UX
Verify the Monitor by finding in “Germain State”
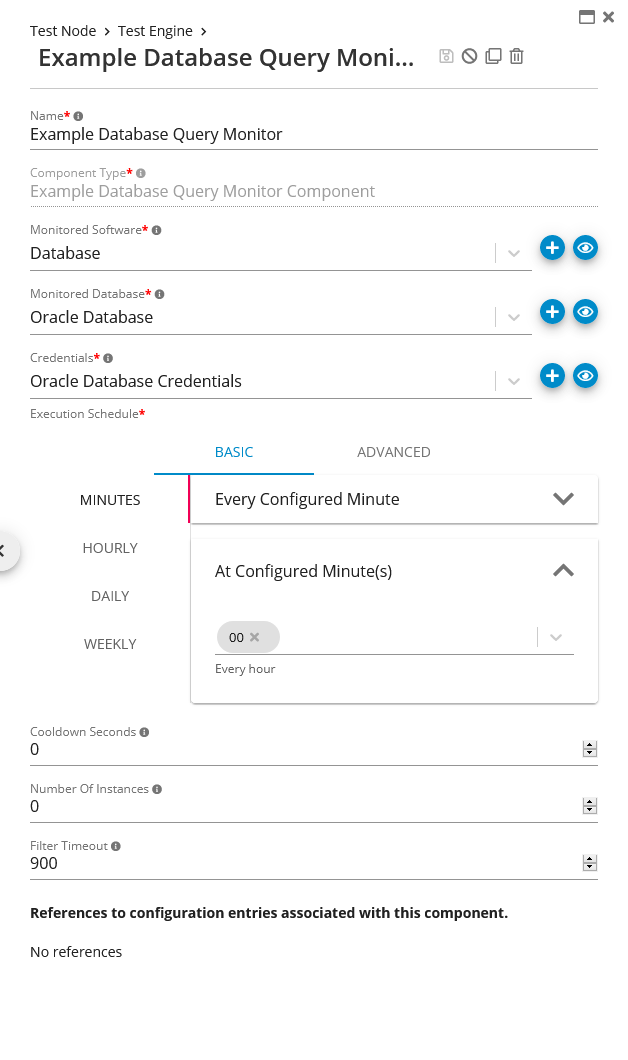
Check Running State of Database Query Monitor
For more detailed information, please reaching out to us. We will provide you with further guidance and assistance tailored to your needs.
Component: Engine
Feature Availability: 8.6.0 or later
