Features for MSFT Power BI
Germain monitors the uptime, performance, and user experience of Microsoft Power BI applications. With Germain, you can gain valuable insights into the availability, responsiveness, and overall performance of your Power BI application, ensuring a seamless user experience. Here are the key areas that Germain covers in monitoring Microsoft Power BI:
Application-level Monitoring
Dashboard and Report Usage
Germain tracks the usage of your Power BI dashboards and reports. It provides insights into which reports are accessed frequently, how users navigate through dashboards, and which visualizations are most popular. By monitoring usage patterns, Germain helps you understand user preferences and optimize your reports and dashboards accordingly.
Data Refresh Monitoring
Germain monitors the data refresh process in Power BI. It tracks the frequency and success of data refreshes, ensuring that your reports and dashboards are updated with the latest data. By monitoring data refresh, Germain helps you ensure the accuracy and timeliness of your business insights.
Error Tracking and Analysis
Germain captures and analyzes errors and exceptions occurring within your Power BI application. It provides detailed error logs and stack traces, helping you troubleshoot and resolve issues efficiently. By monitoring errors, Germain helps you maintain the stability and reliability of your application.
JavaScript Monitoring & Profiling
Germain captures and analyzes Javascript that is executed in Power BI’s browser. More details https://docs.germainux.com/main/javascript-profiling .
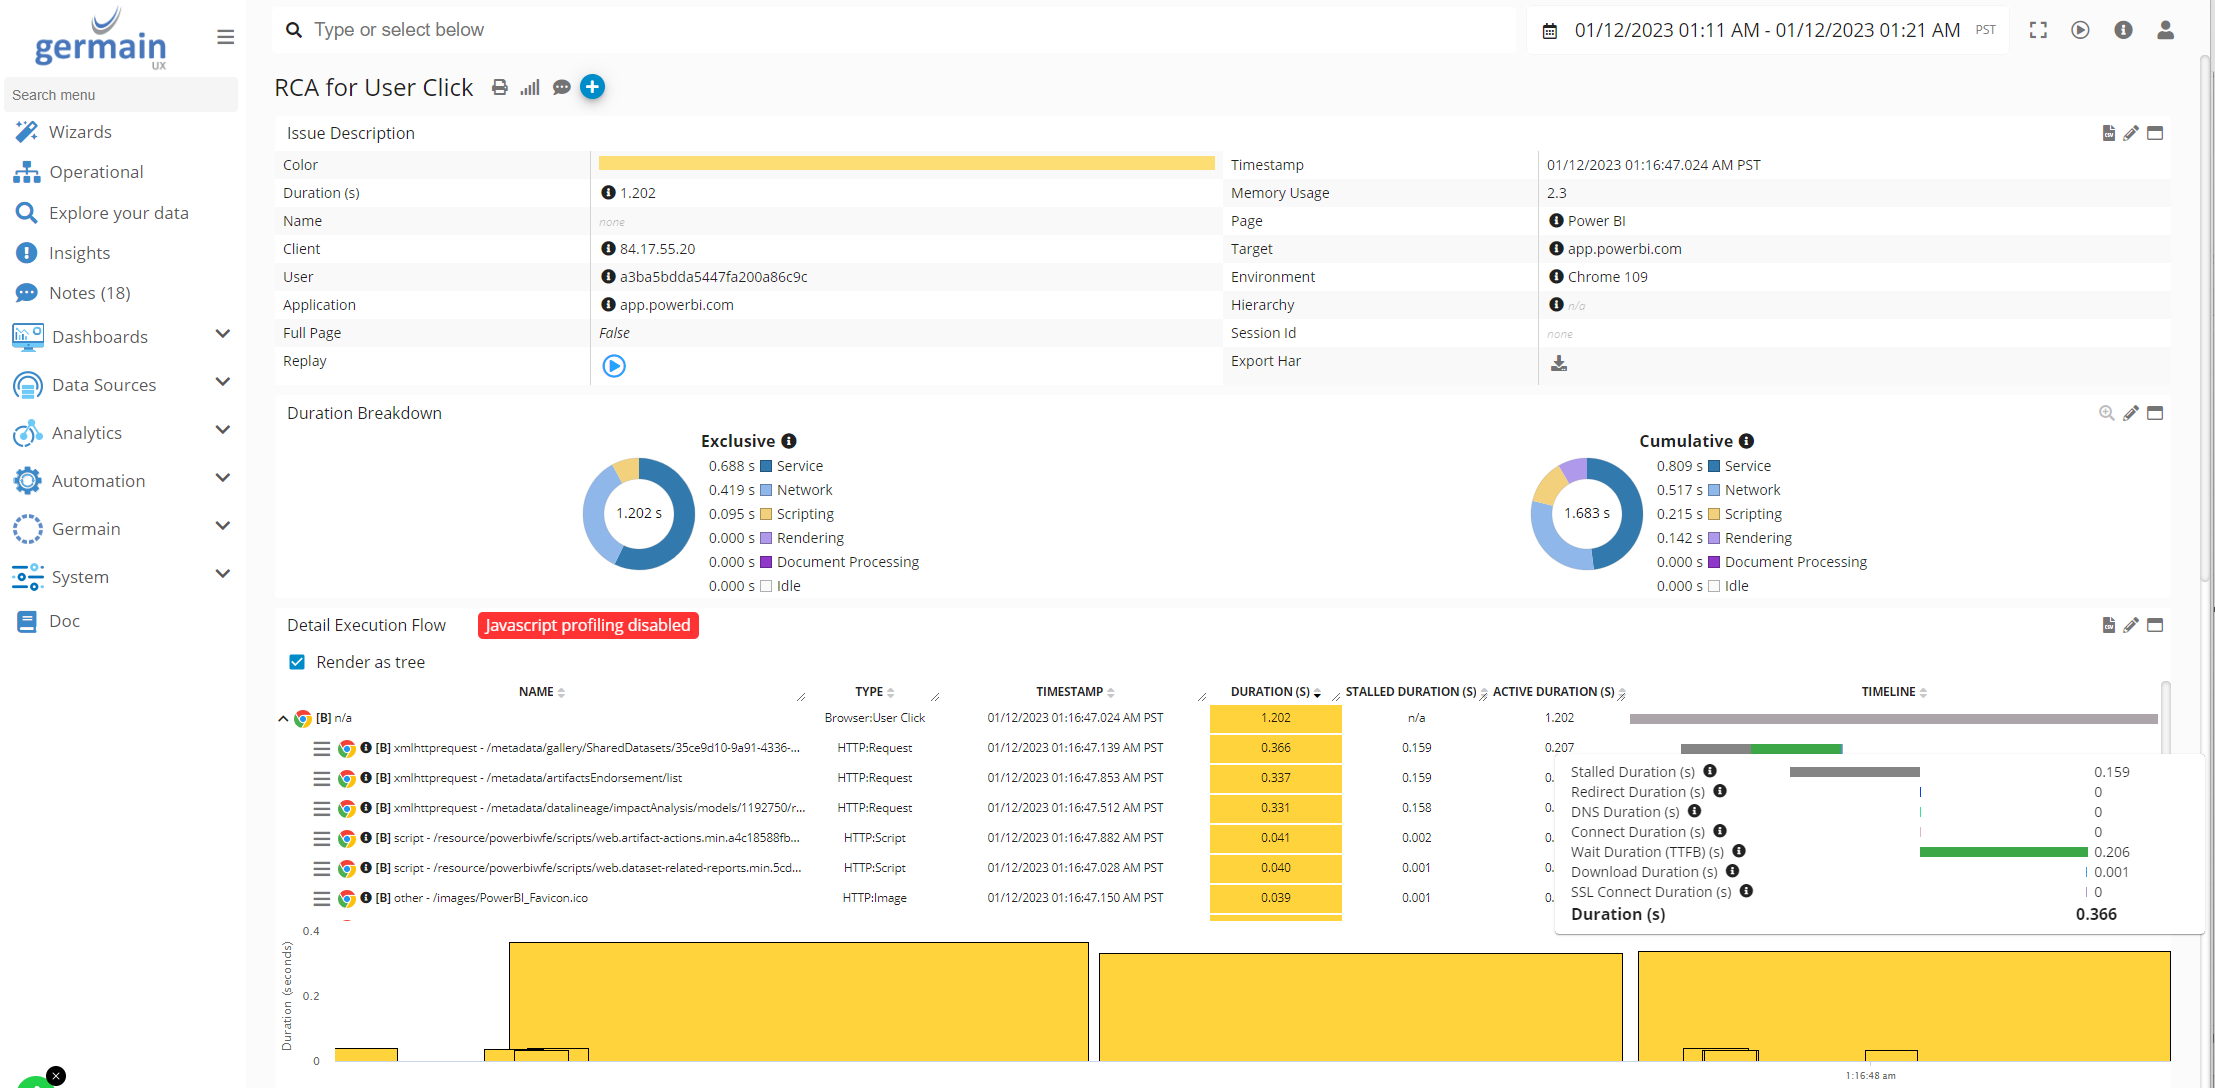
Performance Monitoring
Germain tracks the performance of your Power BI application to ensure optimal responsiveness. It measures key performance metrics such as report loading times, dashboard rendering times, and data query performance. By monitoring performance, Germain helps you identify any performance bottlenecks or areas for optimization.
Scalability and Capacity Planning
Germain provides insights into the scalability and capacity requirements of your Power BI application. It tracks resource utilization, system load, and performance under different user loads. By monitoring scalability and capacity, Germain helps you plan for future growth and ensure that your application can handle increasing demands.
Security Monitoring
Germain helps you monitor the security aspects of your Power BI application. It tracks user authentication, access controls, and security events. By monitoring security, Germain helps you identify any security vulnerabilities or breaches and take appropriate measures to protect your application and data.
Uptime Monitoring
Germain continuously monitors the availability and uptime of your Power BI application. It alerts you promptly in case of any downtime or service disruptions, allowing you to take immediate action to resolve issues and minimize downtime.
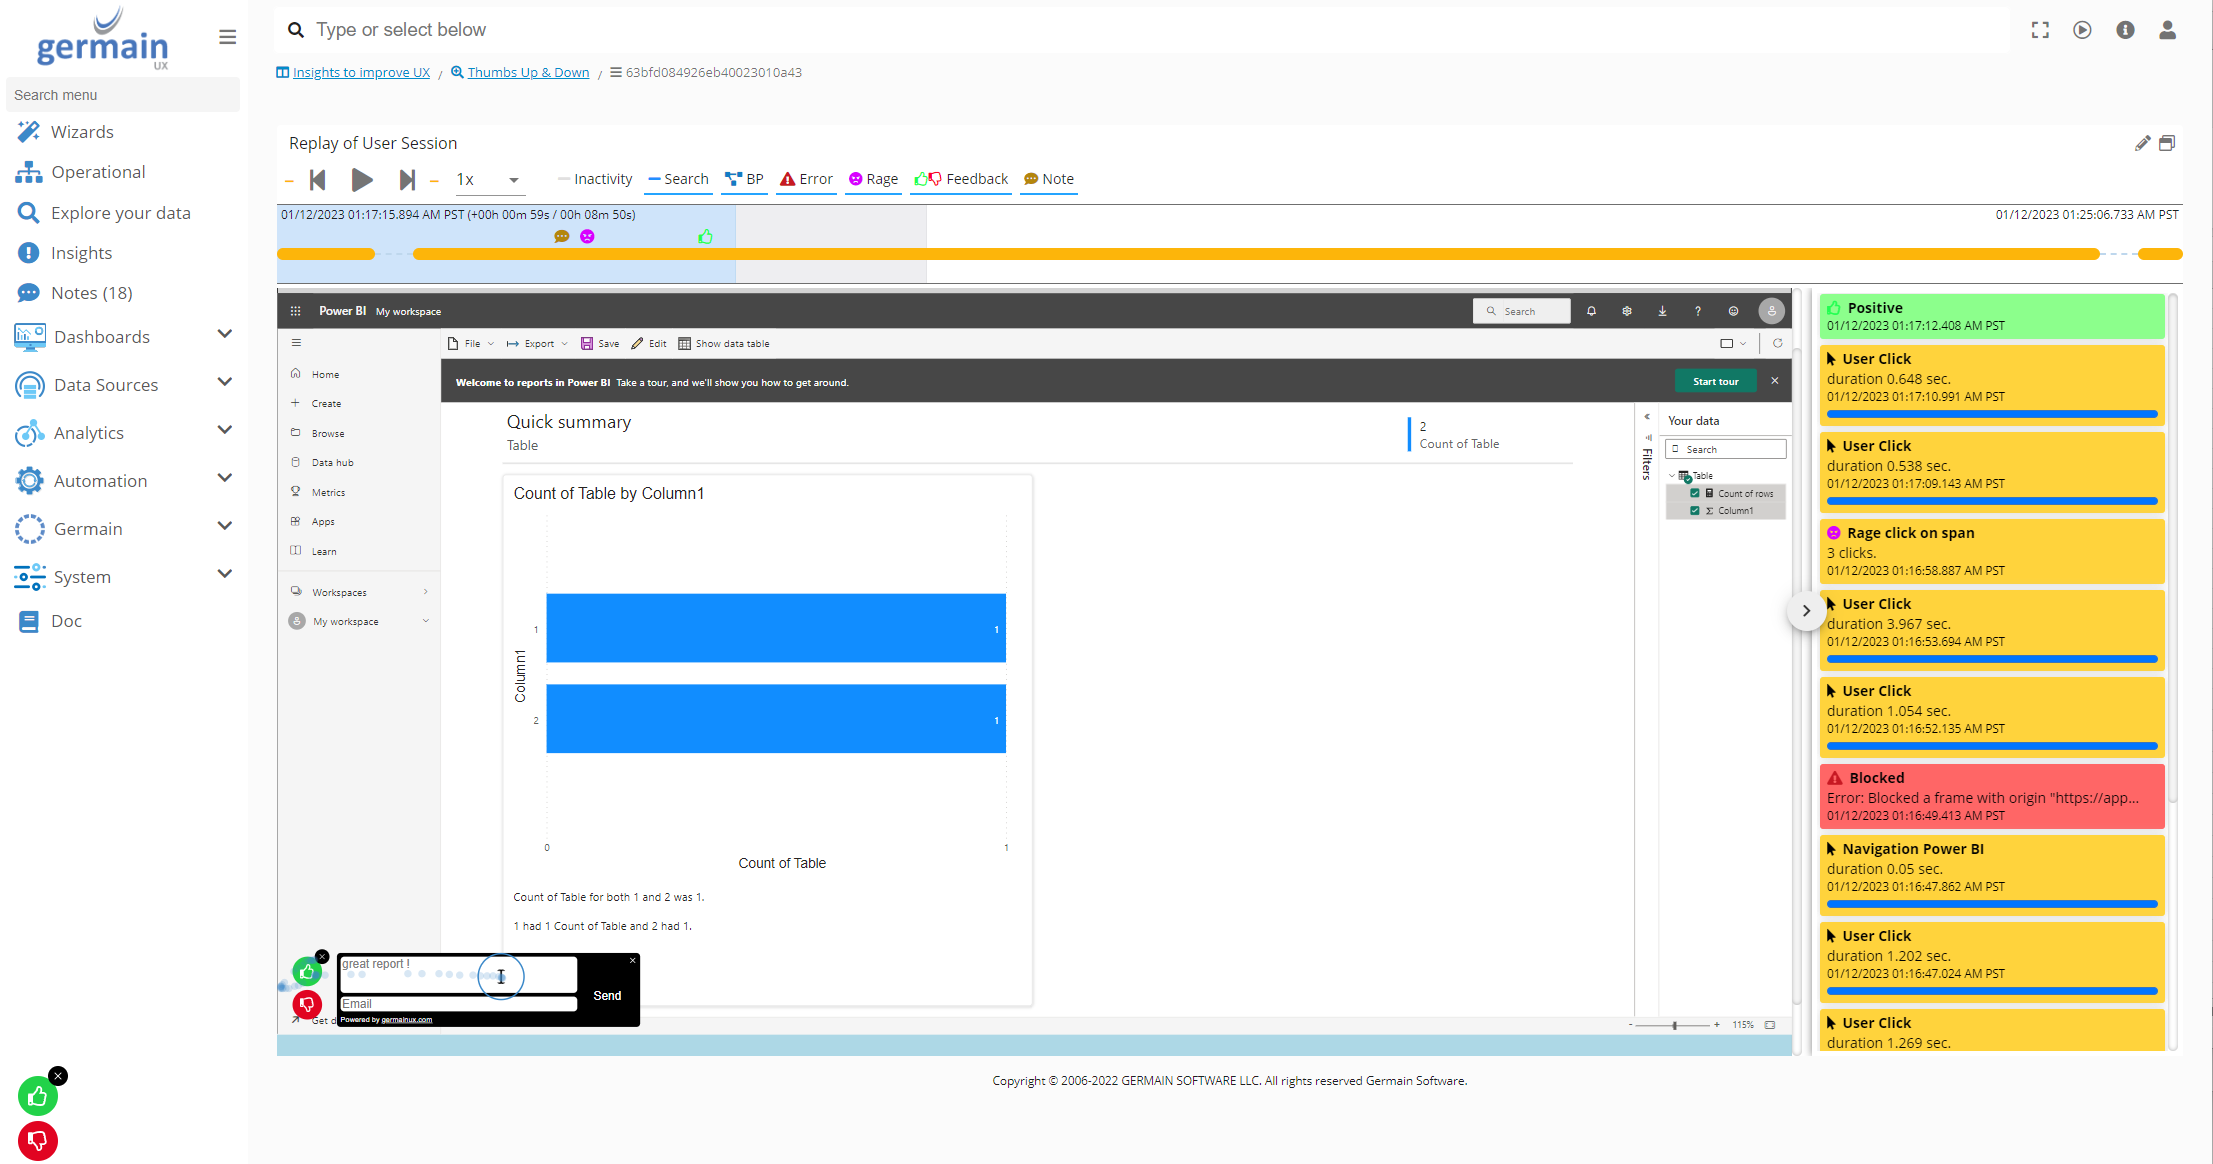
Real User Experience Monitoring and Replay
Germain provides insights into the user experience of your Power BI application. It captures user interactions, navigation paths, and response times, allowing you to understand how users interact with reports and dashboards. By analyzing user experience data, Germain helps you identify any usability issues and optimize the application for a seamless user experience. More details on Germain’s User Session Monitoring, Replay & 6 Heatmaps.
Synthetic Transactions
Germain allows you to set up synthetic transactions to simulate user interactions or application-level actions within your Power BI application. These synthetic transactions can be configured to monitor specific functionalities, user journeys, or critical workflows. By regularly executing these synthetic transactions, Germain can proactively monitor the uptime and performance of your Power BI application and alert you in case of any issues or deviations from expected behavior.
Customizable Dashboards and Reports
Germain offers customizable dashboards and reports that provide a comprehensive view of the performance and user experience of your Power BI application. You can visualize key metrics, trends, and alerts to quickly assess the health and performance of your application.
Germain is designed to provide comprehensive monitoring for Microsoft Power BI applications, giving you the visibility and control to optimize the performance, user experience, and availability of your application.
Configuration
2 options to monitor Microsoft Power BI Application: Germain’s RUM JS or RUM Browser Extension.
Deploy Germain RUM JS
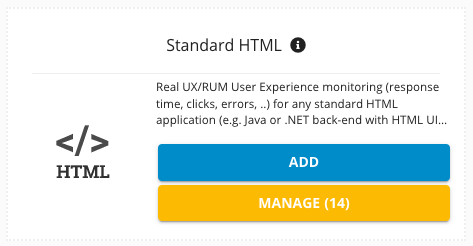
Log on to Germain Workspace > left menu > Wizards >Standard HTML
Download Germain JS script
Log on to Germain Workspace > left menu > Wizards >Standard HTML
Inject germain RUM JS scripts into Power BI Web Template
If you don’t know how, contact us support @ germainux . com
Deploy Germain RUM Ext (Browser Extension)
Germain browser extension (Firefox, Edge, or Chrome) is now available for download and use. Some managed Microsoft Dynamics applications do not allow Javascript injection, as an alternative, you can use Germain Browser Extension to monitor the User Experience of these managed applications.
Installation
Configuration
-
Once installed, the extension needs to be configured as follows
-
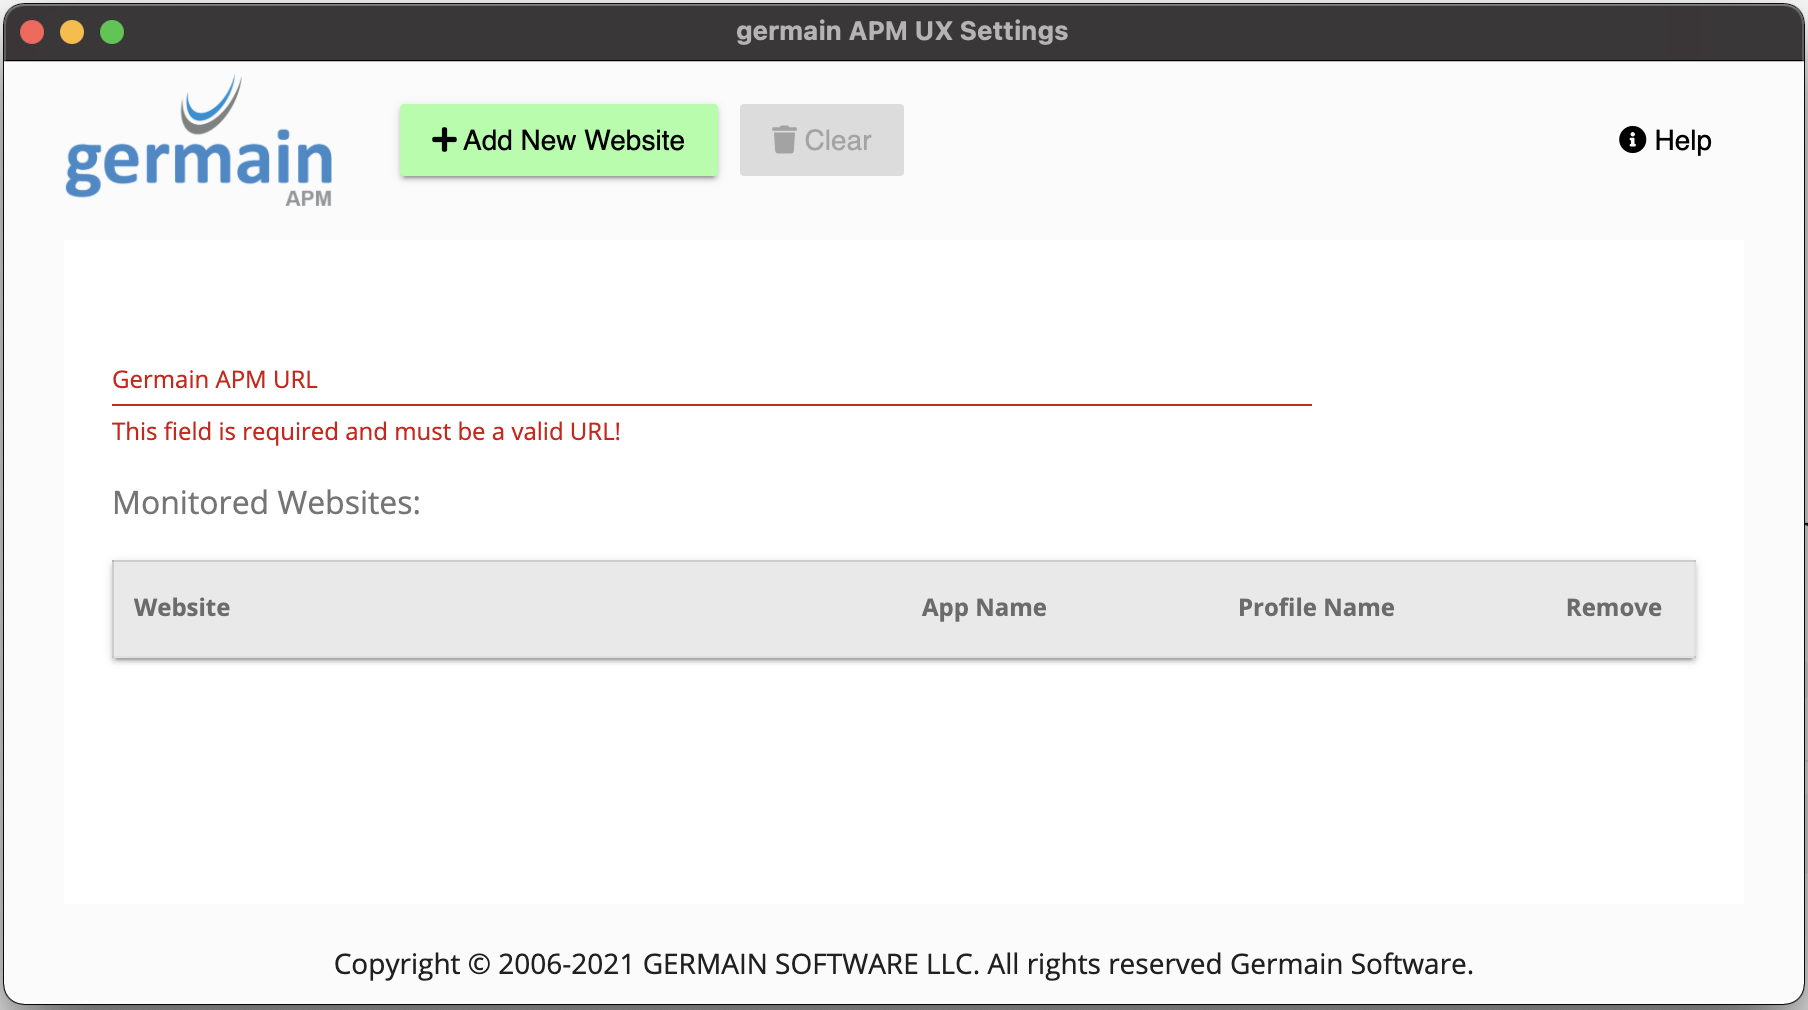
Germain Germain URL - this will be the base URL of your Germain instance (e.g. https://myinstance-germainux.com)
-
Click “Add New Website”
-
Website URL - this is the base URL of the site you want to monitor
-
Application Name - Set this to the name of the application (e.g. MyApplication, …)
-
Profile Name - Set this to the same value that is set in Germain (Analytics / UX Settings / Application Profiles and create or pick the profile name that you want to use)
-
Once configured, refresh the page. Your application is now ready to be monitored.
Power BI Transaction Root-Cause Analysis
(this is out-of-the-box, then you can customize the RCA and Tracing capabilities as you wish, and we can do it for you at no charge)
Component: Engine, JS Profiler, RPA Bot Recorder, RUM JS, RUM Ext
Feature Availability: 2022.1 or later