Use Cases for Salesforce (SFDC)
Germain UX enhances Adoption, UX, and Productivity for both Salesforce Classic and Lightning environments with use cases including:
-
Boost SFDC adoption.
-
Improving Operational Productivity.
-
Optimize SFDC Application Performance and Usage.
-
And more Use Cases
Real-time Insights & Automation for Salesforce (AI-Powered)
Germain monitors SFDC Lightning and Classic, 24x7 in real-time to find frictions that affect Adoption or Conversion. It helps understand “why” these frictions occur, detects them before business impact, automates resolution (whenever that is considered safe and sound), in real-time, 24x7. In summary, Germain offers:
-
Monitoring of SFDC Capacity, Performance and Usage (24x7, Real-time).
-
Recording, Replay and AI Summary of Real User Sessions (Millisecond-precise, Fully searchable)
-
AI Friction Finding & Analysis at User Behavior, Workflow and Technology levels.
-
Process Mining & Inefficiency Identification (AI-Powered).
-
Adoption Analysis (AI analysis to find top issues and recommendations, at scale).
-
Real User Feedback (AI Aggregation).
-
Predictive and Proactive Detection & Alert.
-
(When considered safe) Automatic Resolution.
Germain UX is available on the SFDC AppExchange: https://appexchange.salesforce.com/appxListingDetail?listingId=a0N3A00000FAAYXUA5.
Video overview: https://www.youtube.com/watch?v=Tpp_4edlAGk
And here are more details on Germain UX features for SFDC:
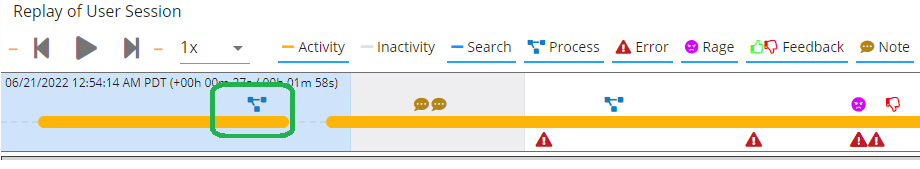
Real User Monitoring & Session Recording, Replay and Summarization for Salesforce Clouds (SFDC)
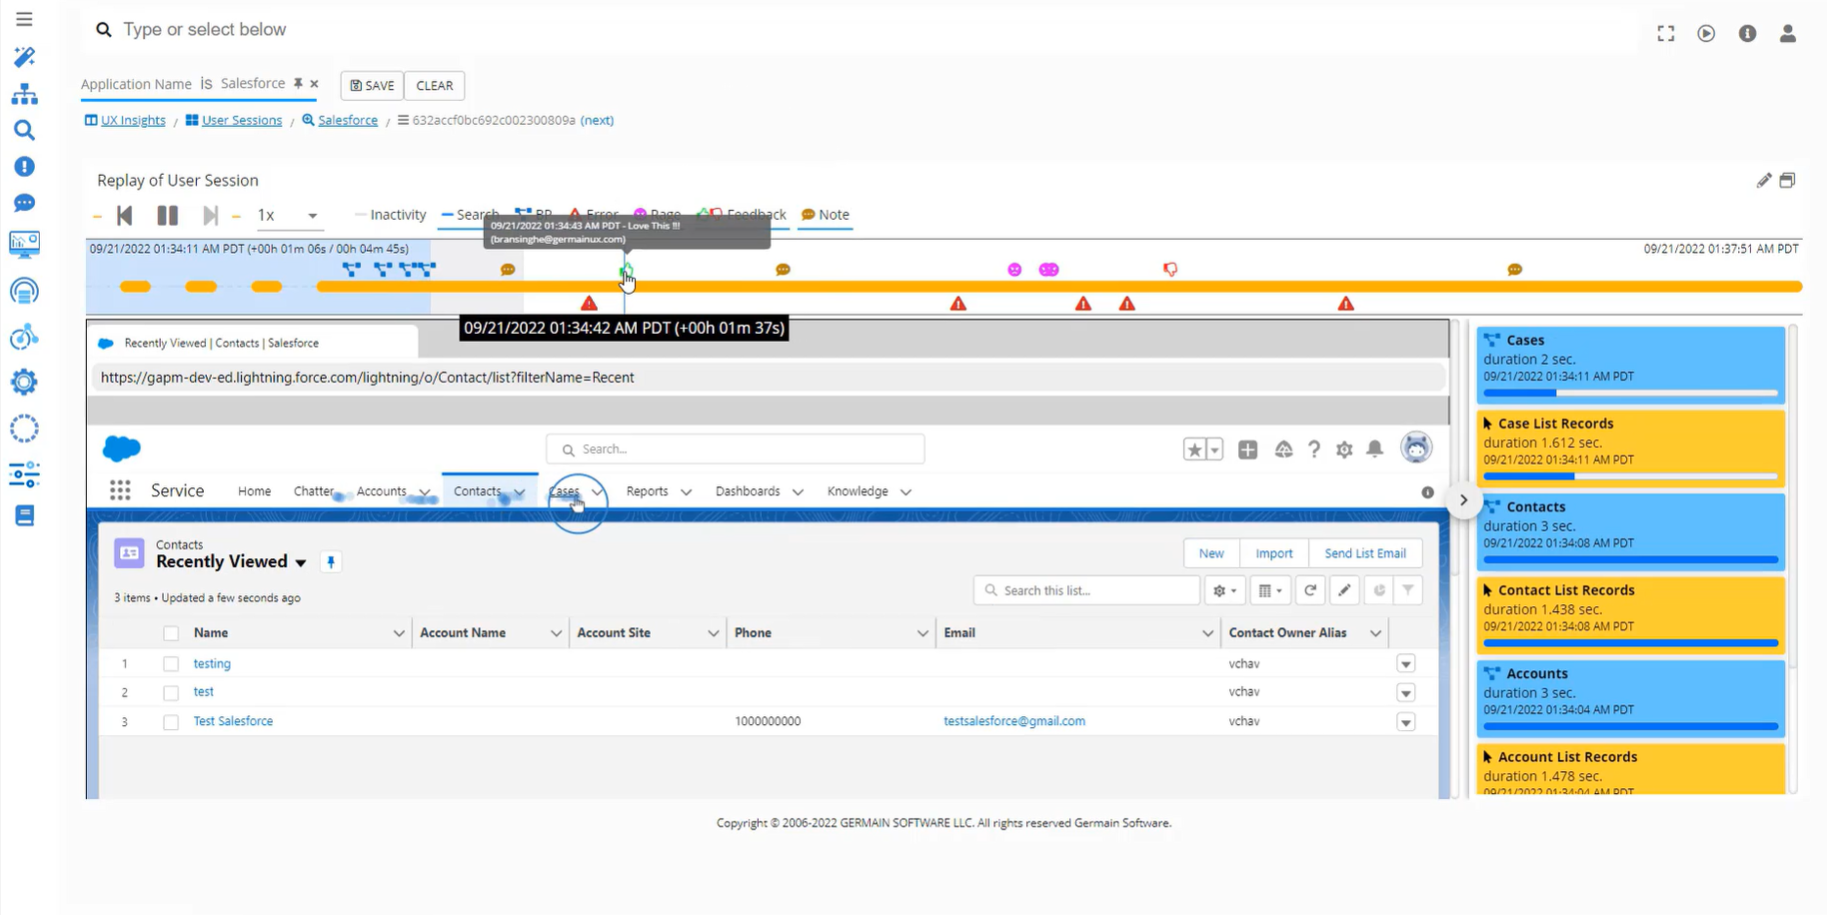
Germain automatically records millisecond-precise, pixel-perfect user sessions 24/7, providing real-time insights to understand both the 'what' and the 'why.' Germain UX identifies friction points (via AI mechanims) and their underlying causes, streamlining business impact analysis for critical UX, Adoption, and Productivity issues without the need to review numerous videos. You can quickly replay specific segments of recorded sessions by searching for your priorities. All business or metadata data is fully searchable, maintaining GDPR compliance, whether at scale or within a recorded session.
-
A Look Inside the GermainUX Session Replay Workspace:
-
AI-Powered Session Summary:
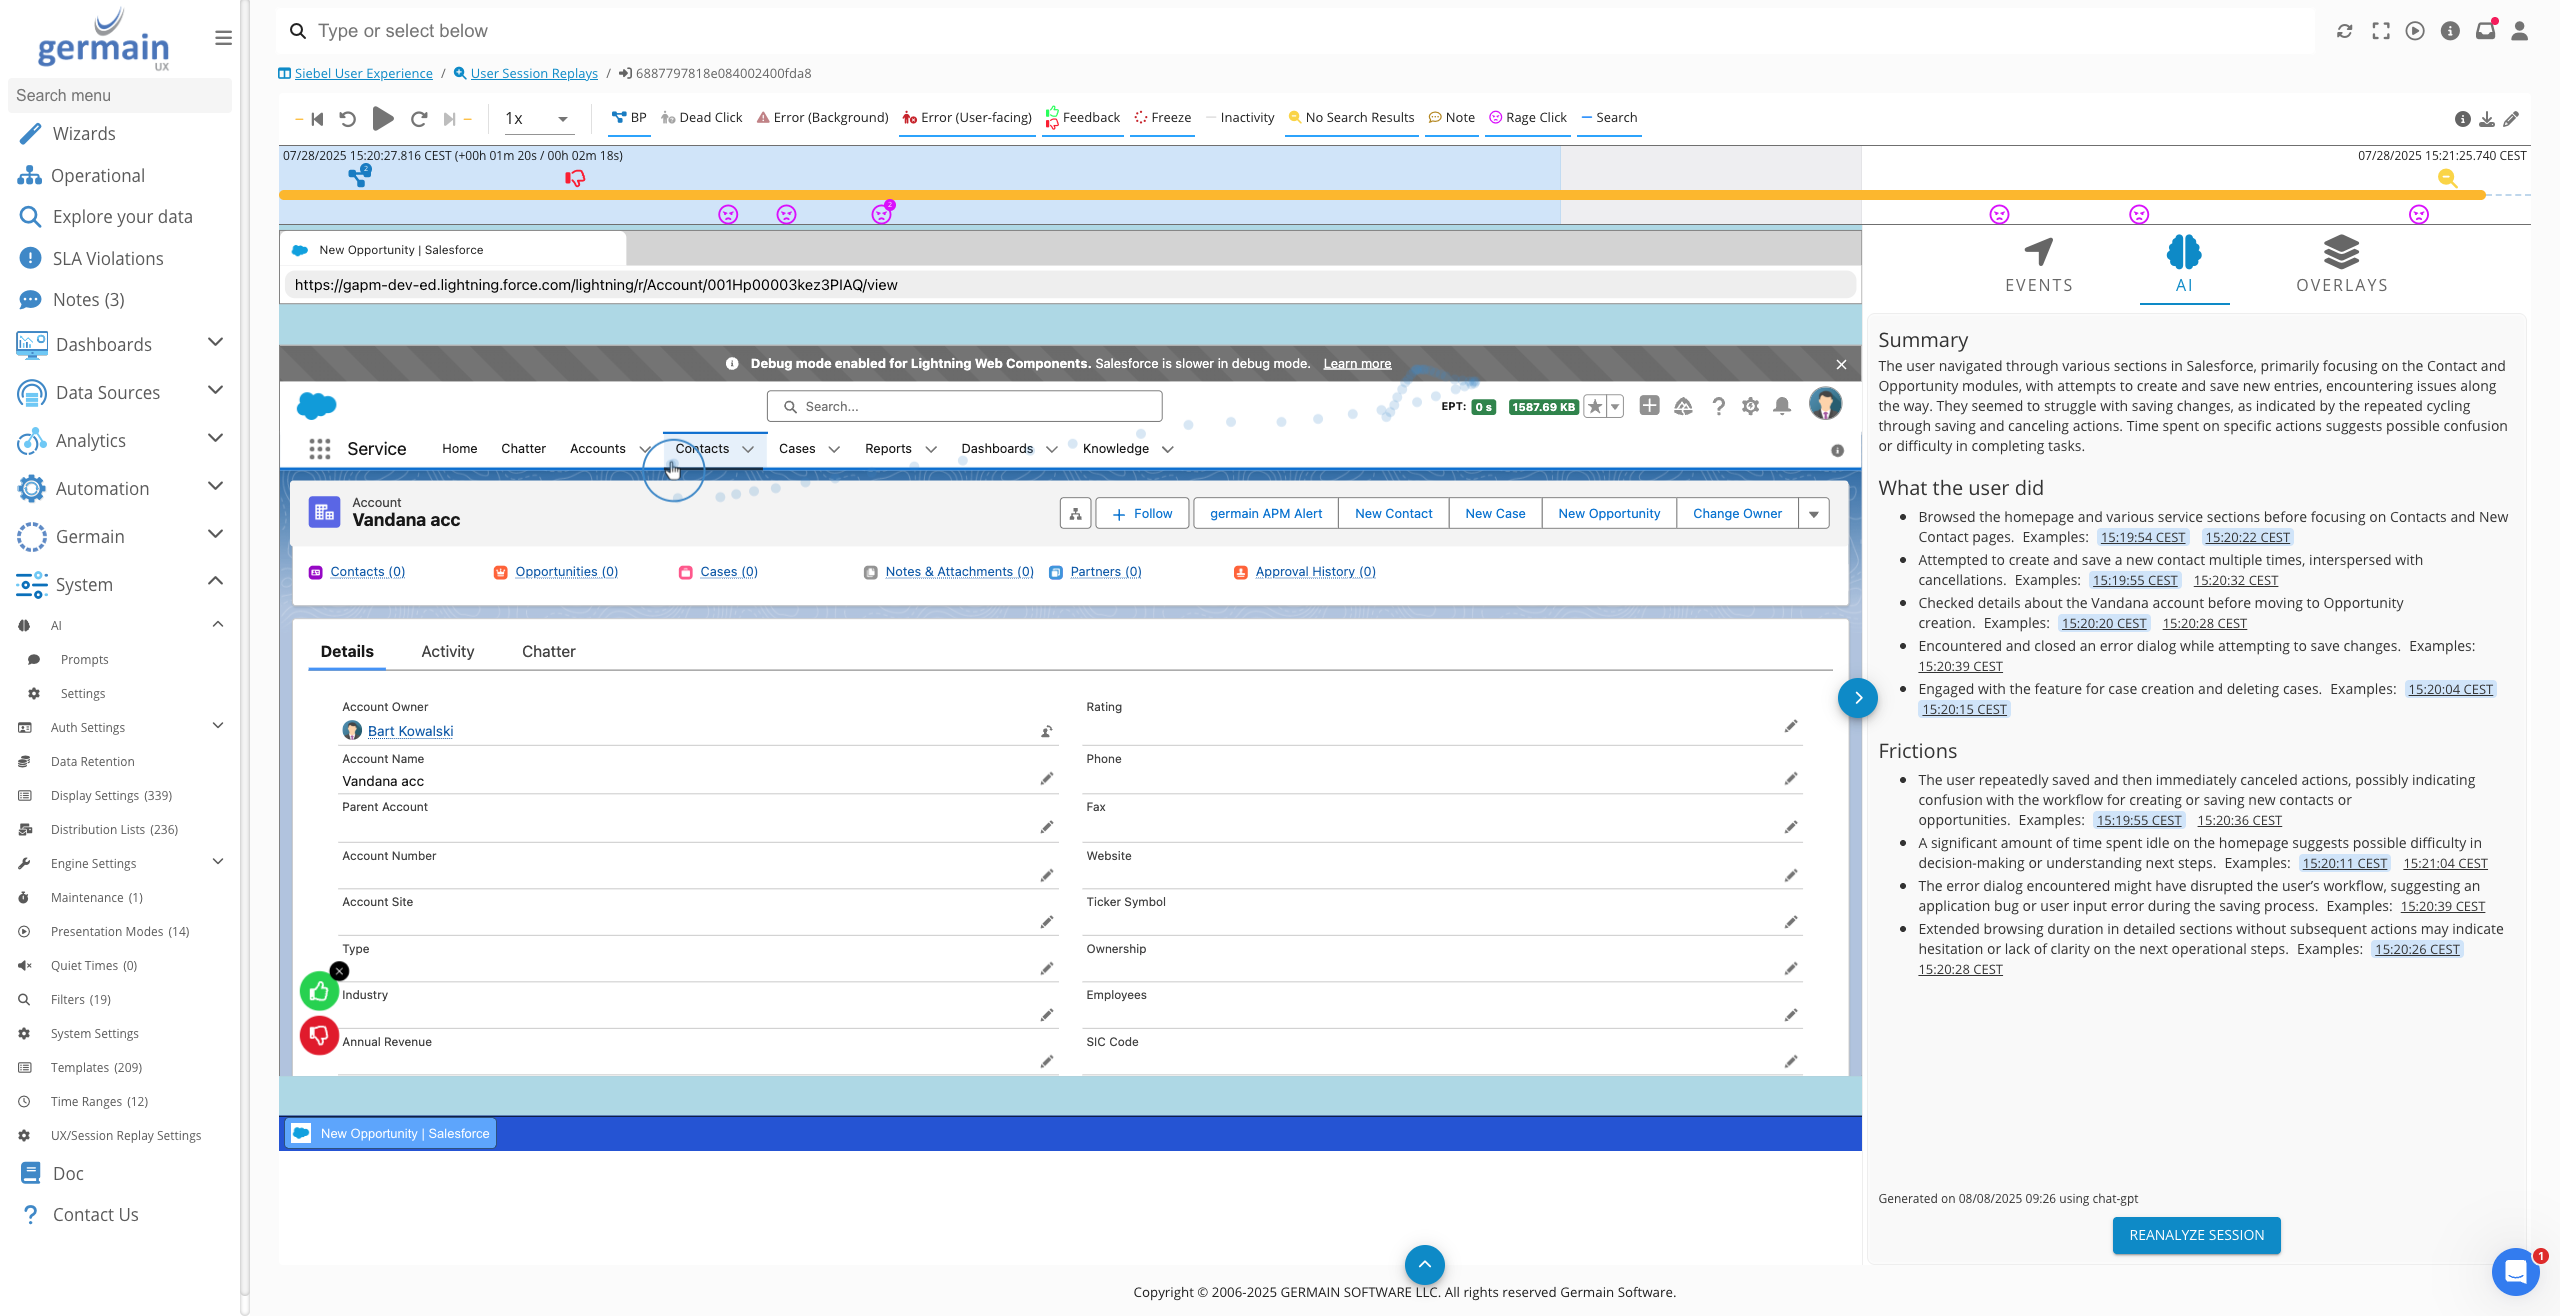
More details about Germain UX Real User Session Monitoring and Session Replay feature.
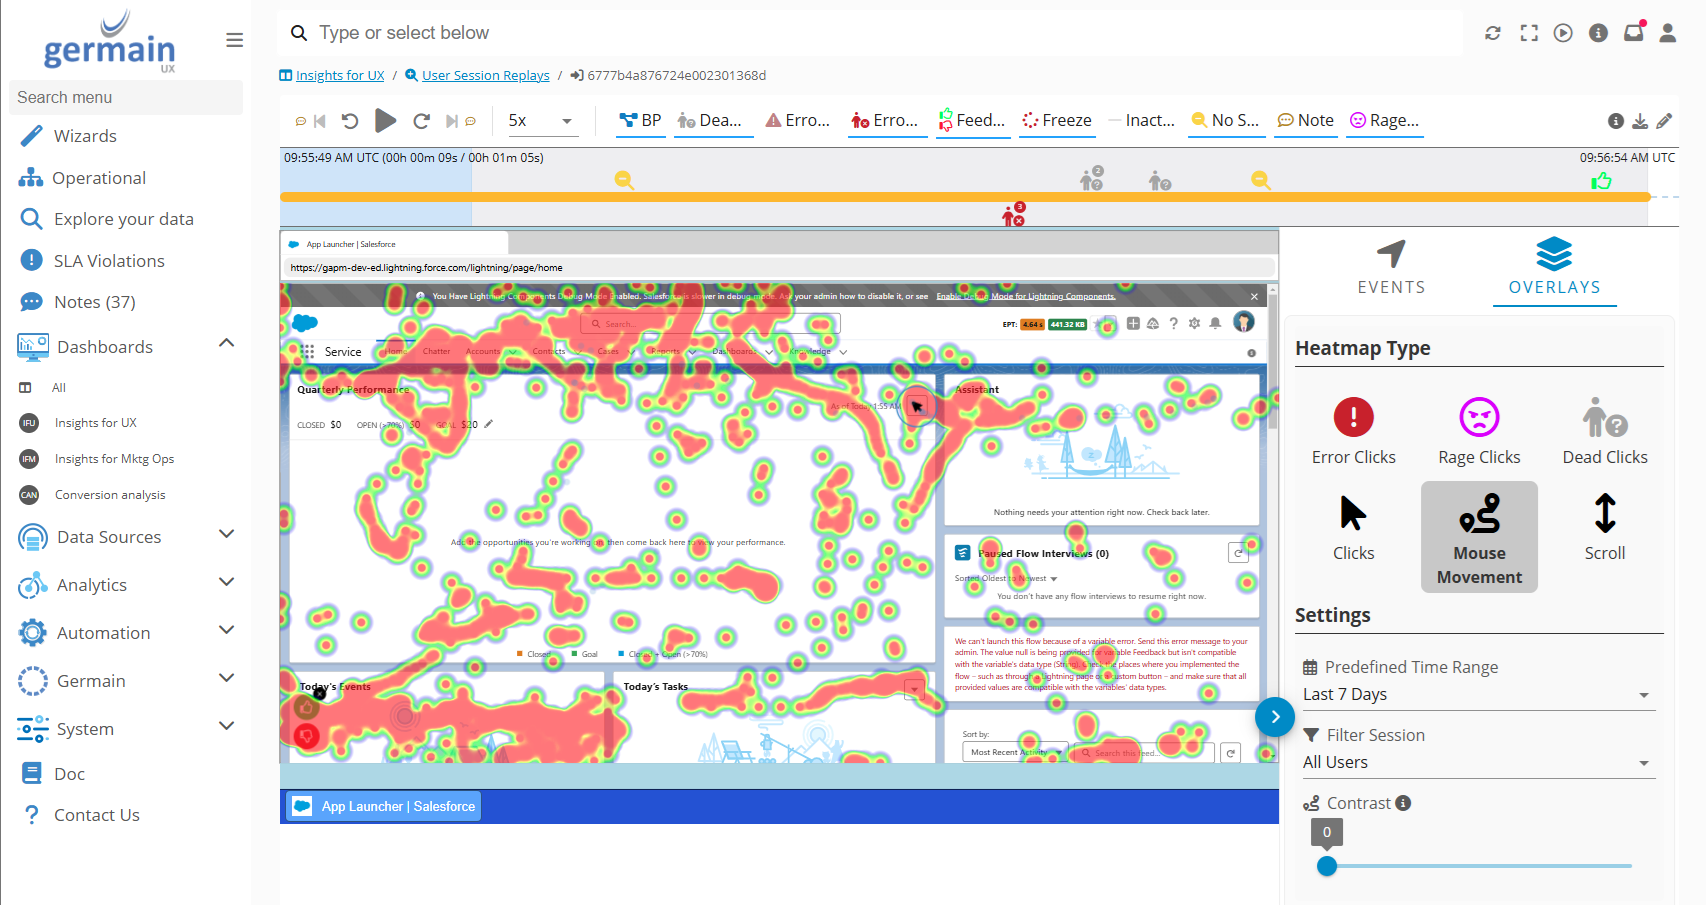
Heatmaps to Understand User Behavior
Six heatmaps are available to help you diagnose friction at the user session level, either for individual users or all visitors. Learn more about heatmaps here.
Real User Feedback & AI Analysis for SFDC
For Net Promoter Score (NPS), Germain offers a powerful capability that enables real users to provide their feedback in real-time through a popup that can be dynamically enabled and made visible on the monitored application. This feedback is crucial for assessing customer satisfaction and loyalty.
More details on Germain UX’s User Feedback Popup and how to enable it.
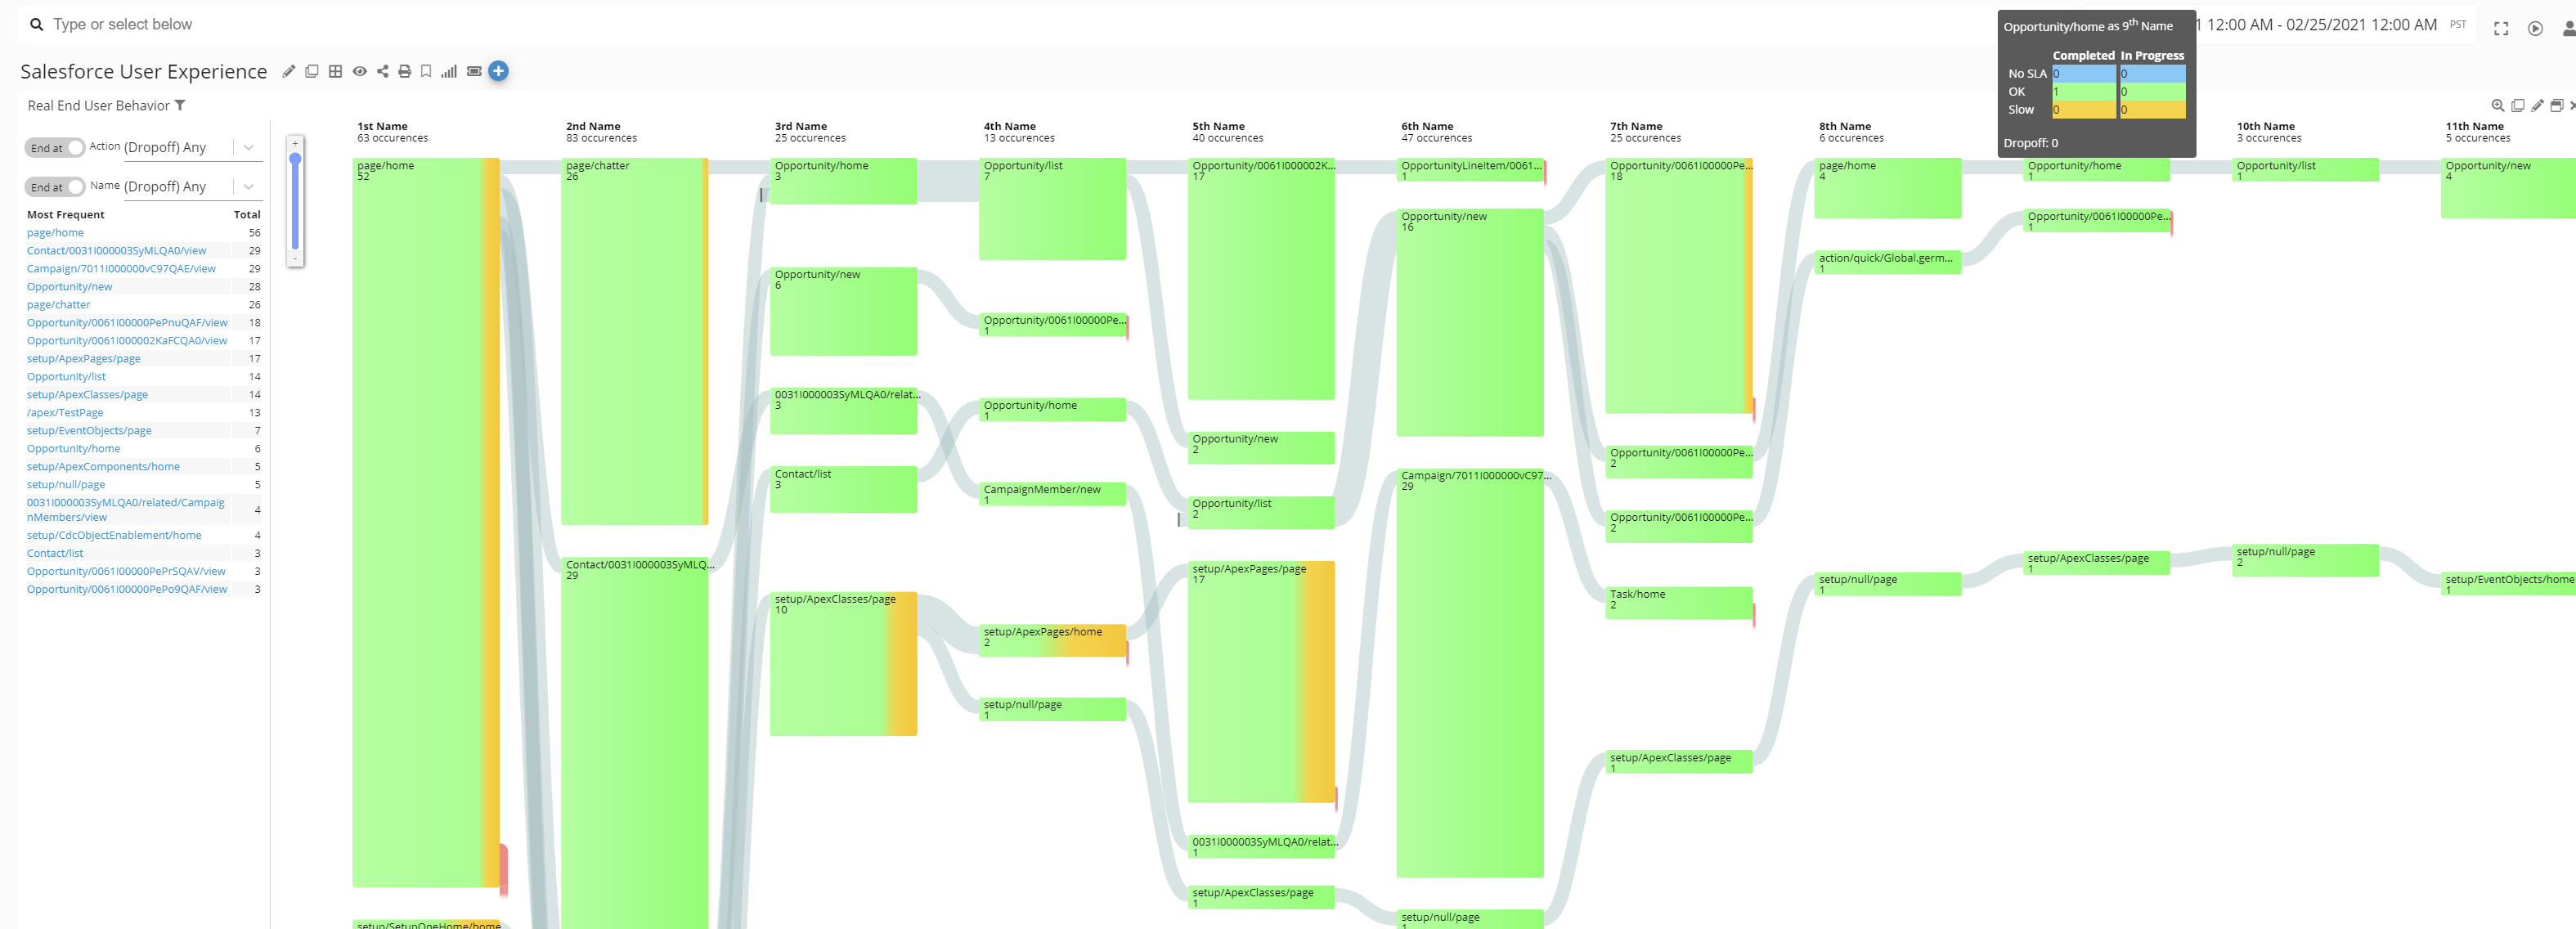
Business Process Mining for SFDC
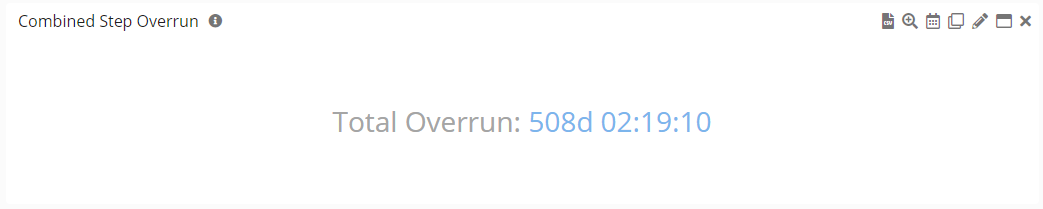
Germain offers real-time 24/7 performance monitoring for critical business processes and workflows in your SFDC application and automatically detects and highlights inefficiencies or productivity loss, most often referred to as overrun.
Importantly, this Workflow Mining feature works seamlessly with various data sources and operates without direct user involvement. For instance, with Germain, you can trace the complete customer journey, from website visits to interactions with your sales team, in-person visits to your office or store, and through back-end order fulfillment and shipping processes.
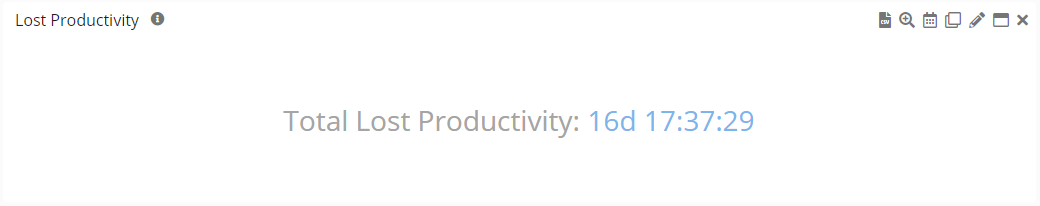
Wasted Productivity
Automatic measure and tracking of wasted time for all users, teams for Salesforce and other application, in near real-time, 24/7:
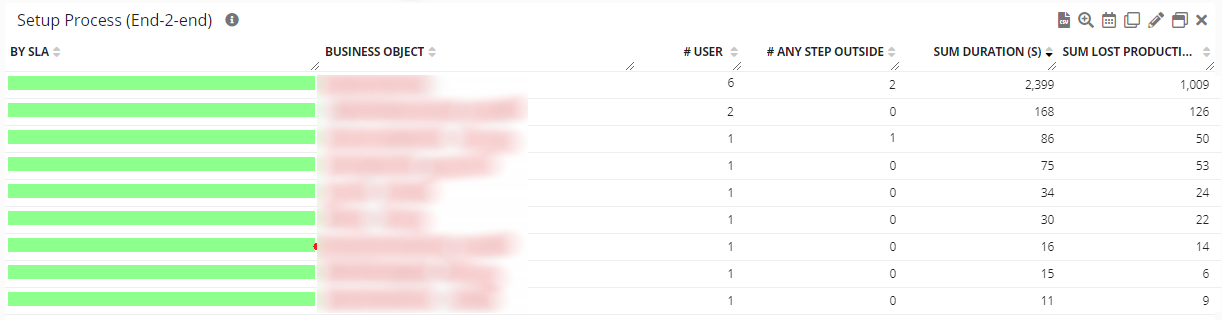
Productivity Insights at the Process level
Automatic in-depth analysis of wasted time at the process level, breaking it down at the team, user, and milestone levels.
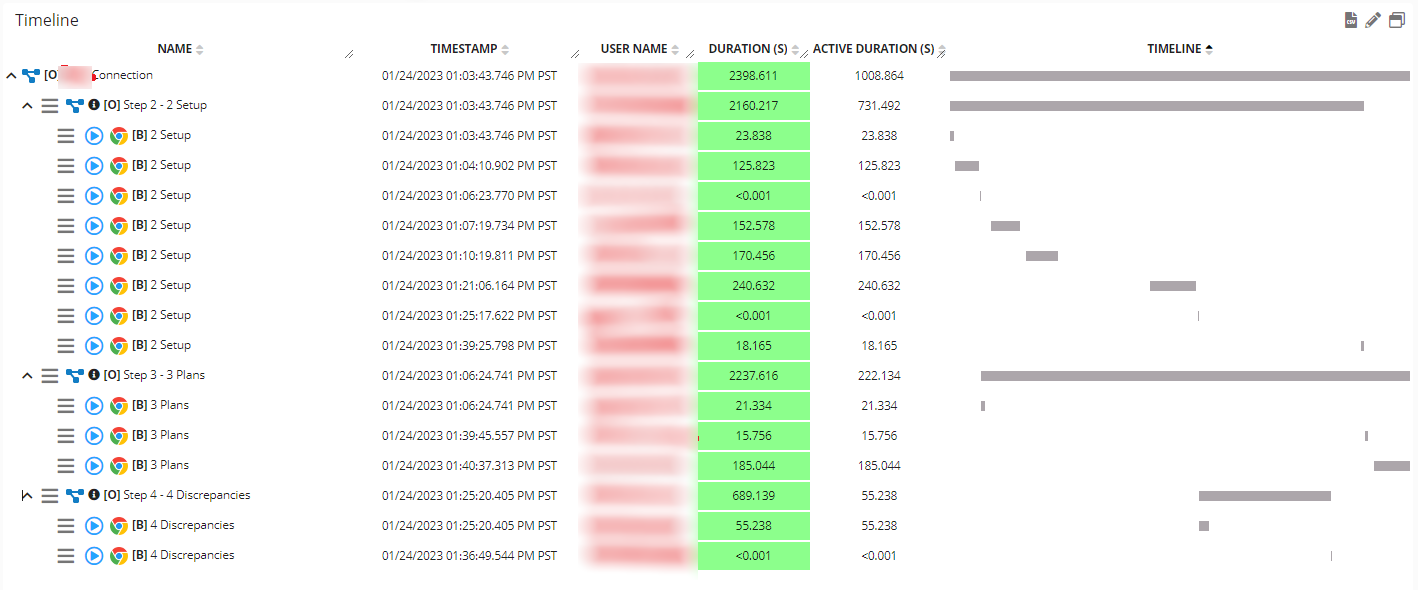
Productivity Insights at User Session Level
Replay the user sessions that contributed to the wasted time. Automatic qualitative and quantitative insights, to best understand “why” time was wasted
Business Journey Flow
Gain insight into the flow and efficiency of a business operation on a large scale, and identify areas where it may be ineffective.
More details on Journey. And how to monitor your own Workflows.
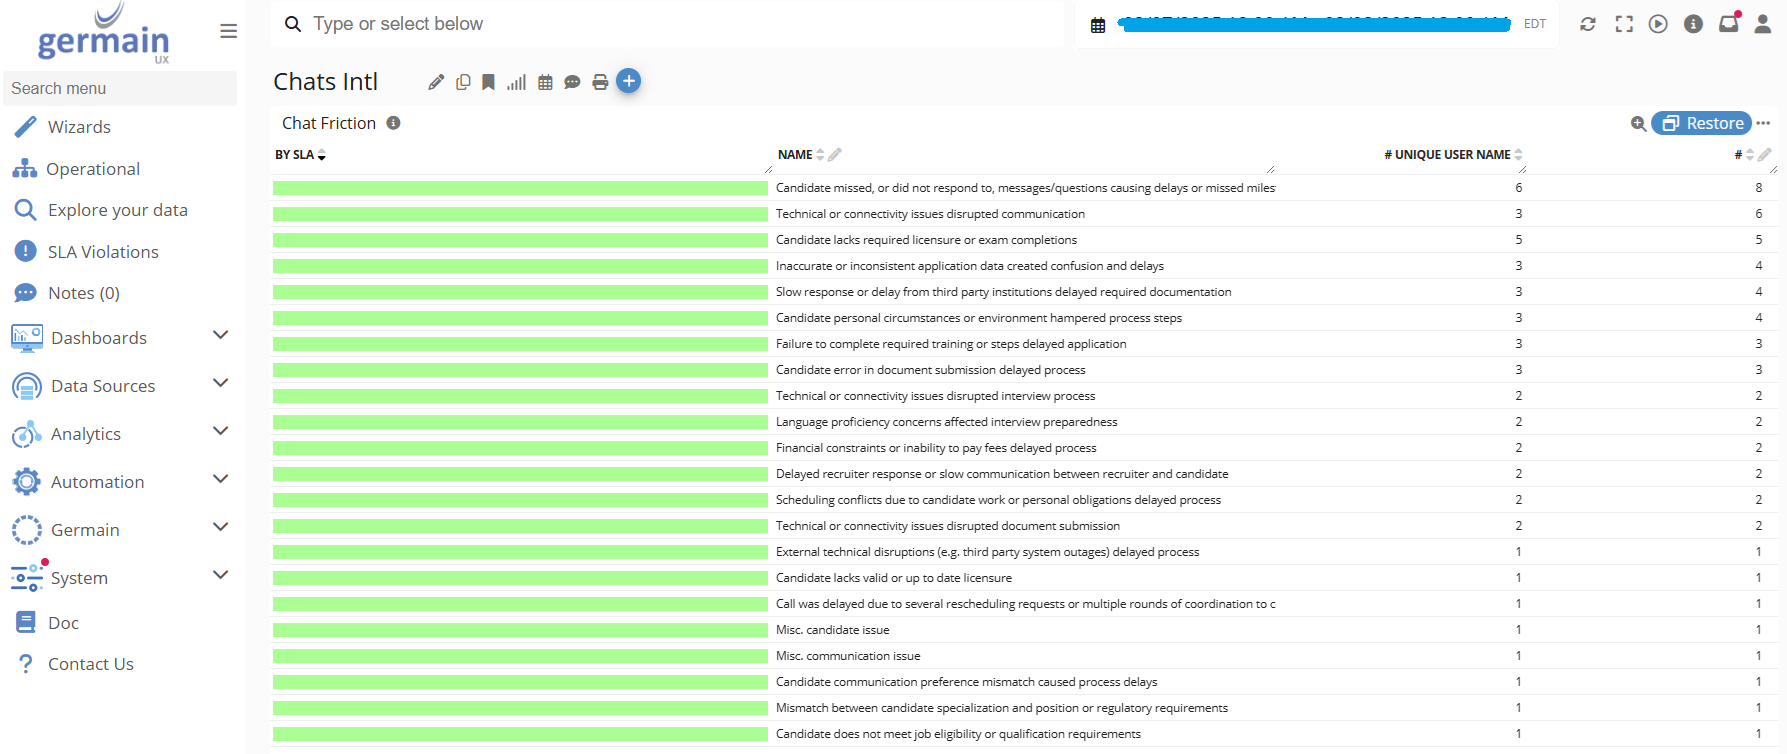
Chat Analysis (AI-Powered)
GermainUX’s AI Service automatically analyzes conversations that occur on SFDC, via technologies like OmniChannel, RingCentral, WhatsApp(…), and detects friction points. This feature helps identify breakdowns in communication, delayed responses, escalations, sentiment shifts, or repeated questions that impact user or agent experience.
-
Example: GermainUX’s AI-driven Chat Analysis & detection of friction patterns in conversations that occurred on RingCentral:
-
Example for Omni-Channel below.
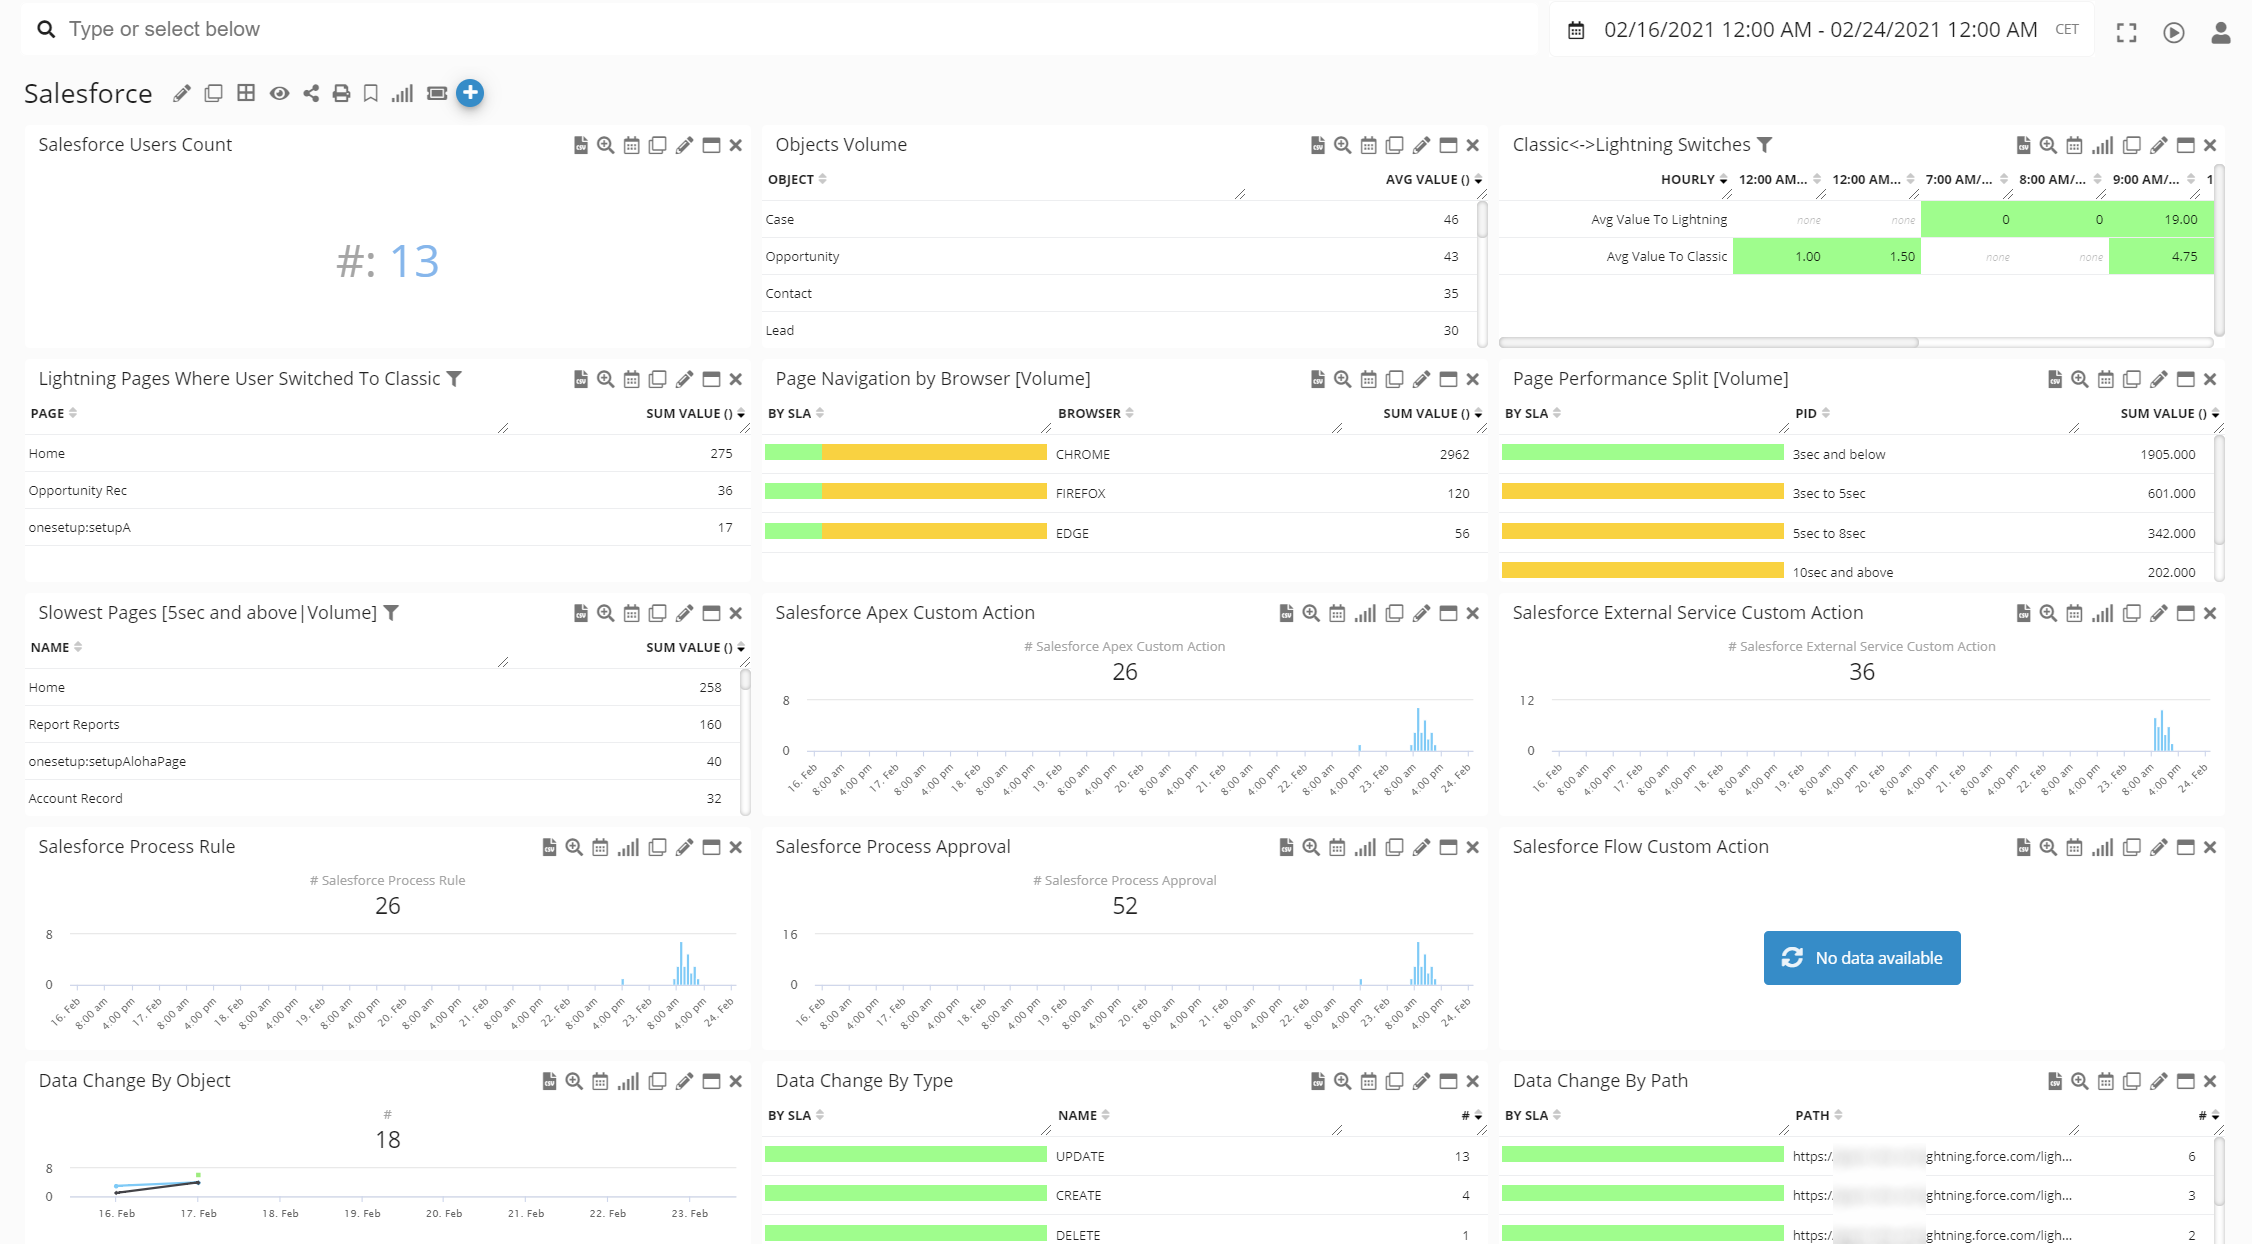
Capacity, Performance and Usage Monitoring for SFDC (24x7, Real-time)
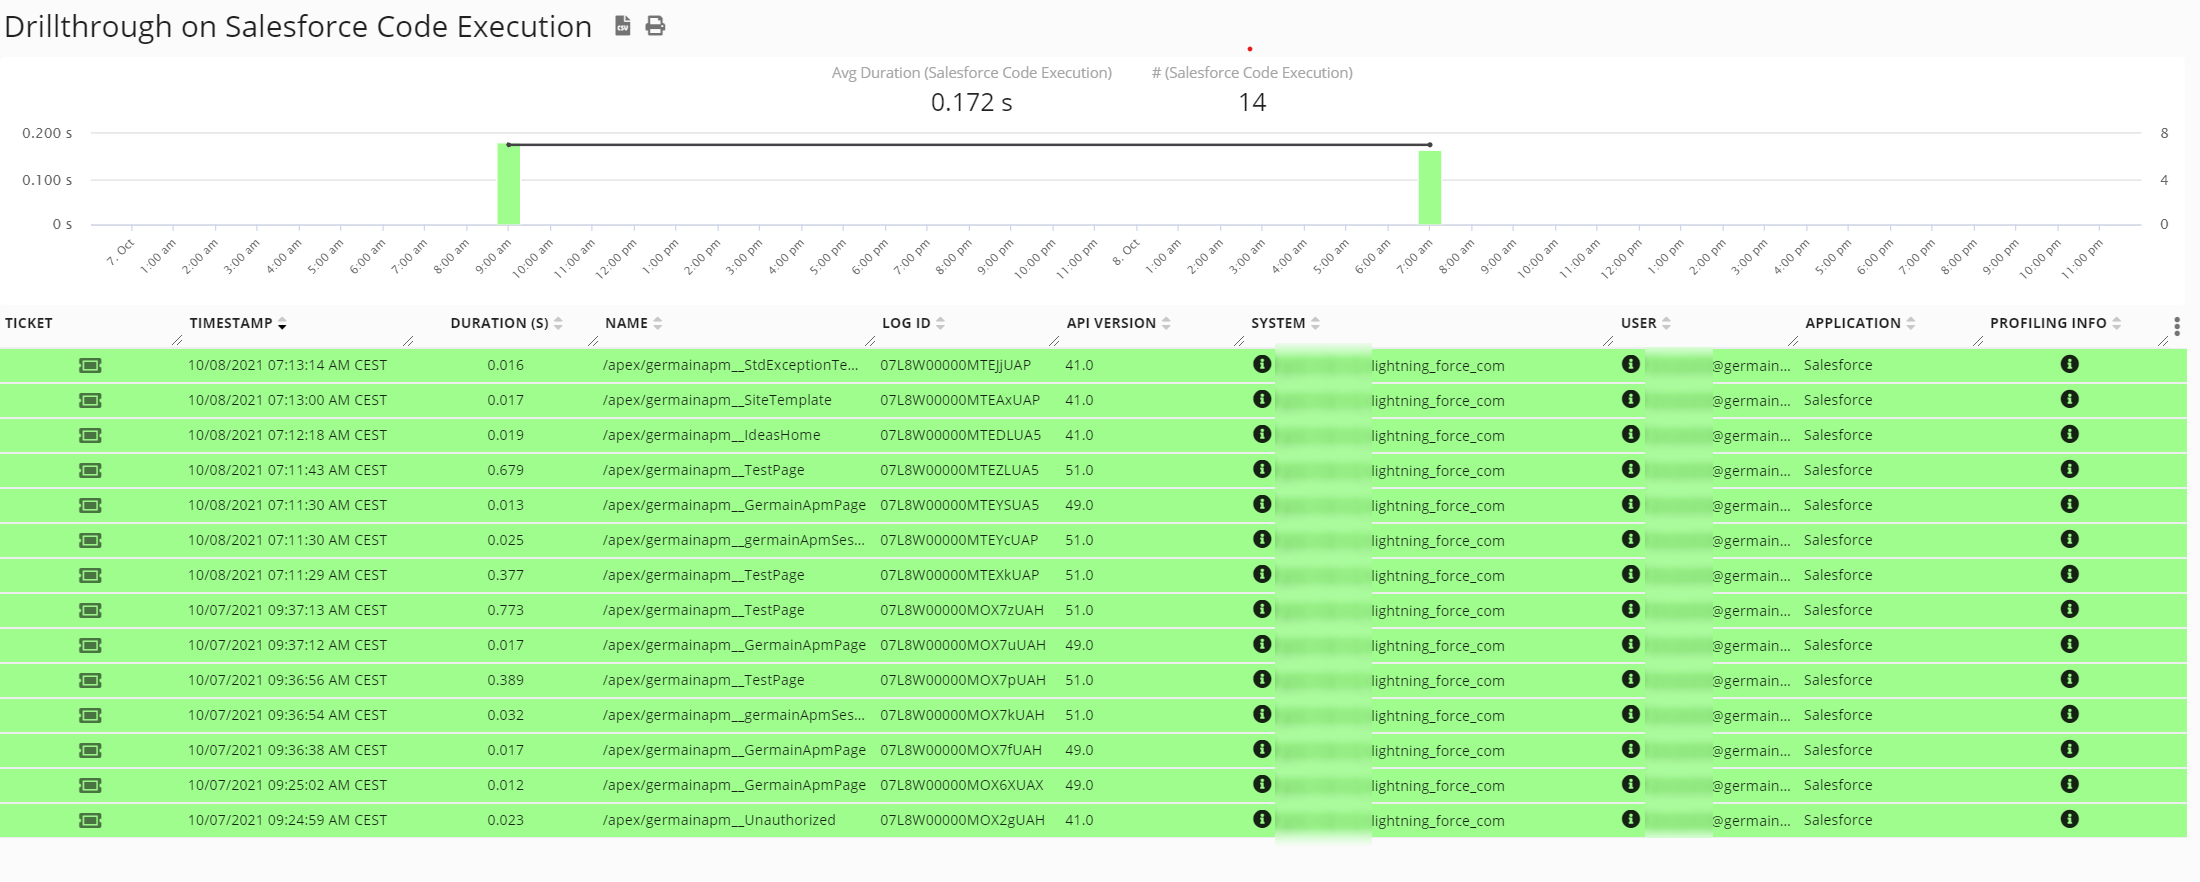
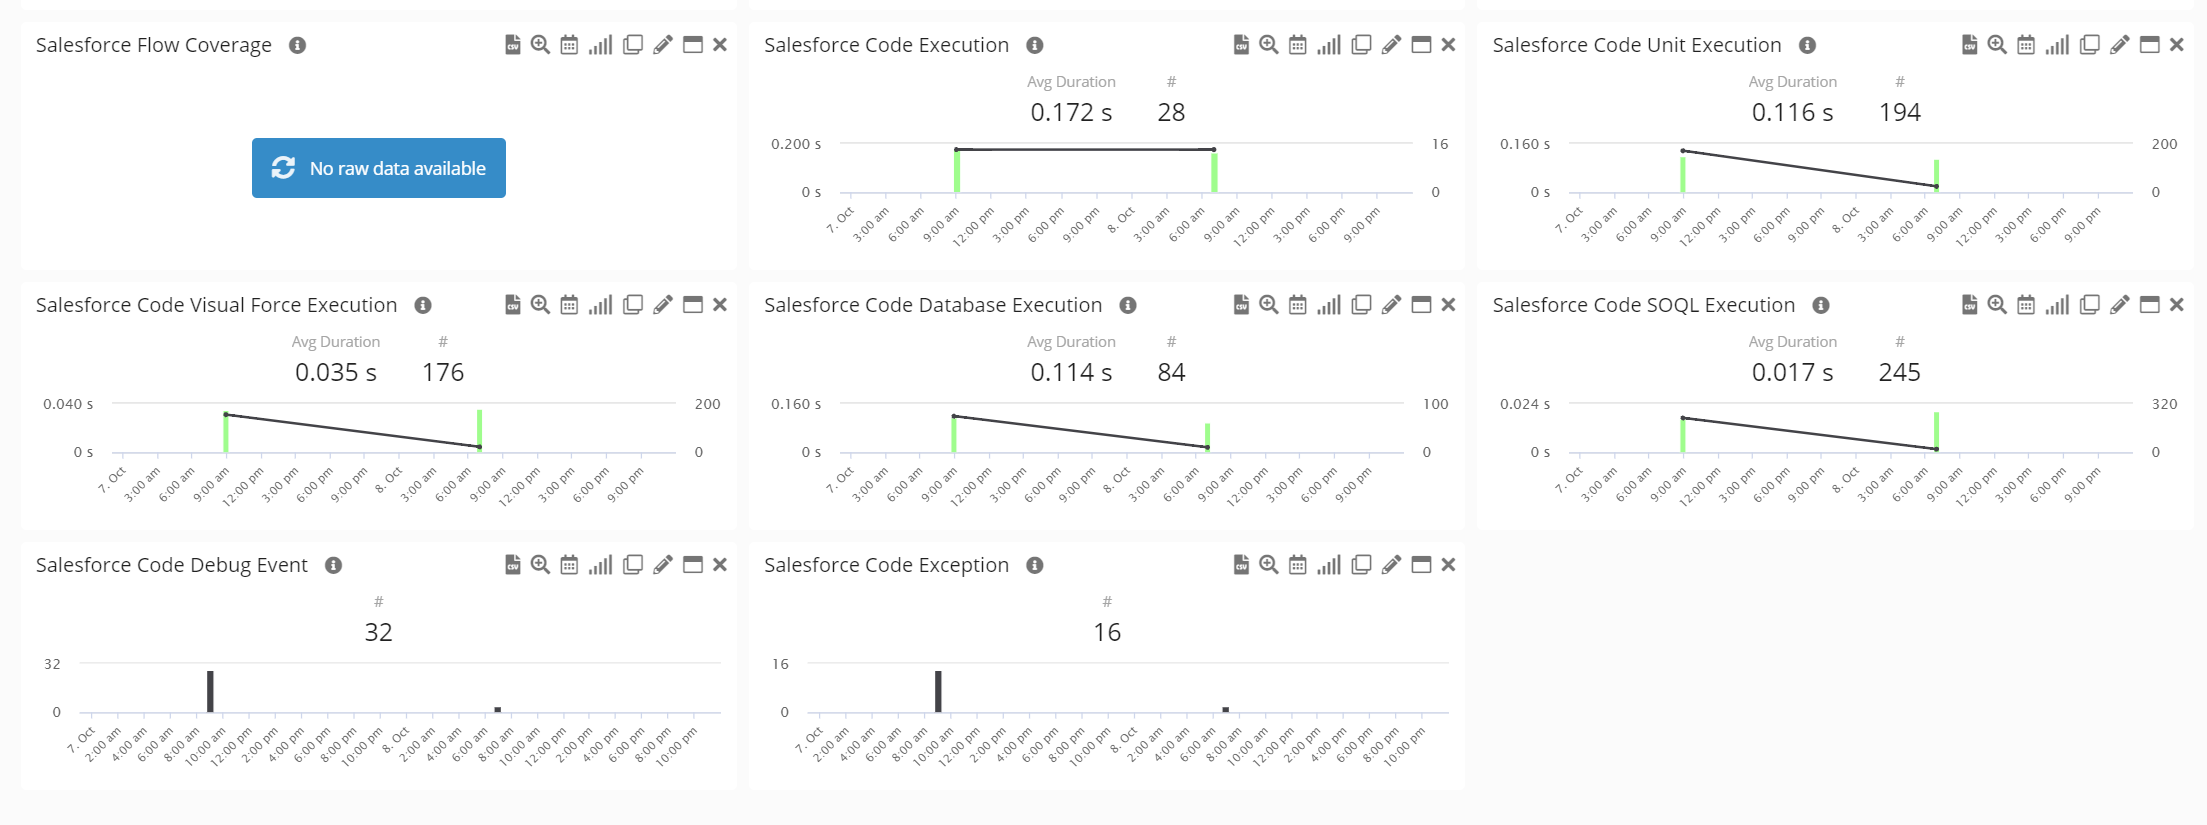
Germain continuously monitors the performance and uptime of SFDC applications, with automatic analysis of slowness or errors down to Apex code, database operations, and custom objects in real-time, 24/7.
Technology issues, such as slow page loading, browser freezes, and specific errors relevant to SFDC users, are automatically identified by Germain. Some examples:
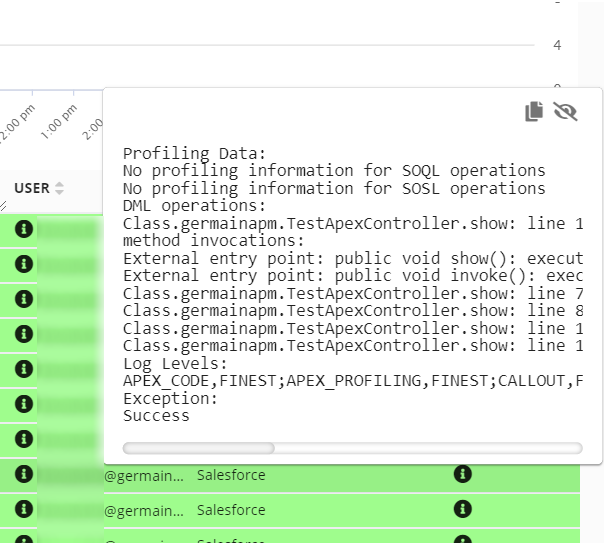
Apex Code Insights
Browser Insights (for SFDC)
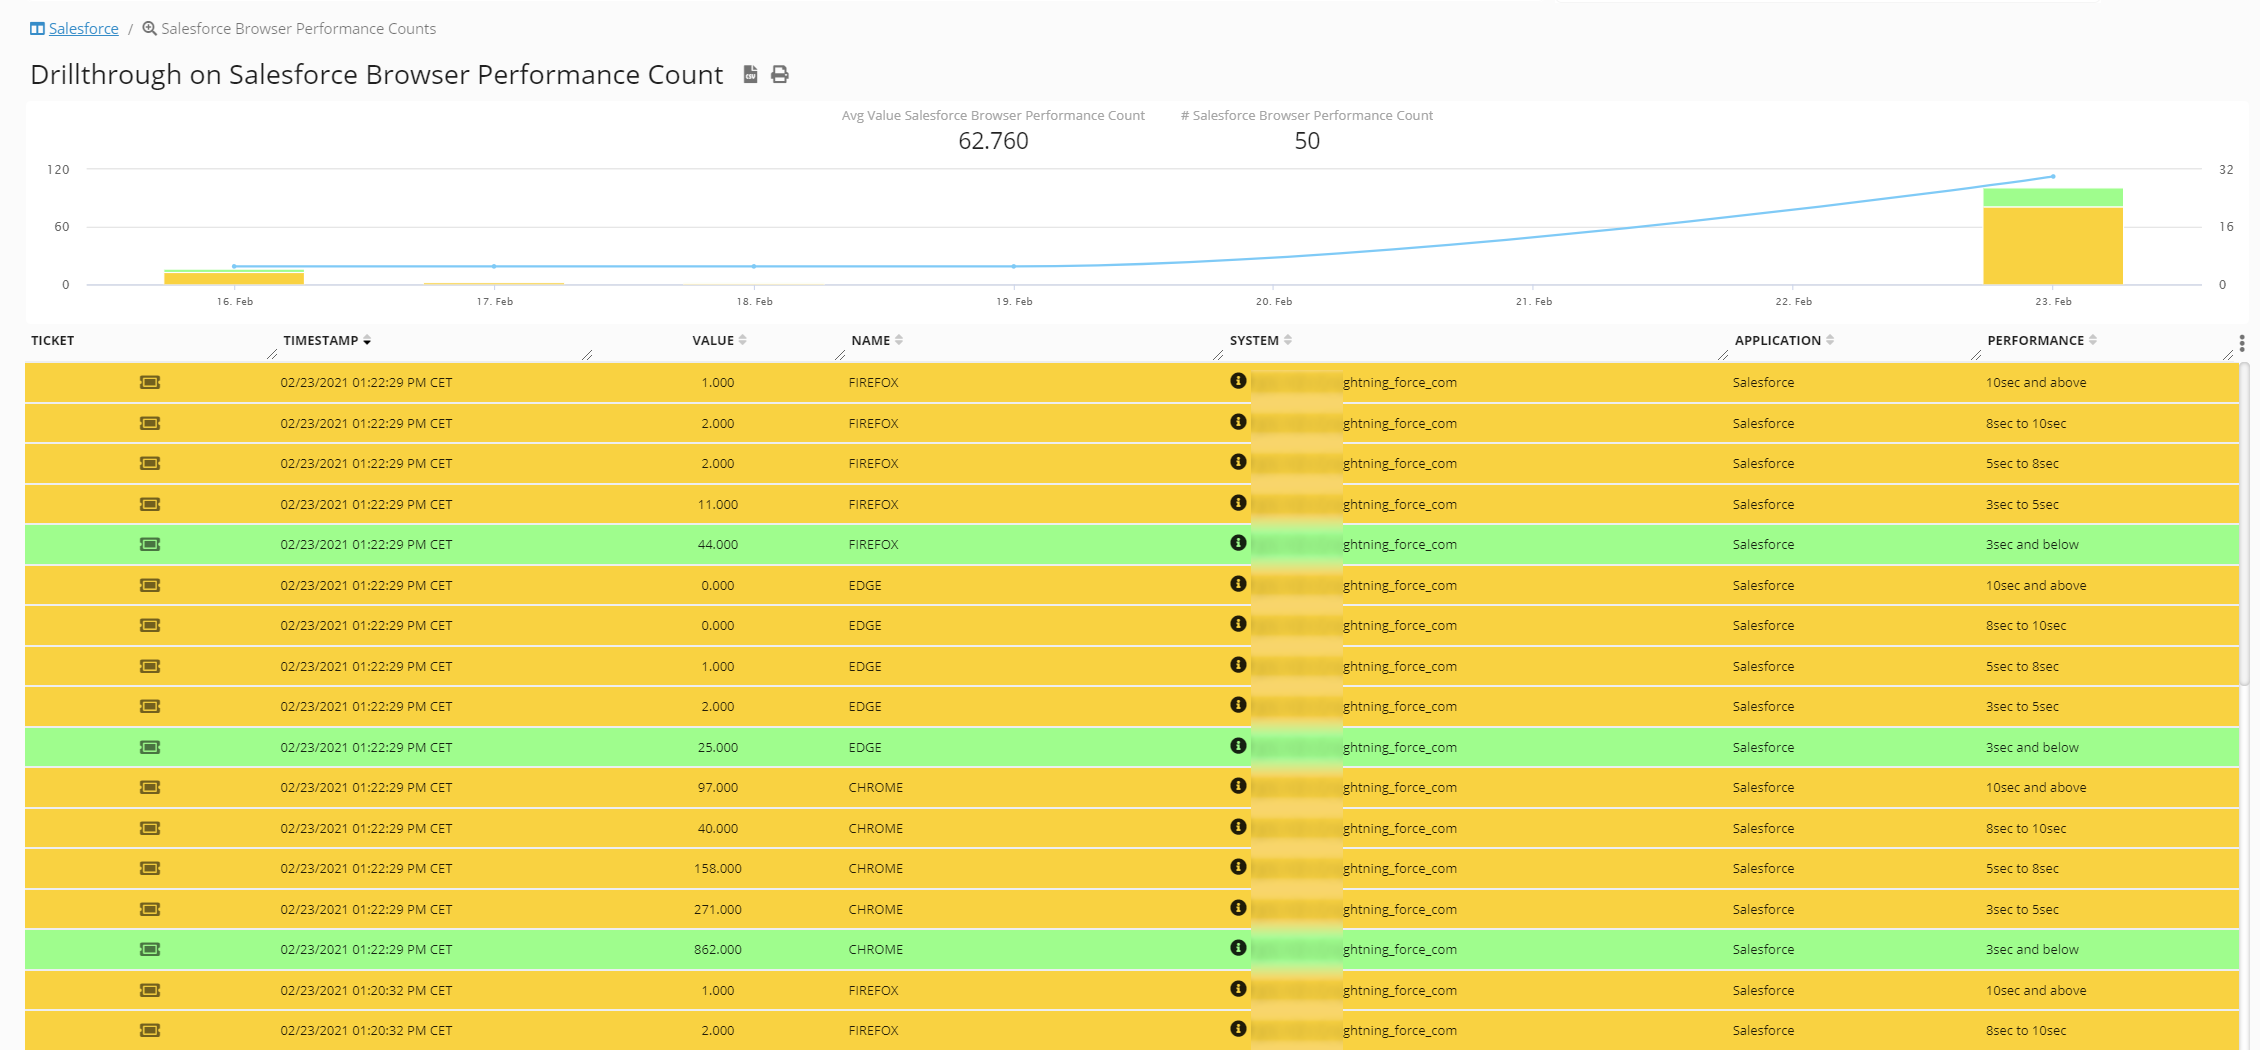
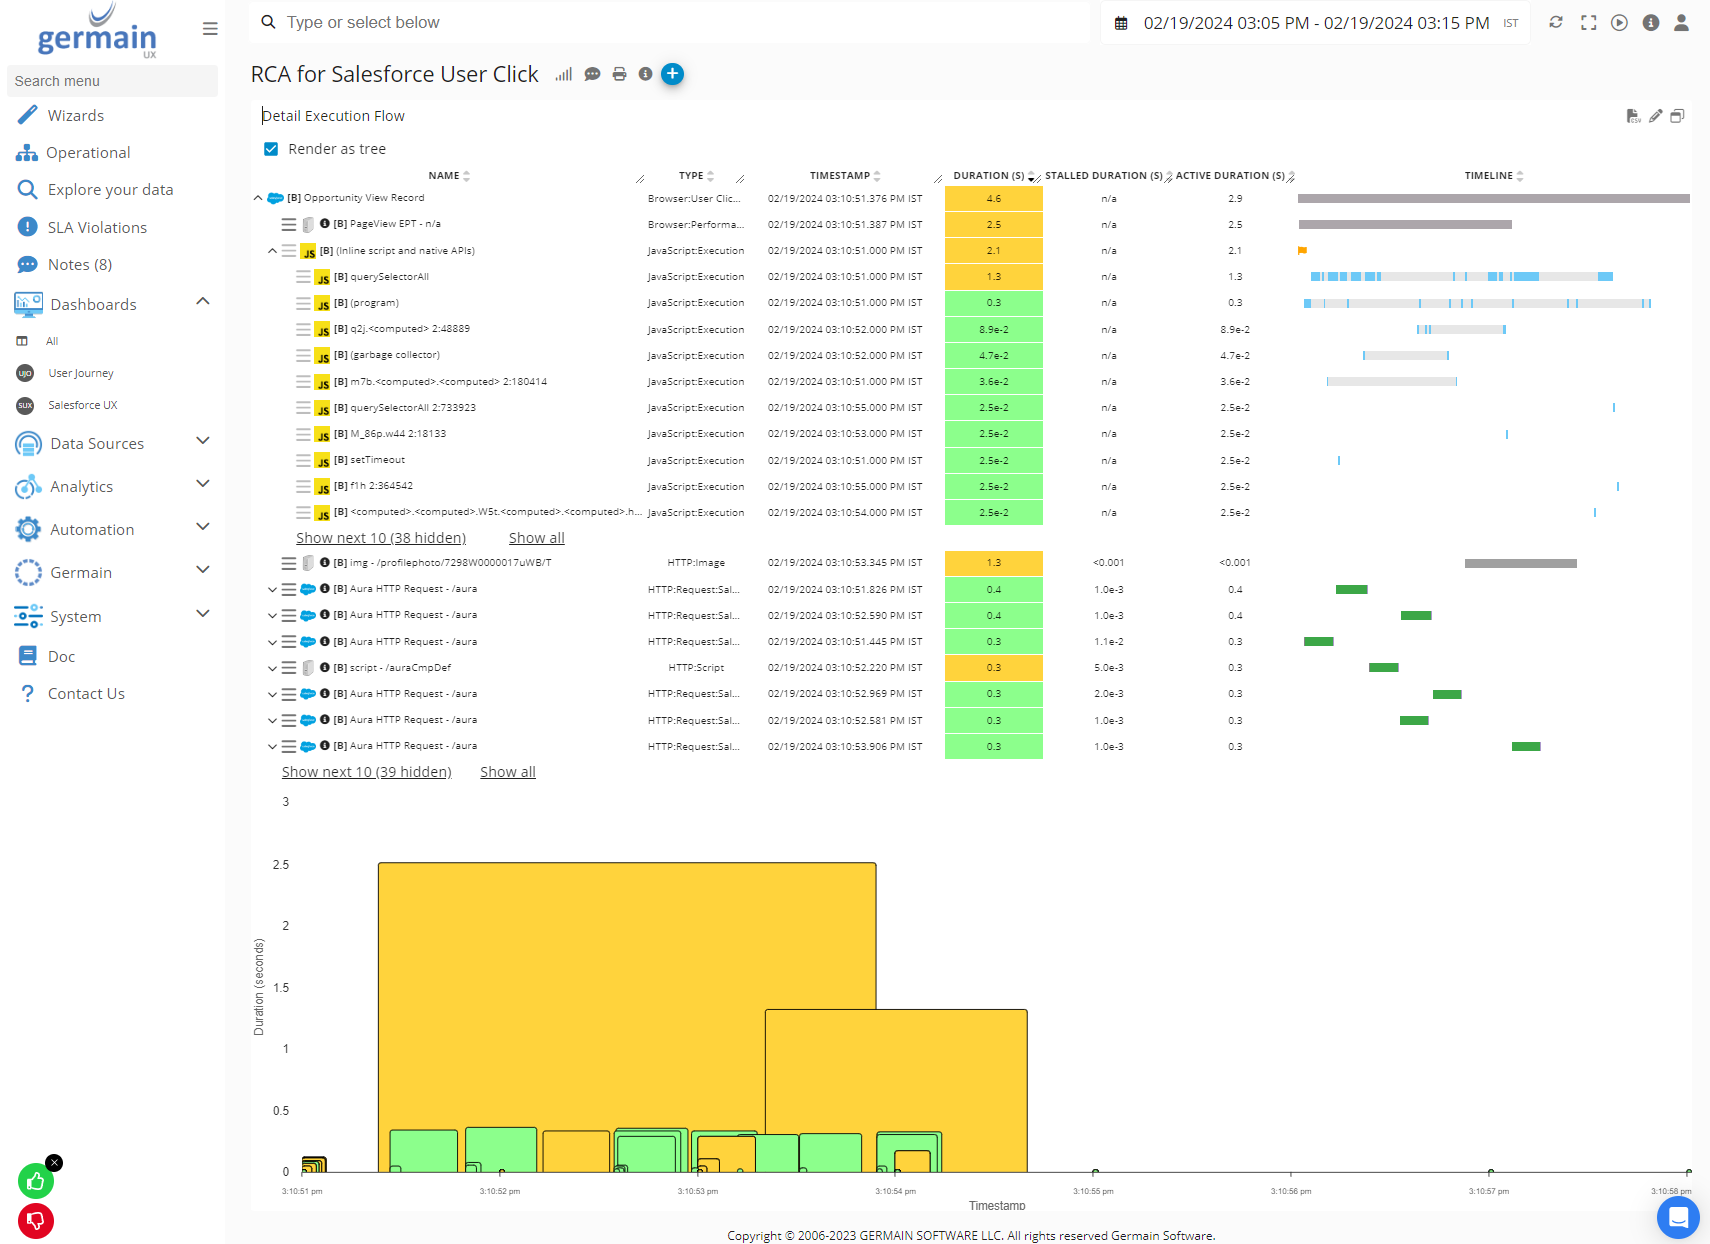
Click Insights (for SFDC)
Monitoring of SFDC User Click and front-to-backend metrics correlation for root-cause analysis (down to the line of Javascript execution), real-time, 24x7.
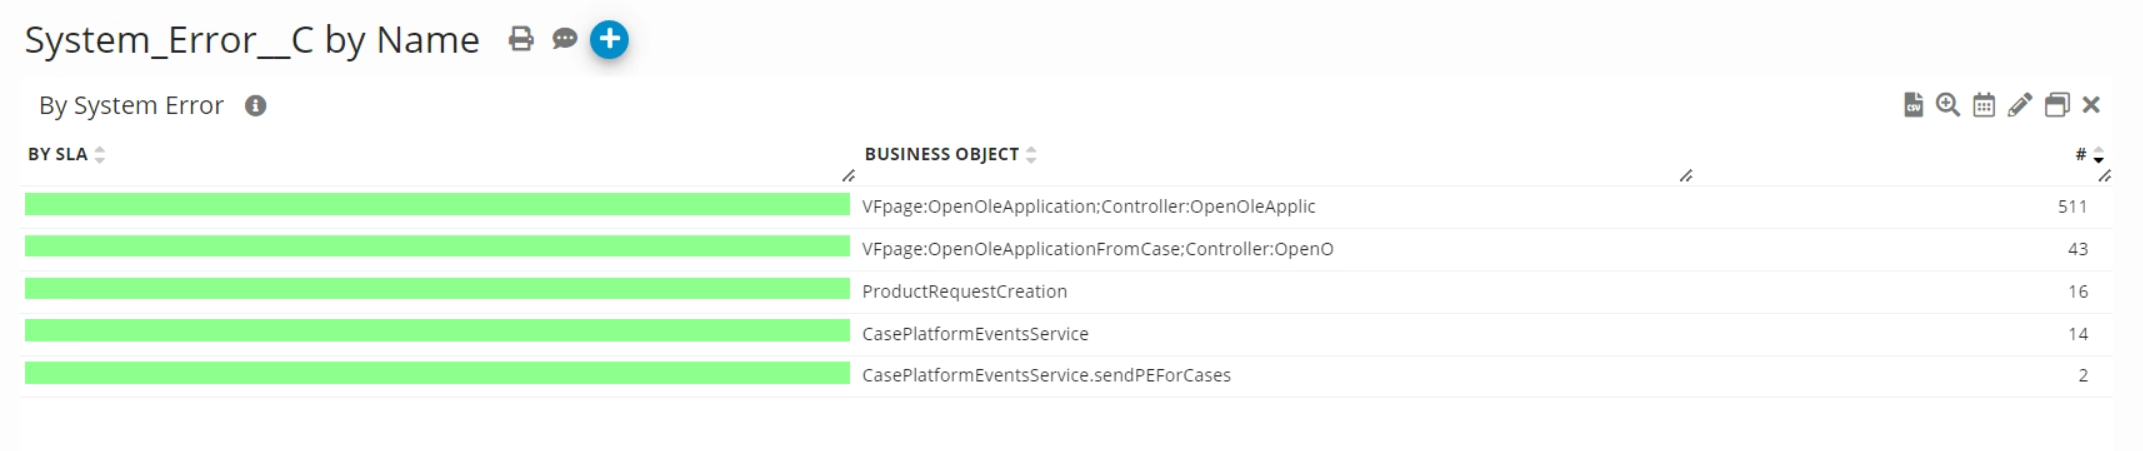
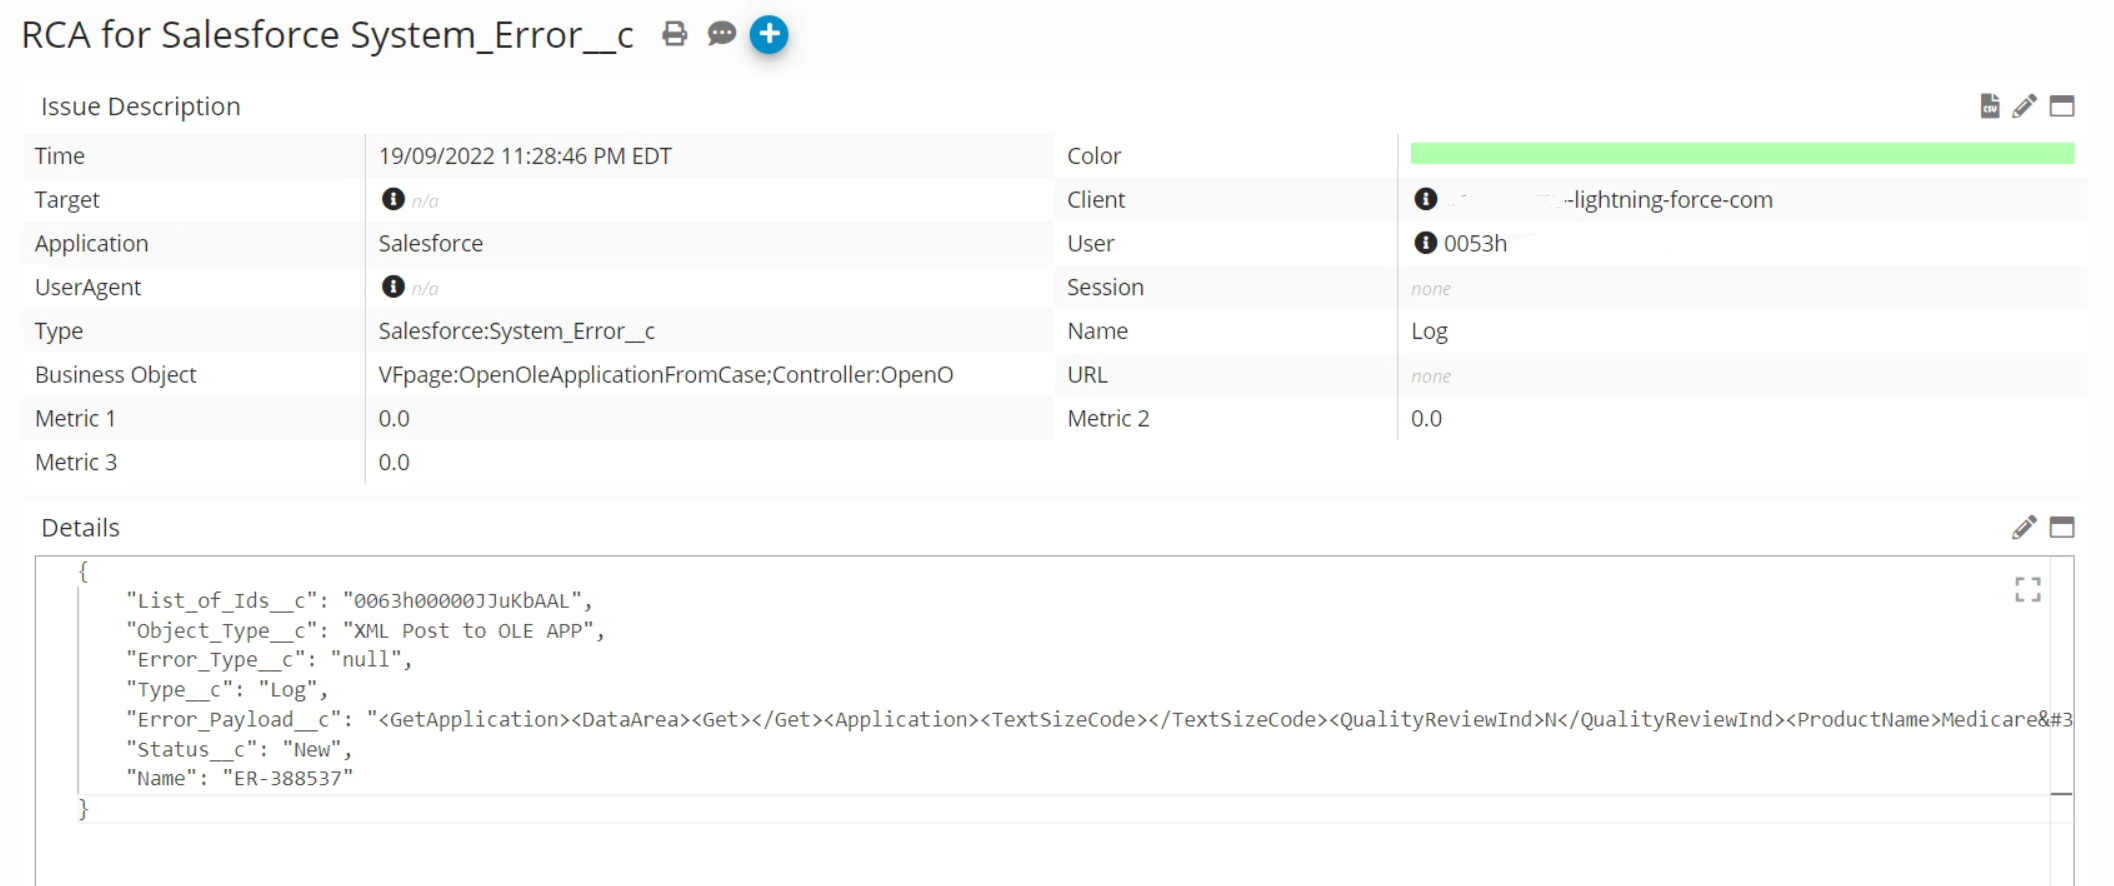
Custom Objects Insights (for SFDC)
For instance, you can use Germain to monitor System_Error__c
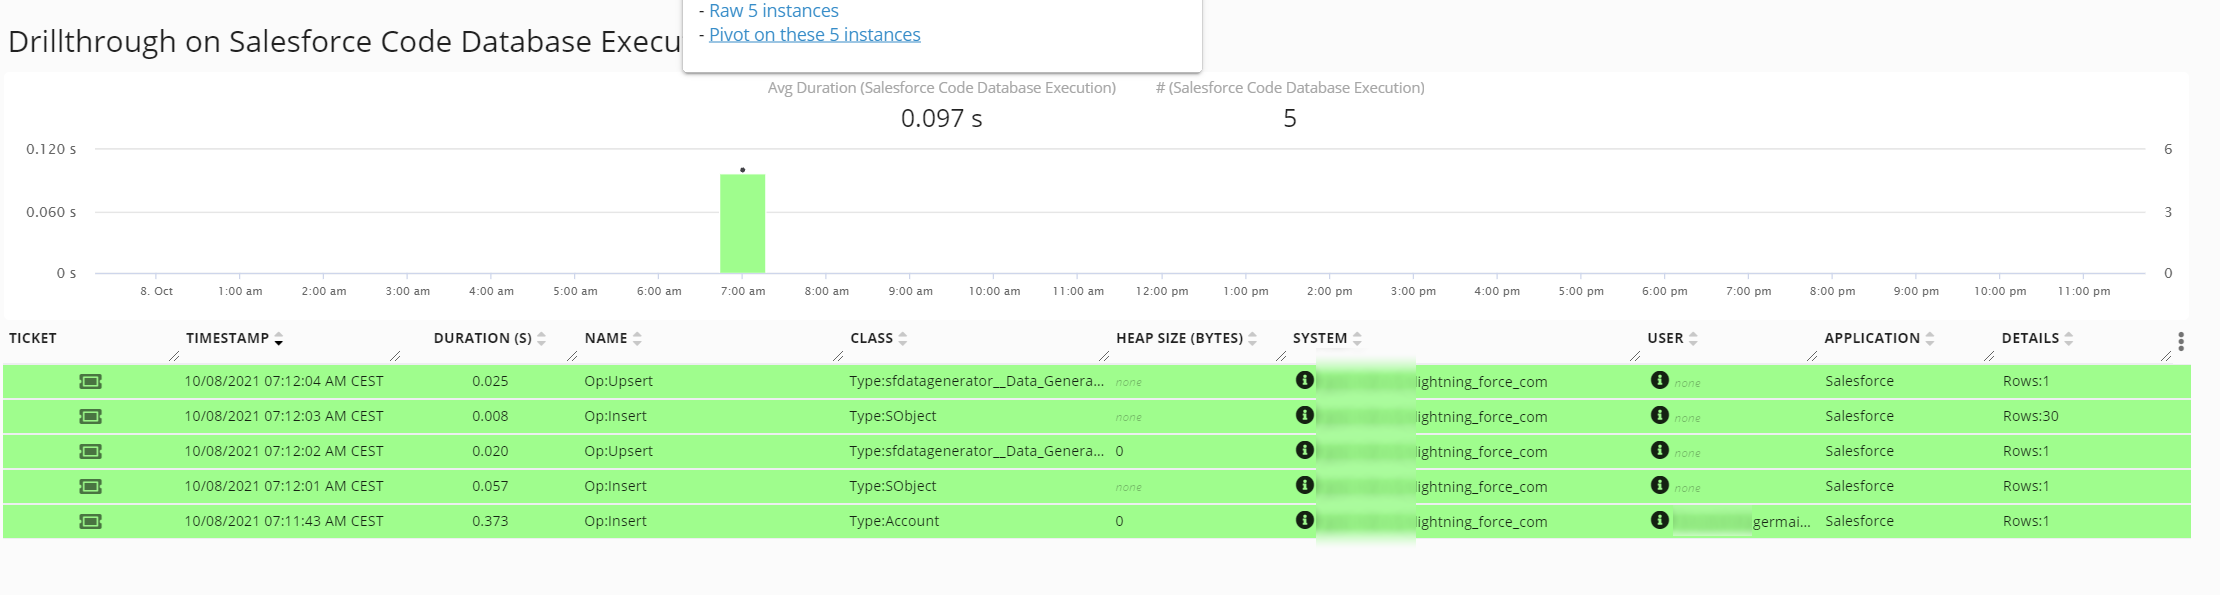
Database Execution Insights (for SFDC)
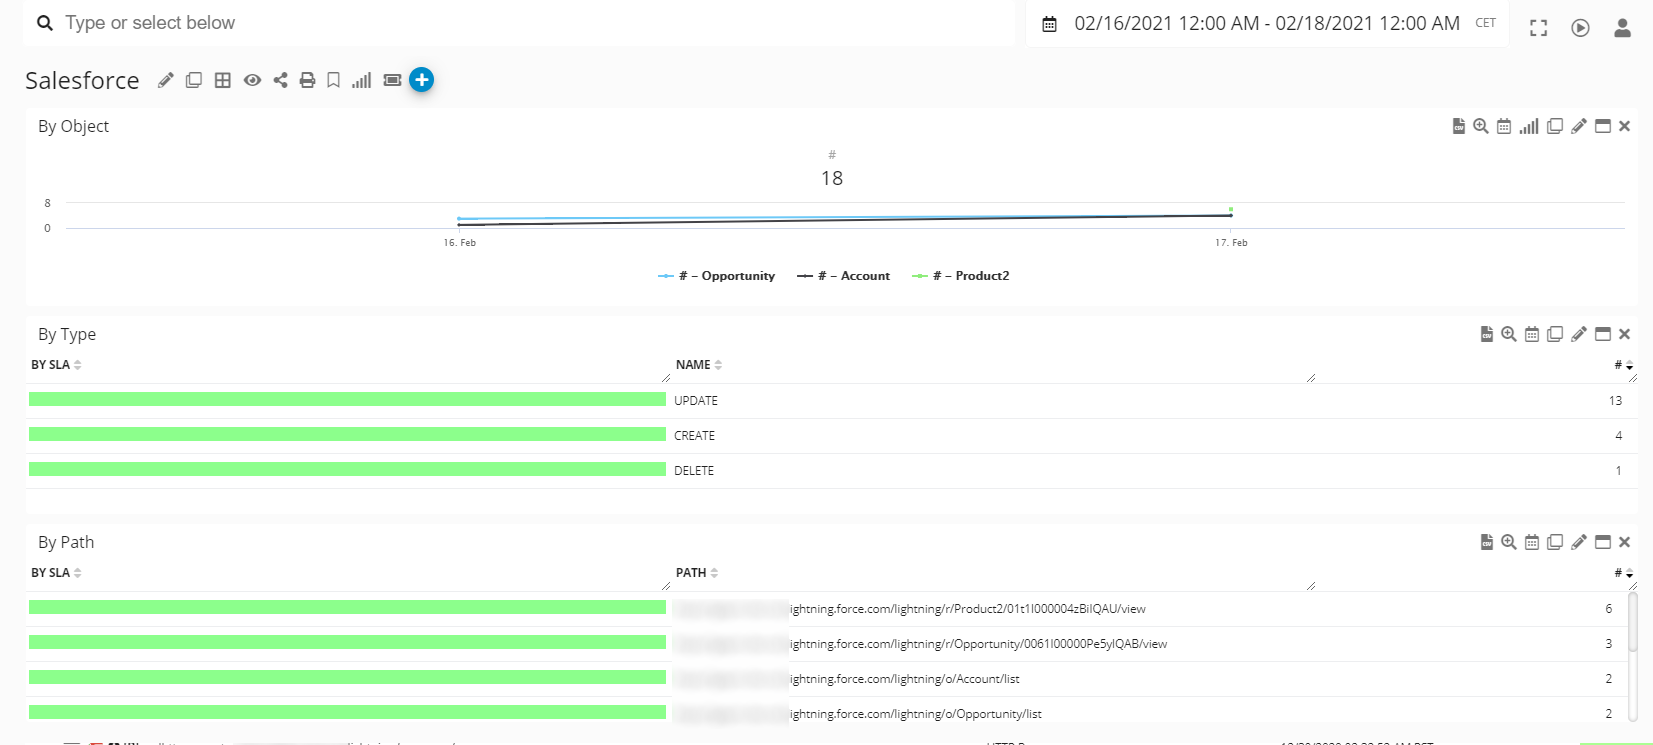
Data Update / Delete / Create Monitoring of SFDC
Monitor SFDC Data (Record Creation, Update, Deletion, Rollback), in real-time, 24x7.
-
Supported only in Salesforce Lightning Experience (Spring '19 or above)
-
Available for standard and custom objects - More details on Change Event Object Support.
-
Salesforce License allocations apply - More details on Change Data Capture Allocations.
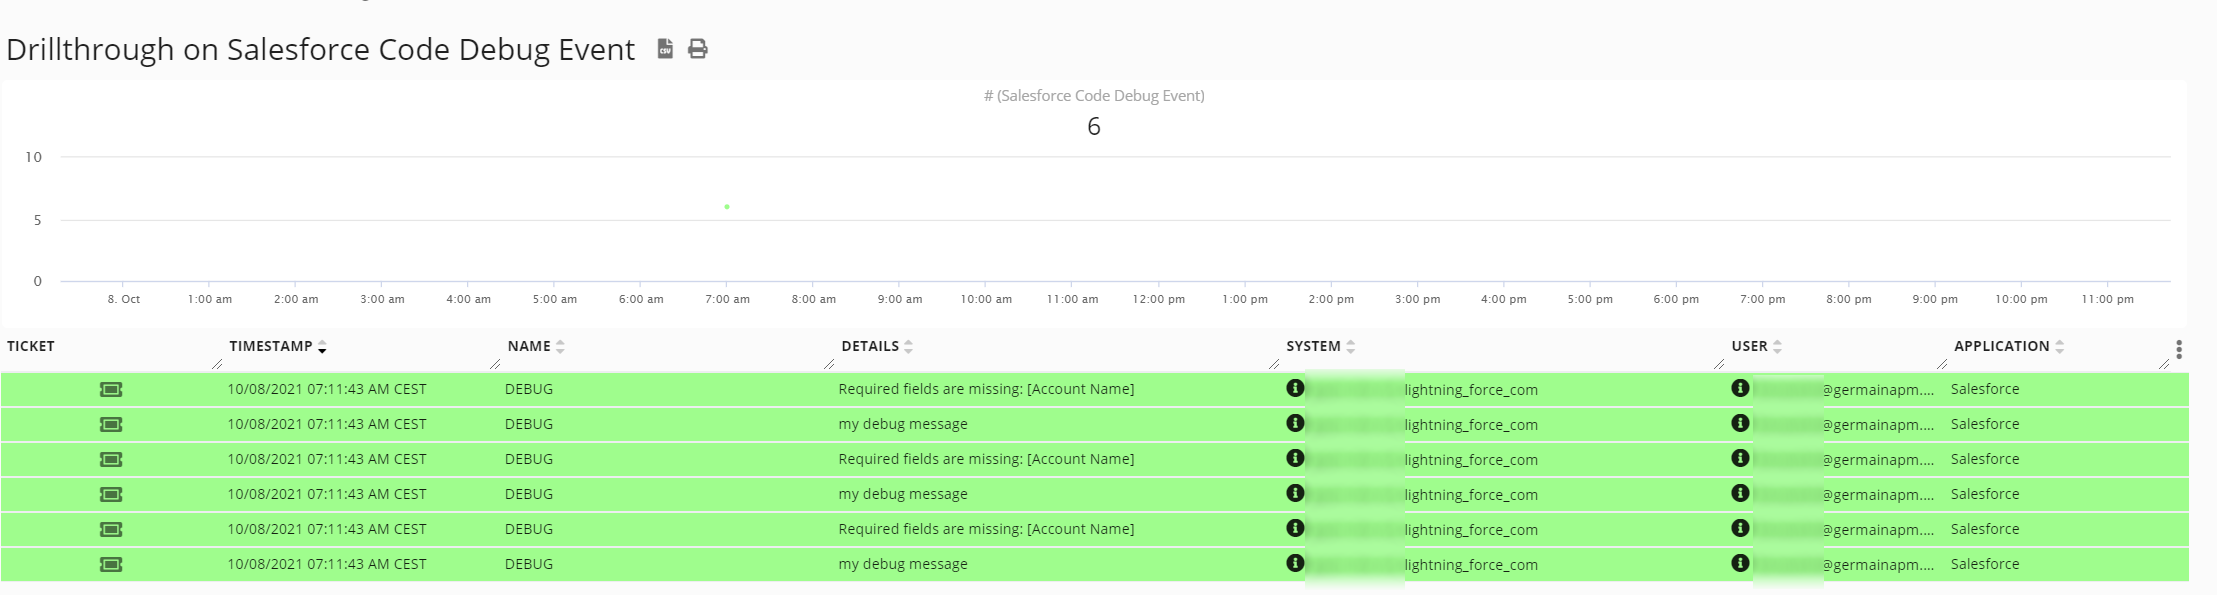
Debug Log Insights (for SFDC)
Monitor of SFDC Log, in real-time, 24x7
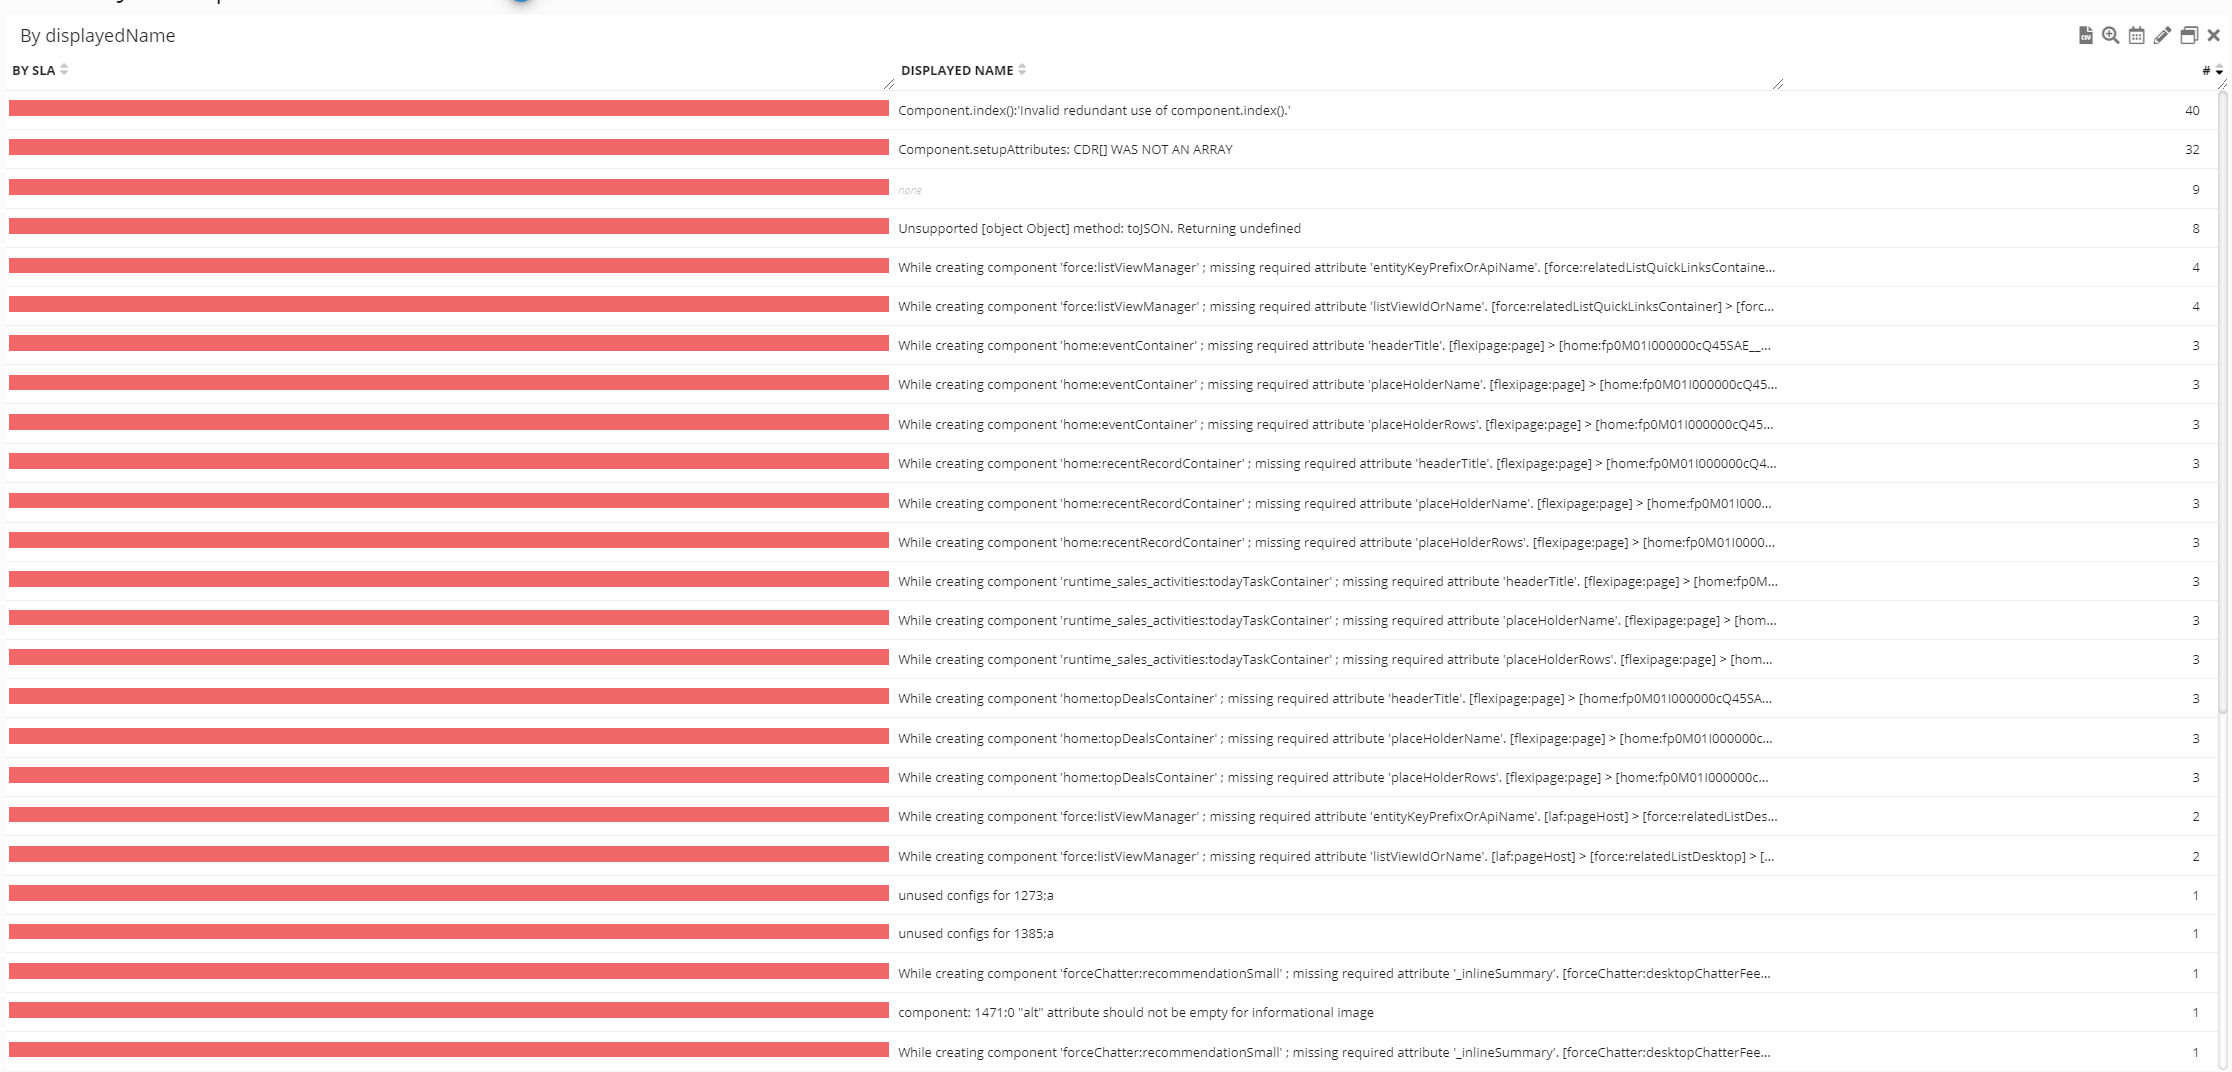
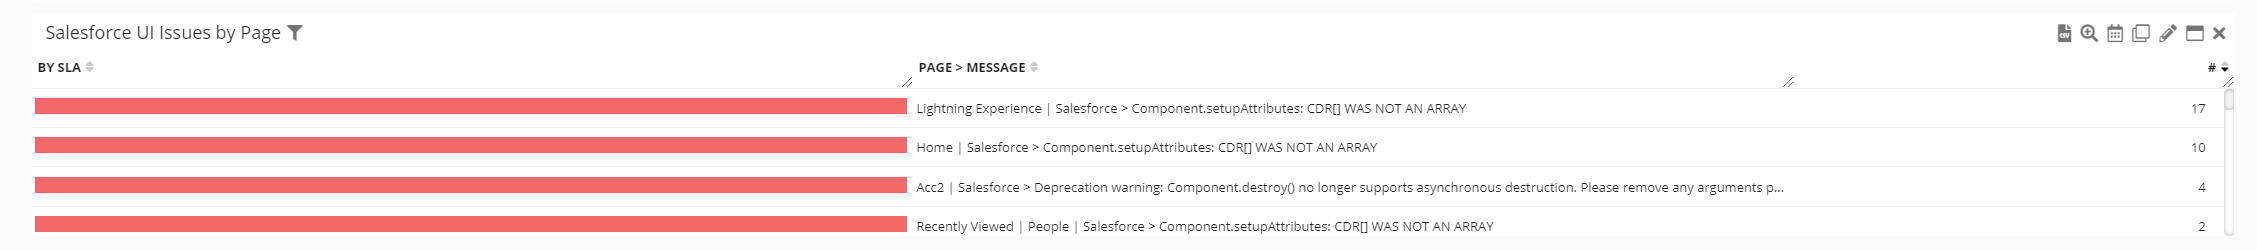
Error Insights (for SFDC)
-
Errors that Affect Business
Identify Errors that matter i.e. that affect Users or Business Operations and place a lower priority for the rest, near real-time, 24x7. More details on how to .
-
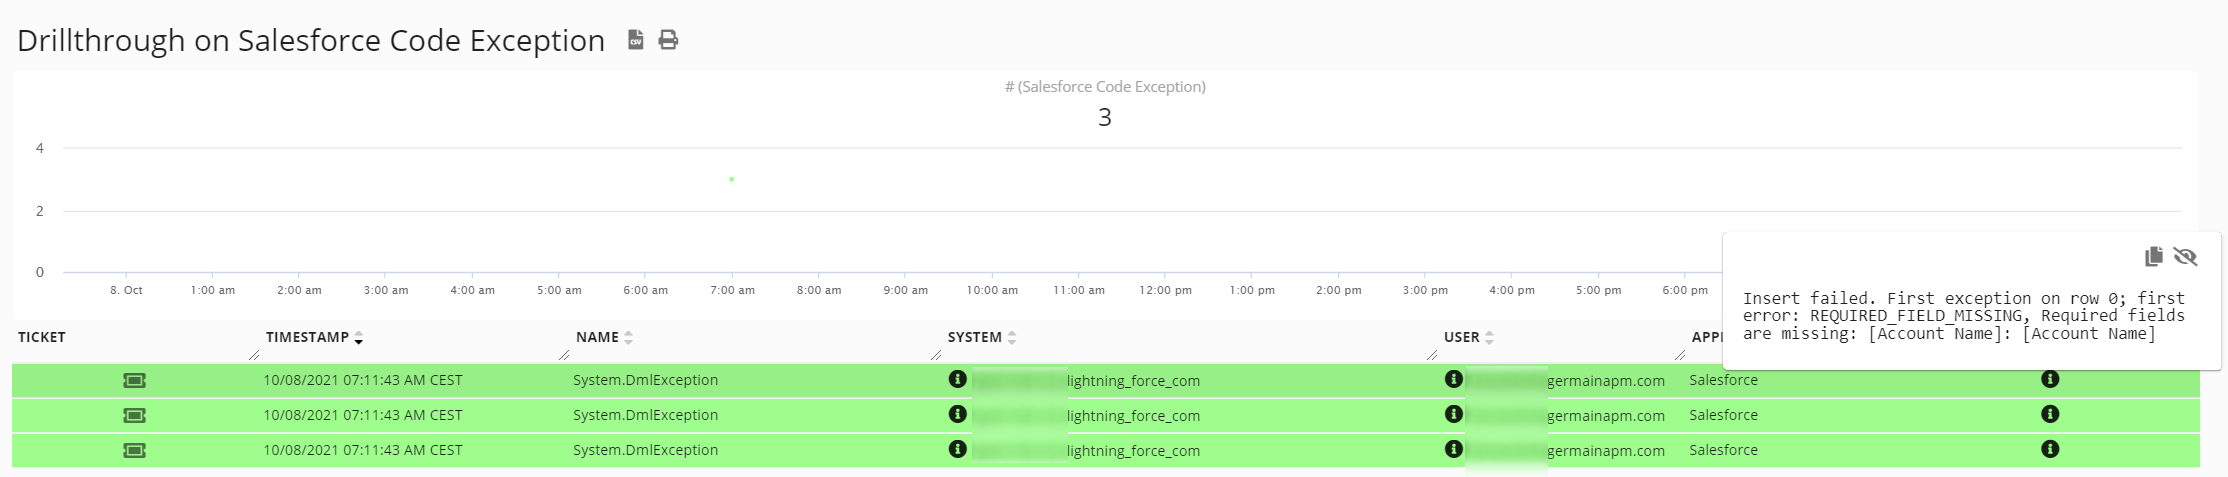
Apex Error
Monitoring of SFDC Apex Error, real-time, 24x7.
-
Developer Error
Monitoring of SFDC Error, real-time, 24x7.
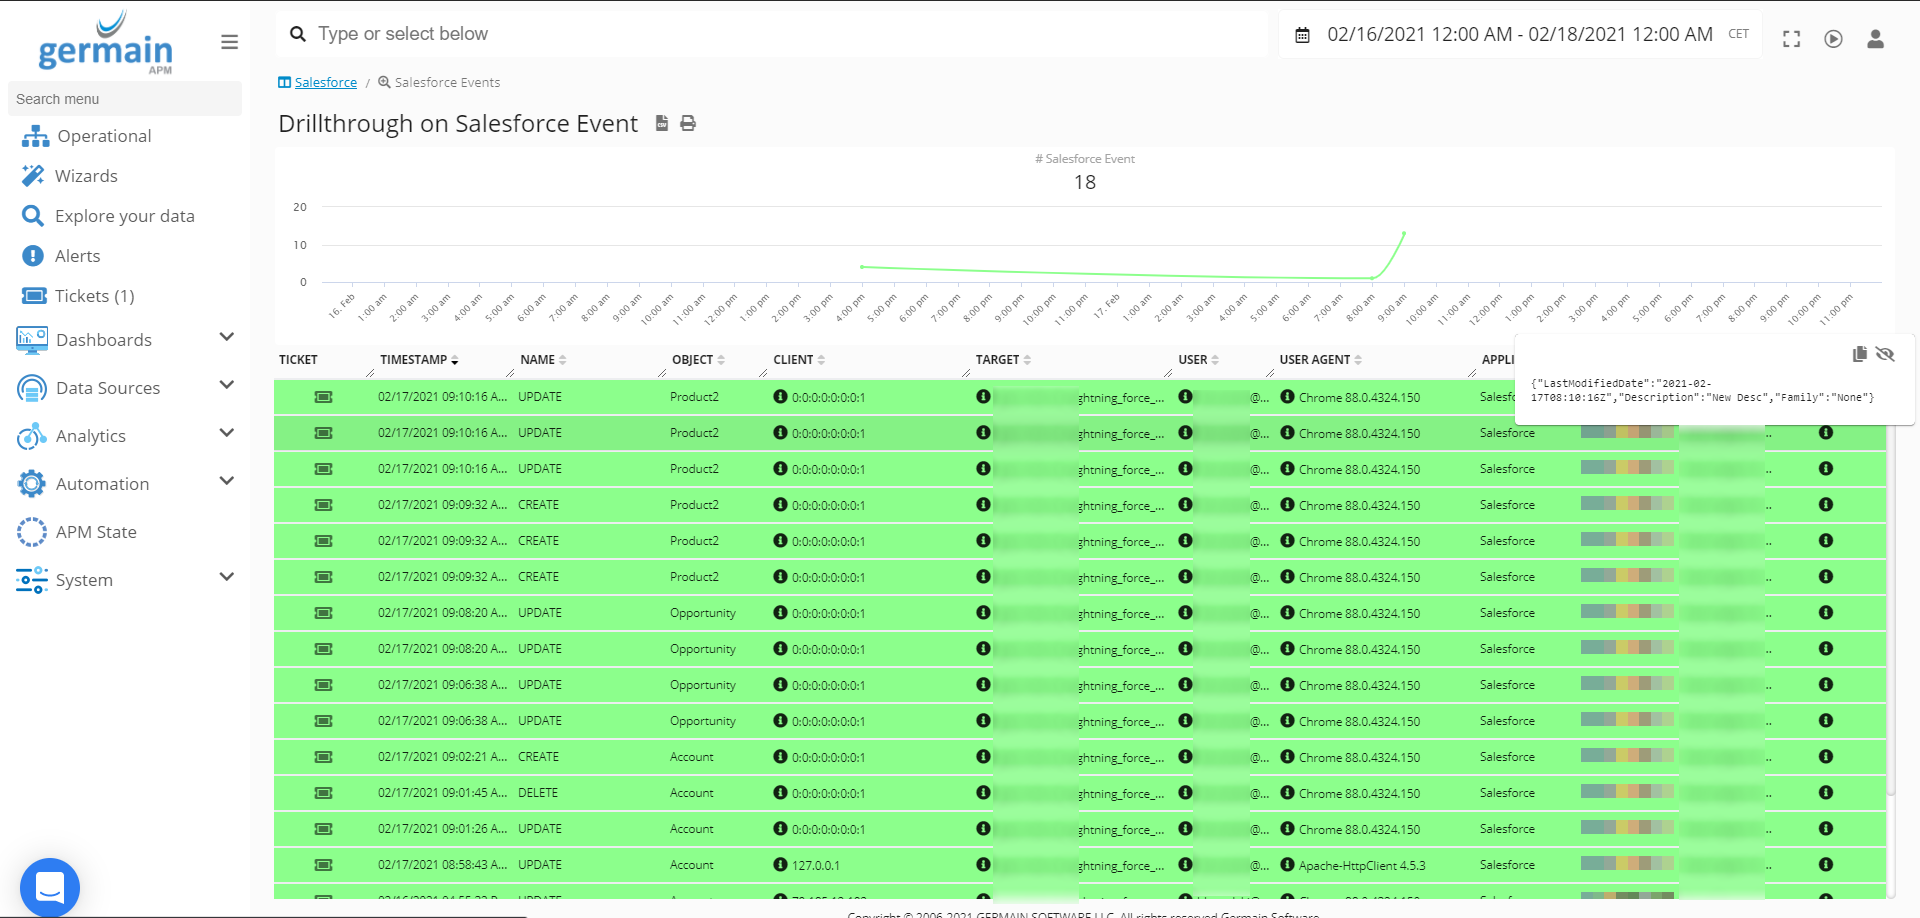
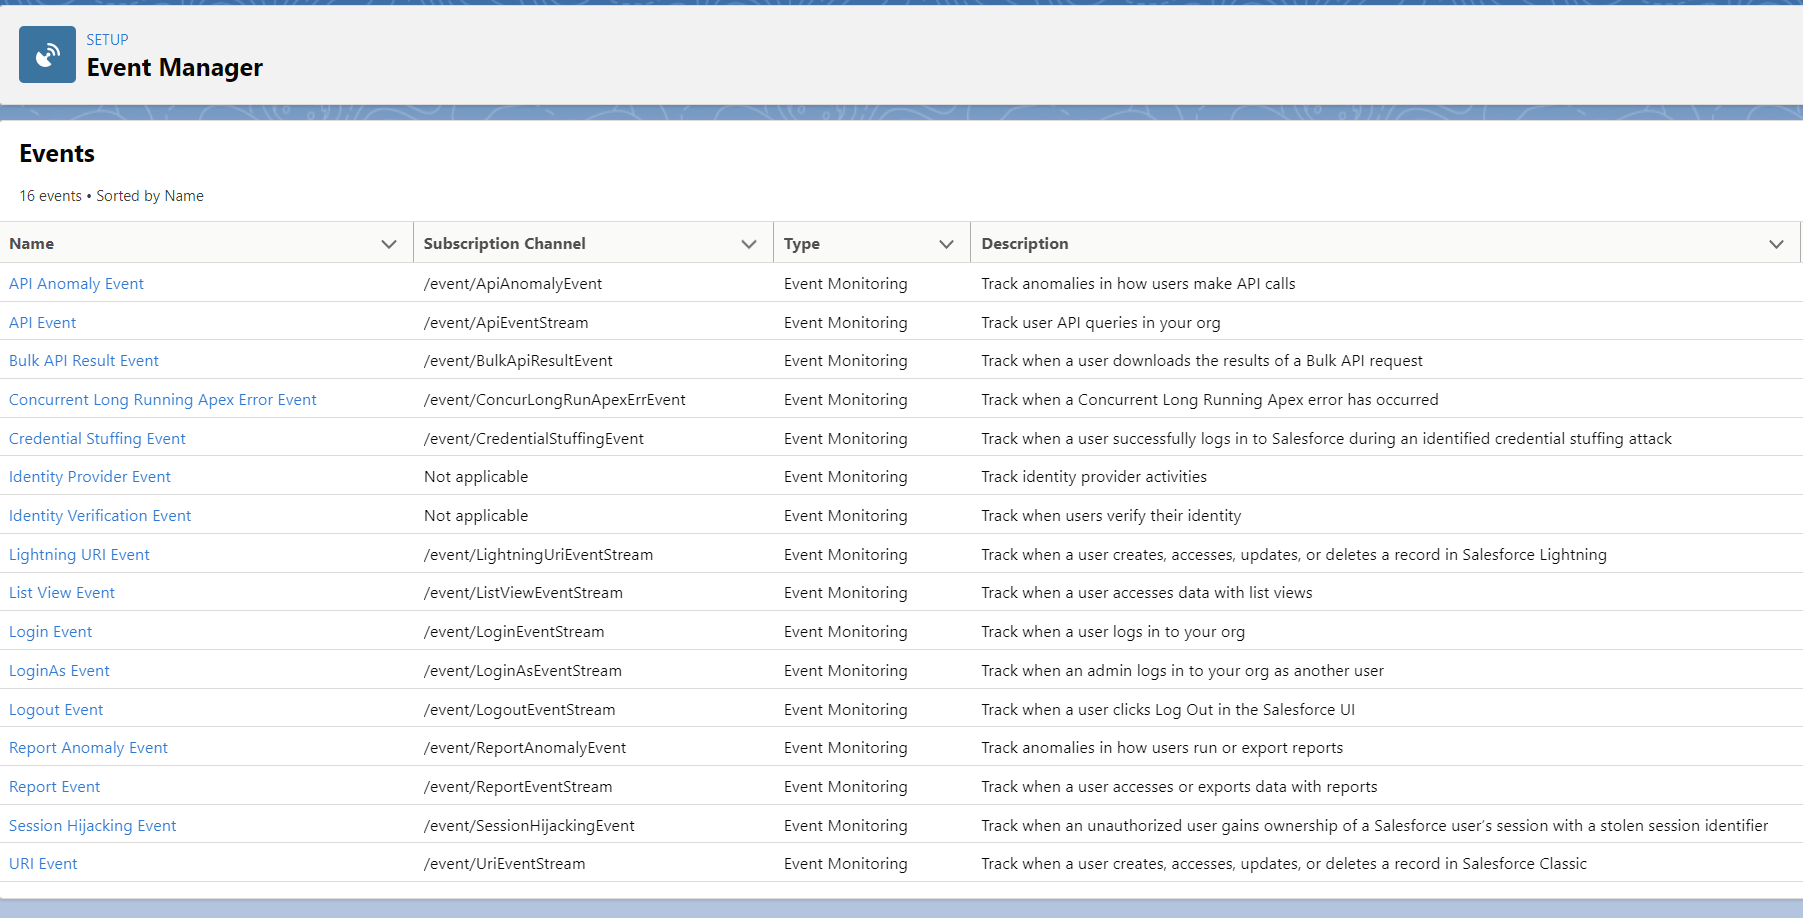
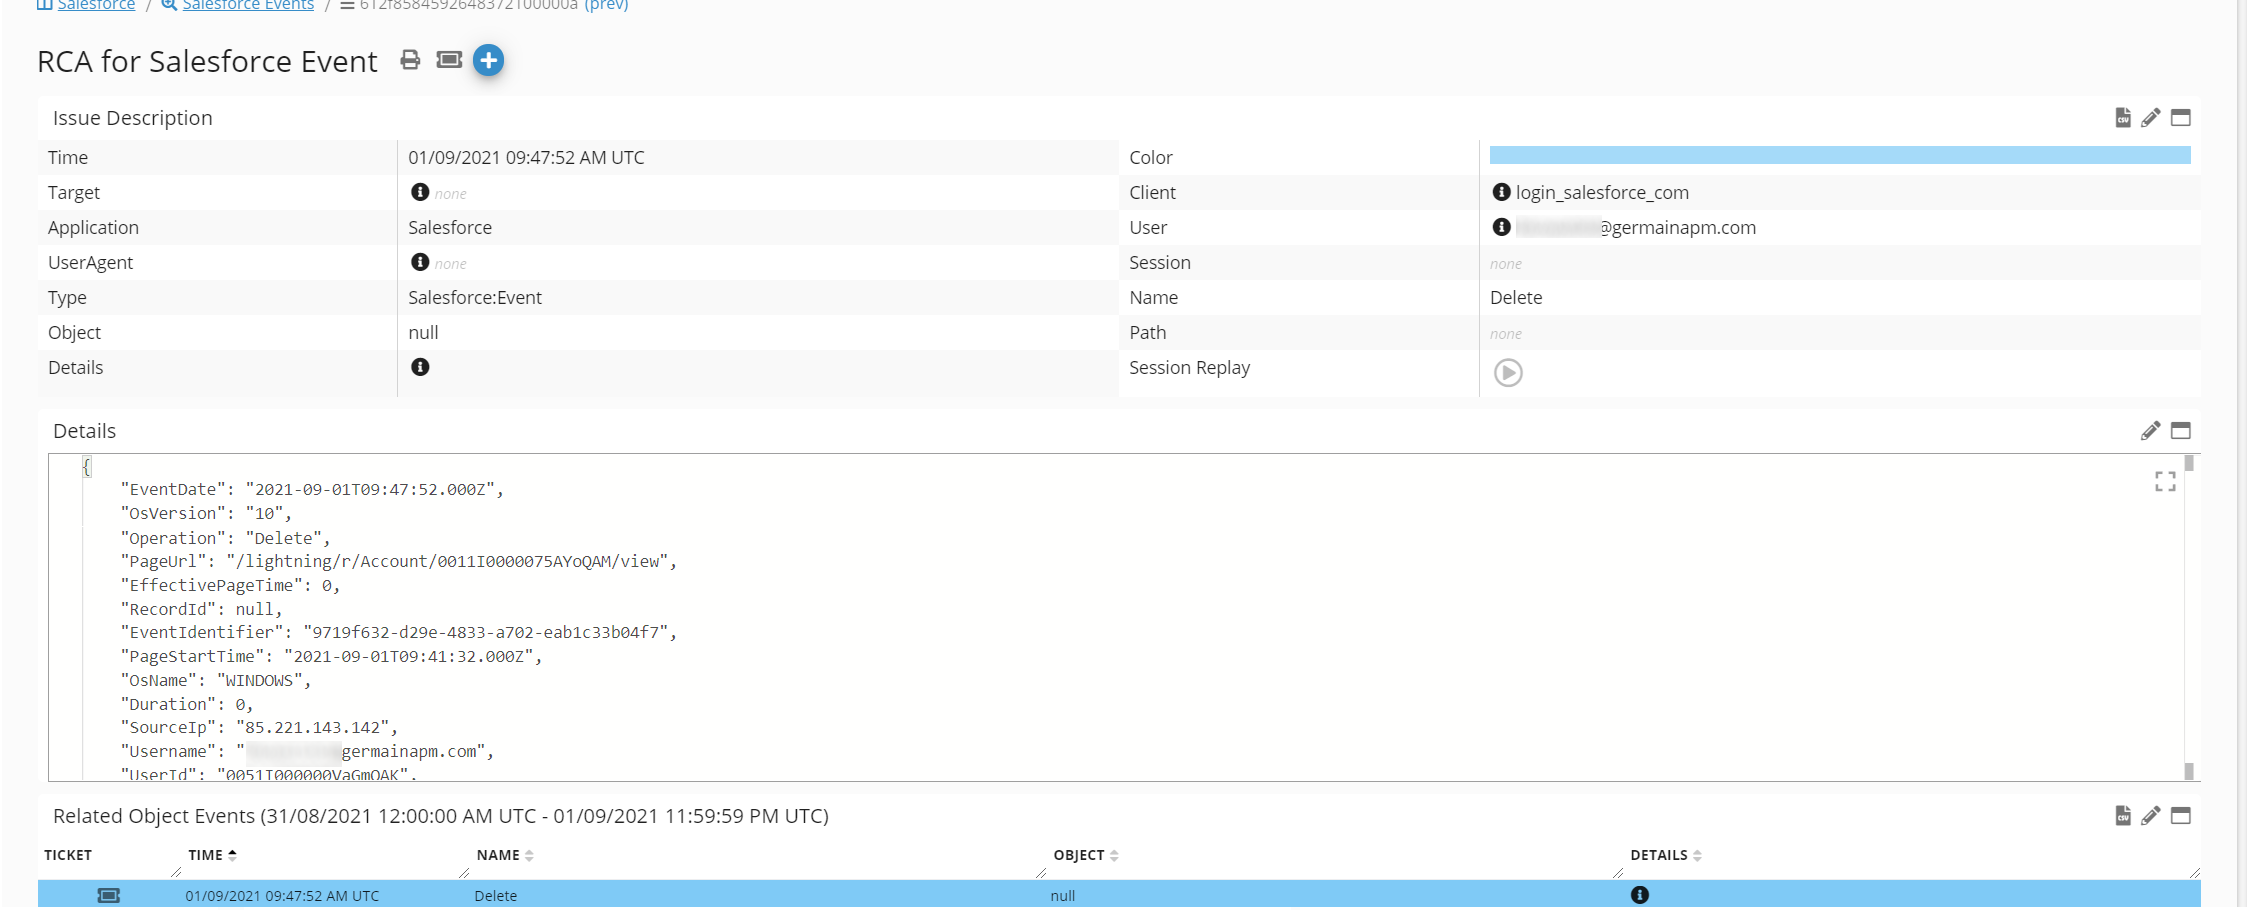
Event Monitoring (SFDC)
Monitoring of SFDC Event, real-time, 24x7.
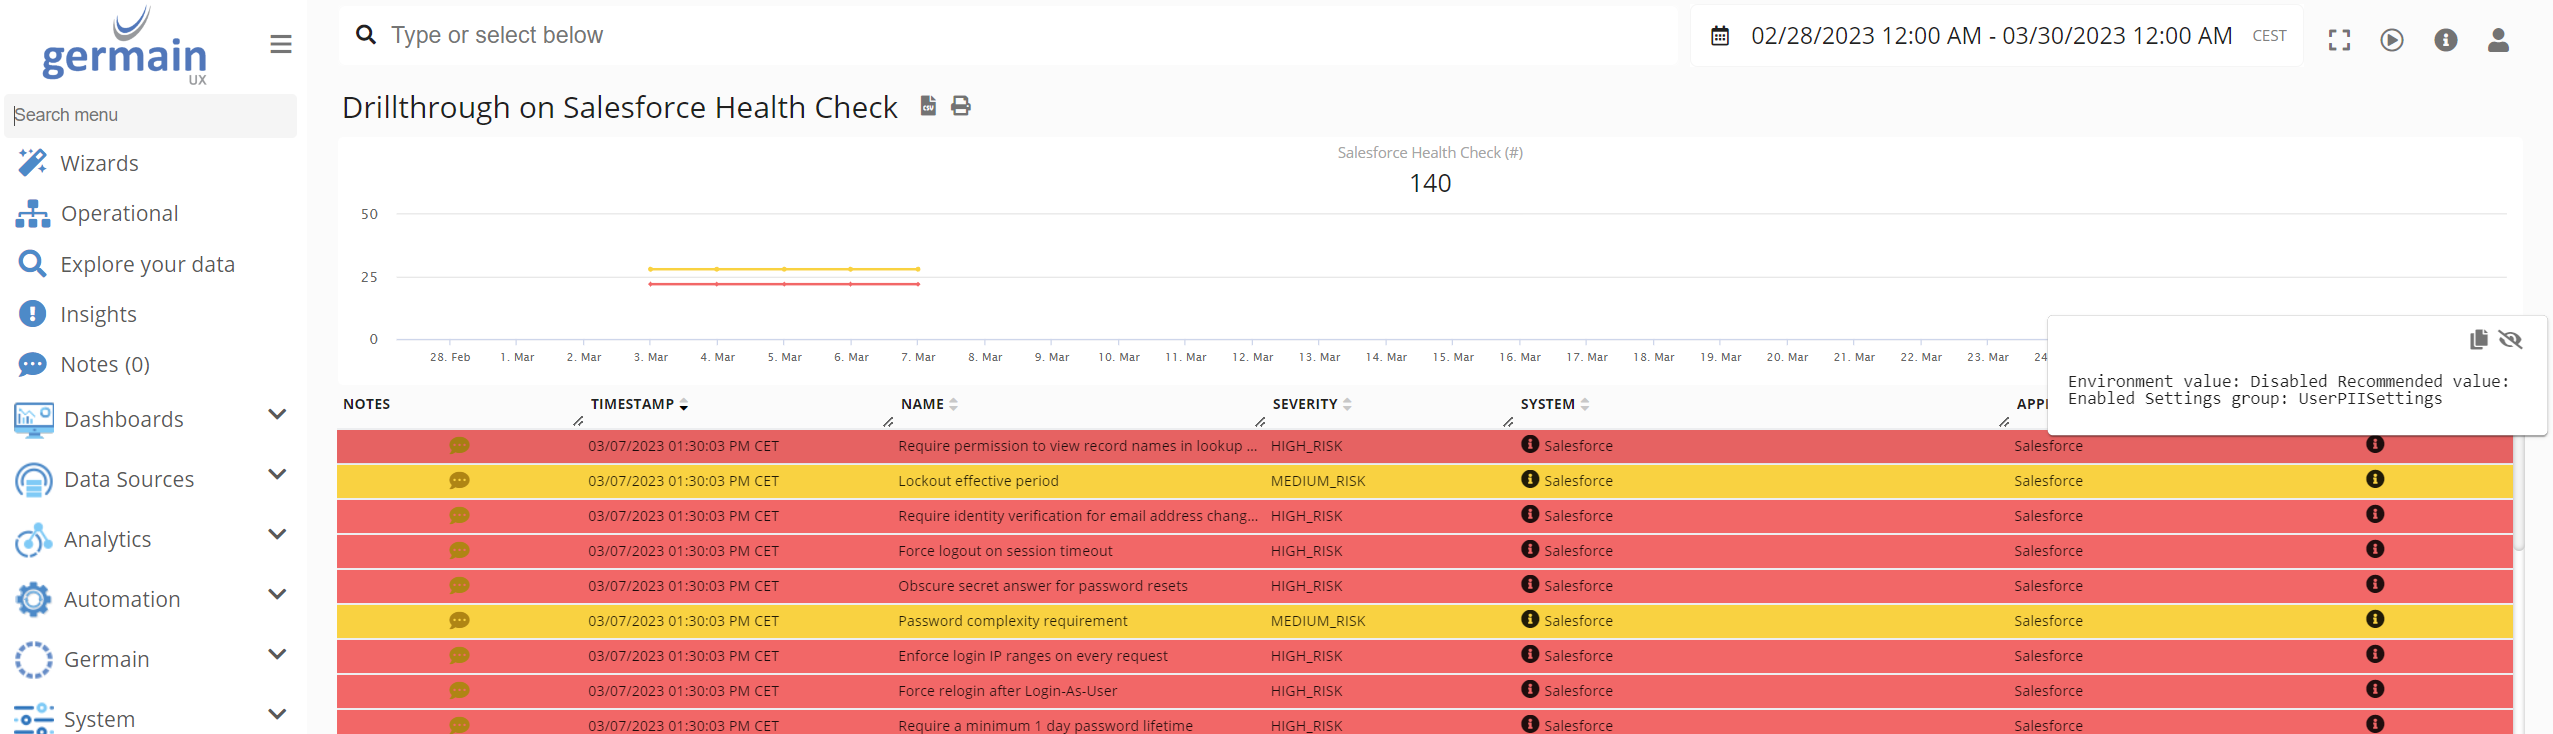
Health Check metrics (SFDC)
Monitoring of SFDC Security Health Check.
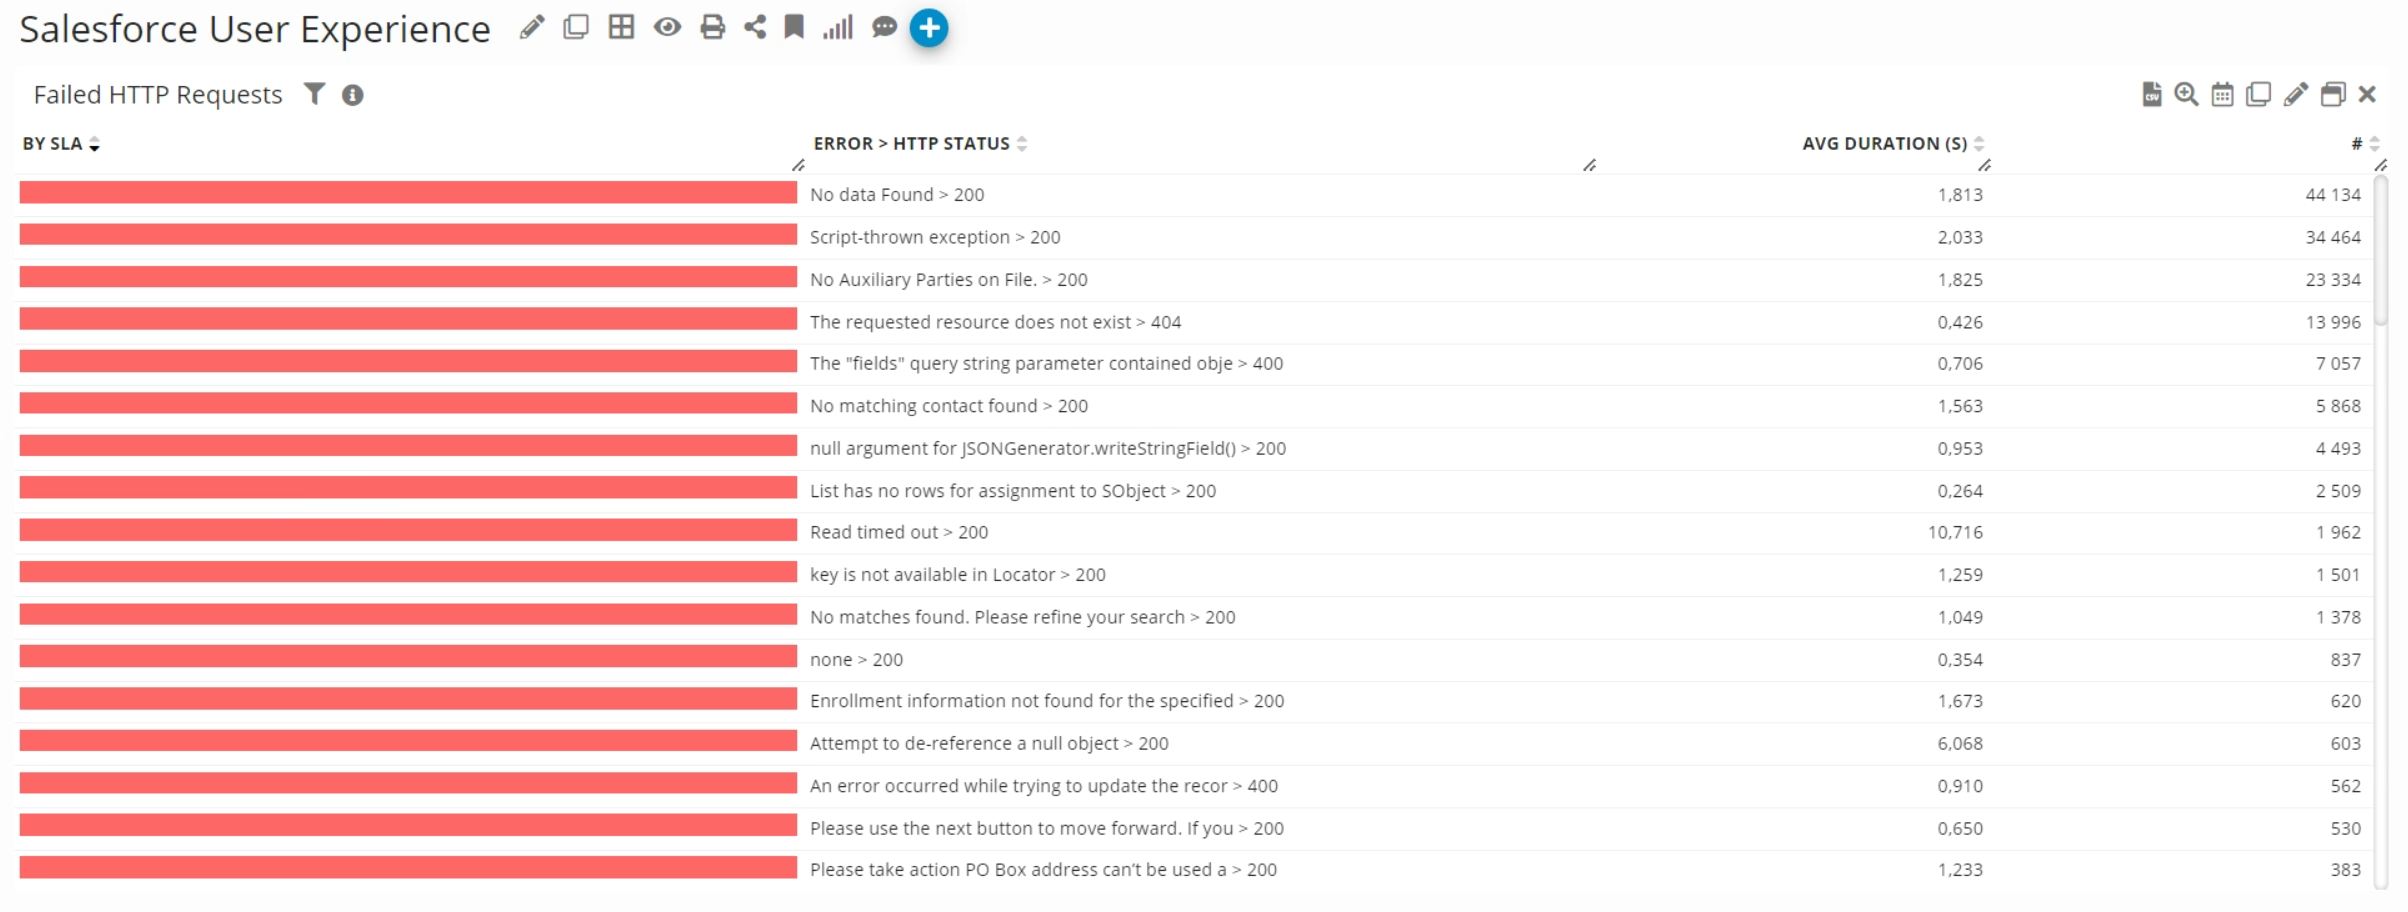
HTTP Requests processed (by SFDC)
Monitoring of SFDC Failed HTTP Requests, real-time, 24x7. Example here showing failed http requests:
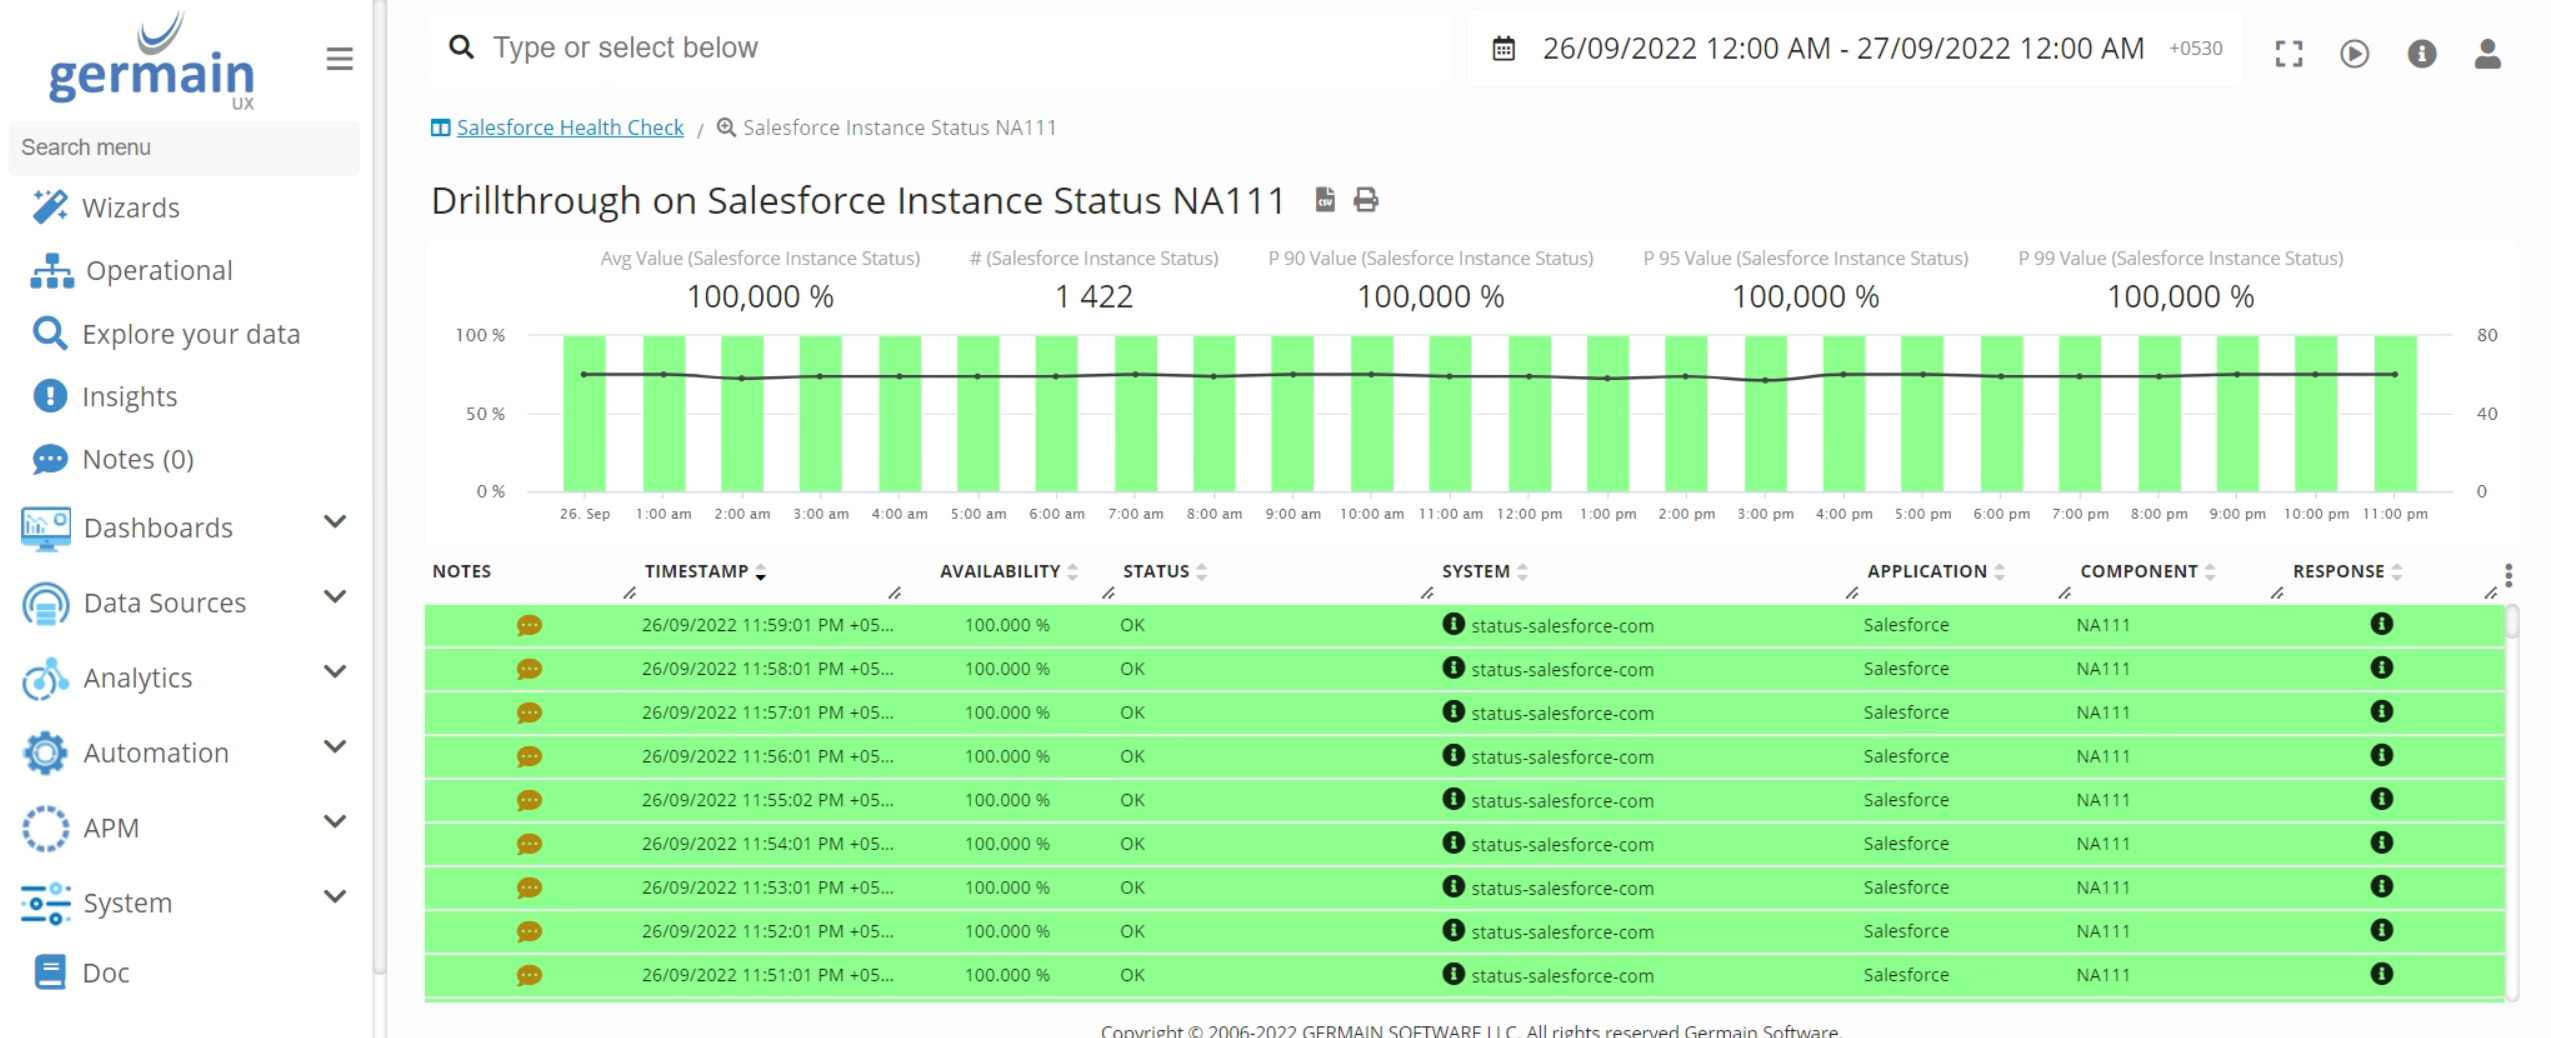
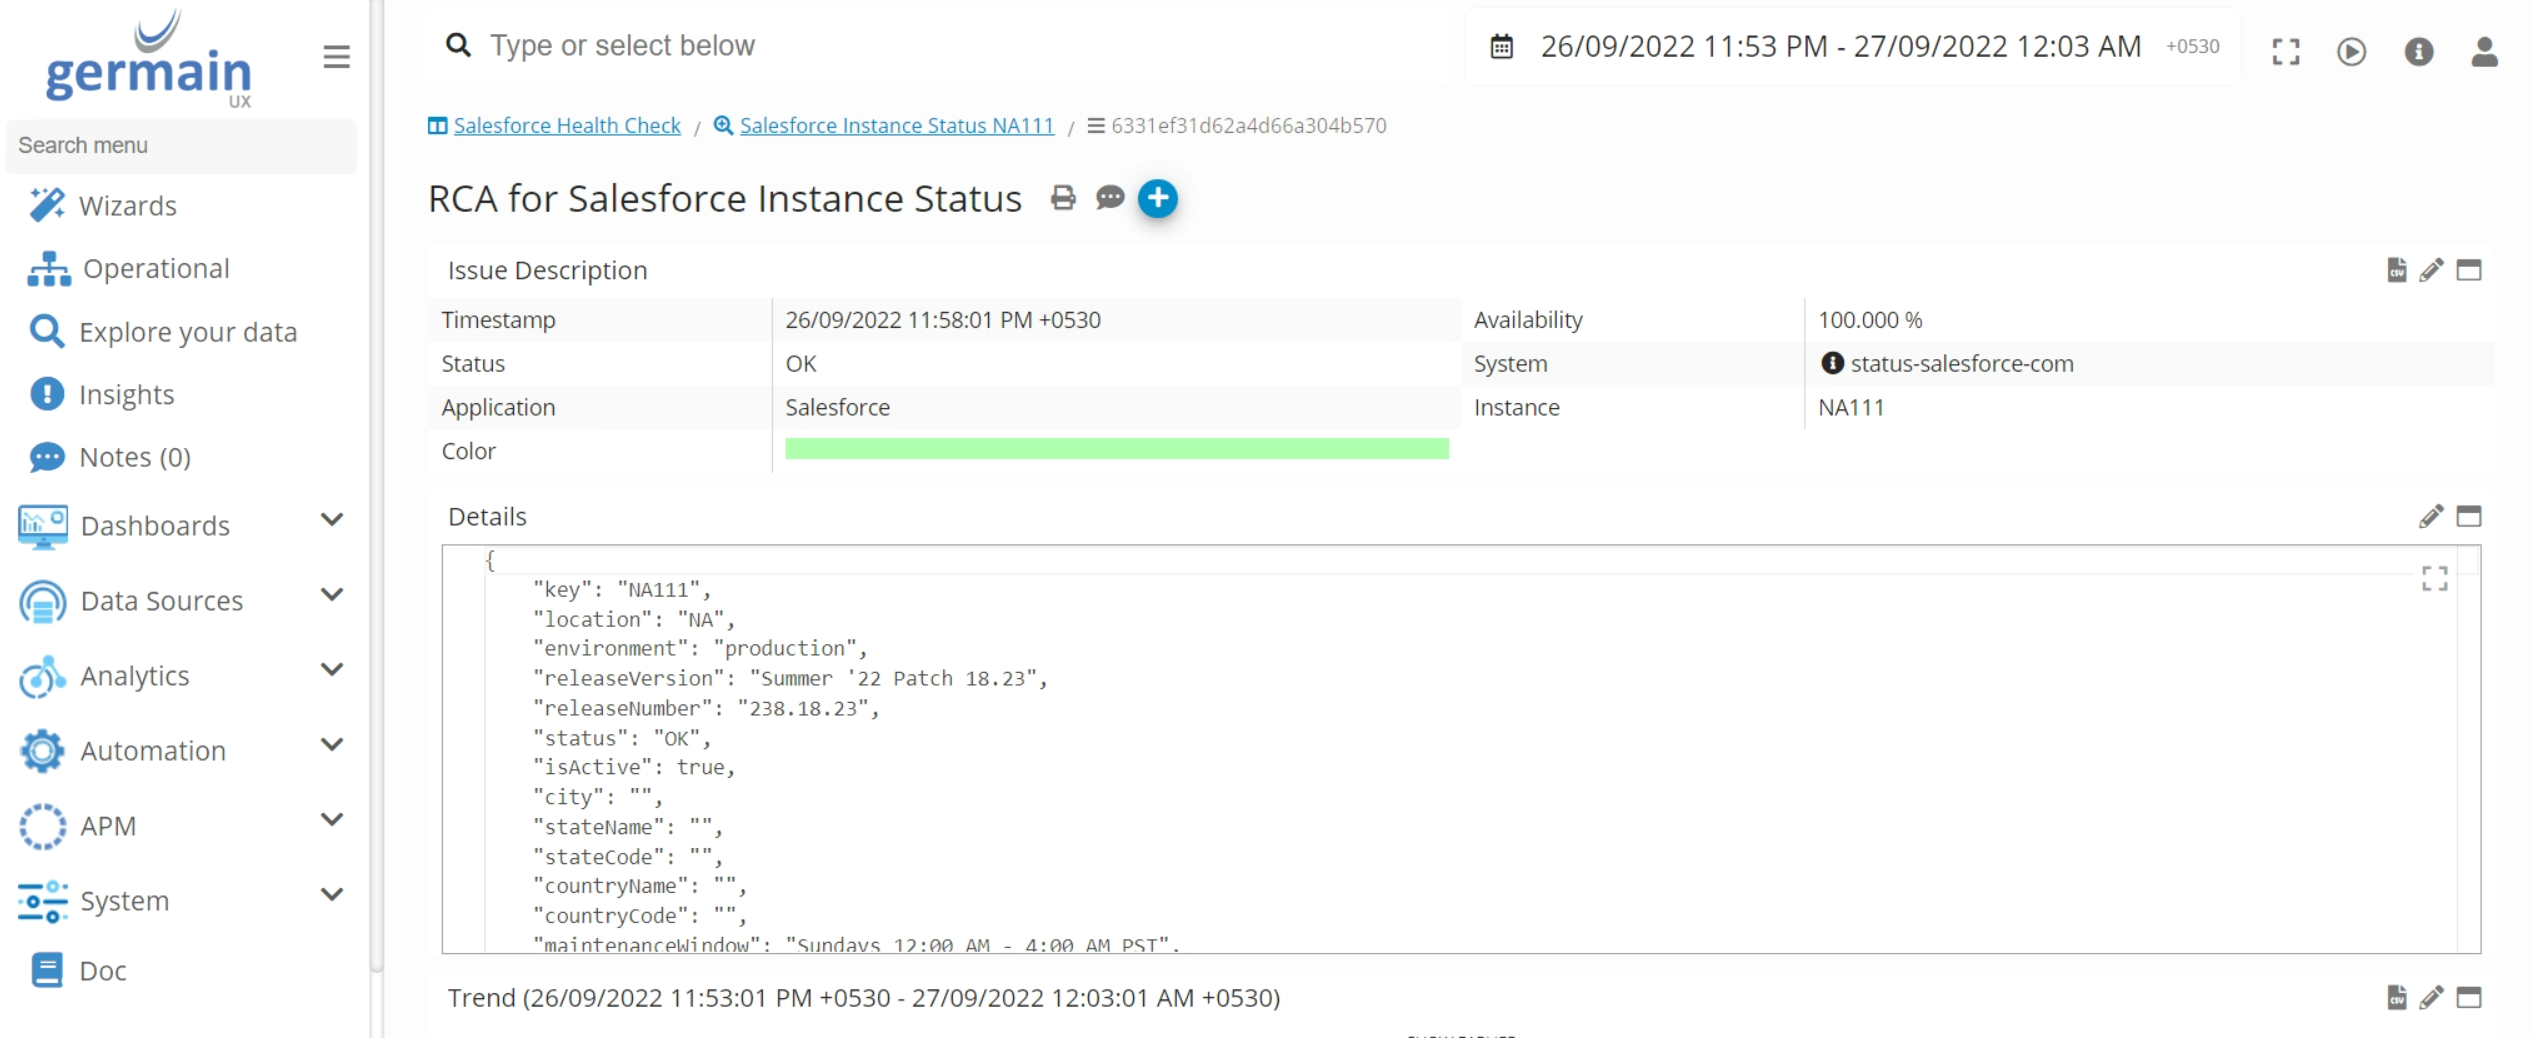
Instance Status Monitoring for SFDC
Monitoring of SFDC Instance Status, real-time, 24x7.
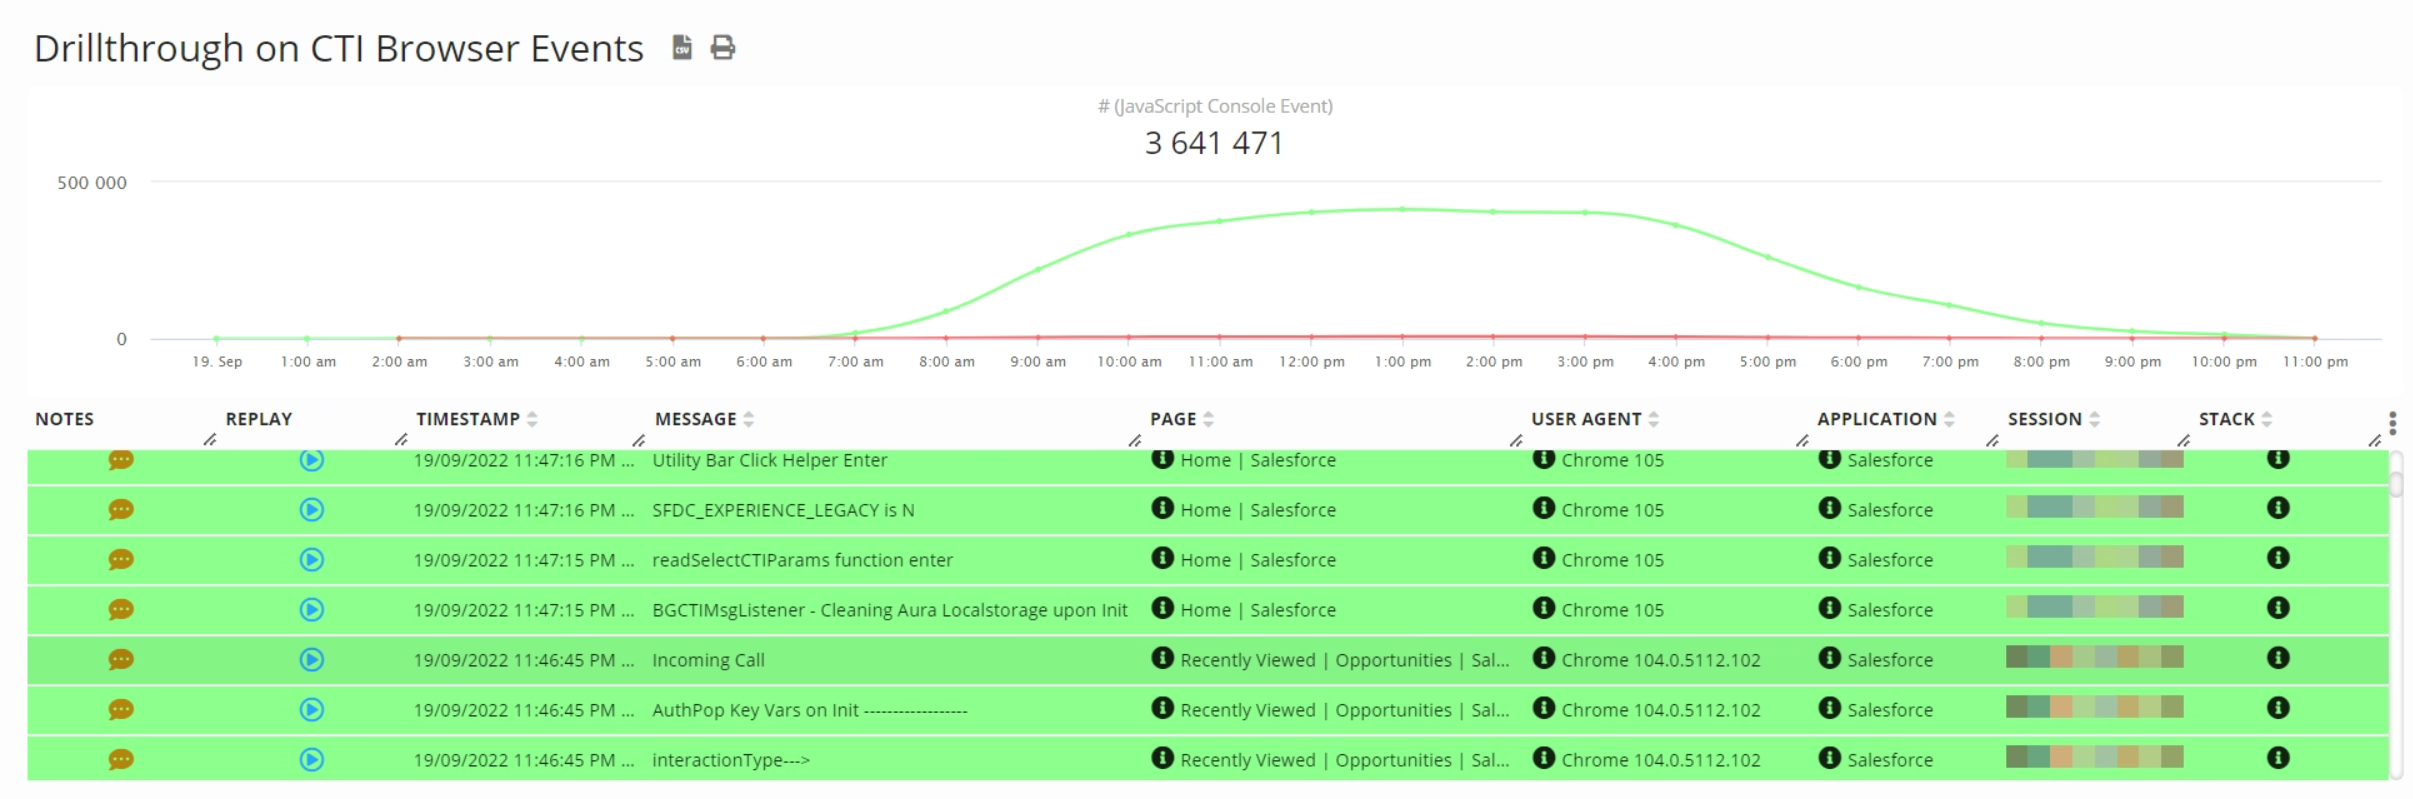
Integration Insights (SFDC)
Germain UX provides real-time, 24/7 monitoring of SFDC integrations, such as CTI and Chat. Some examples:
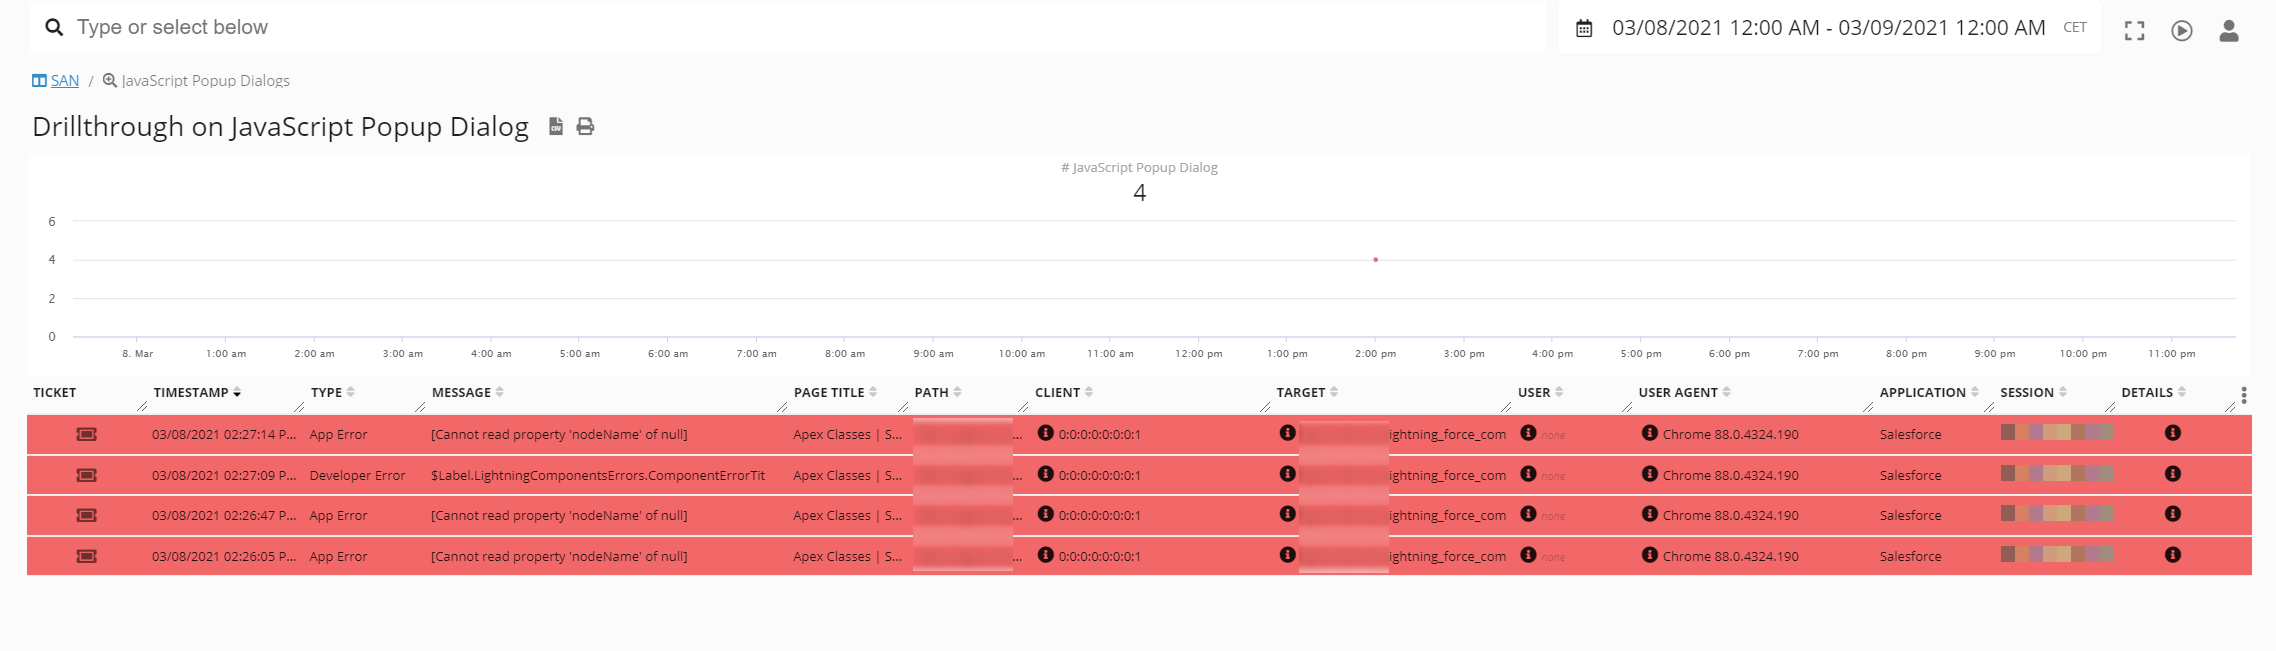
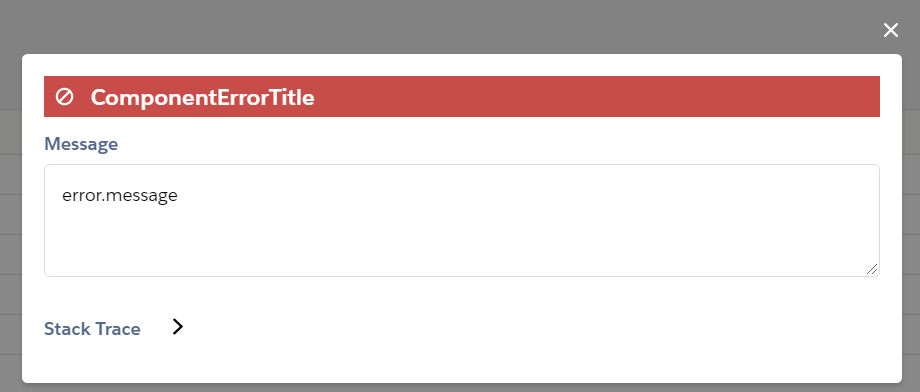
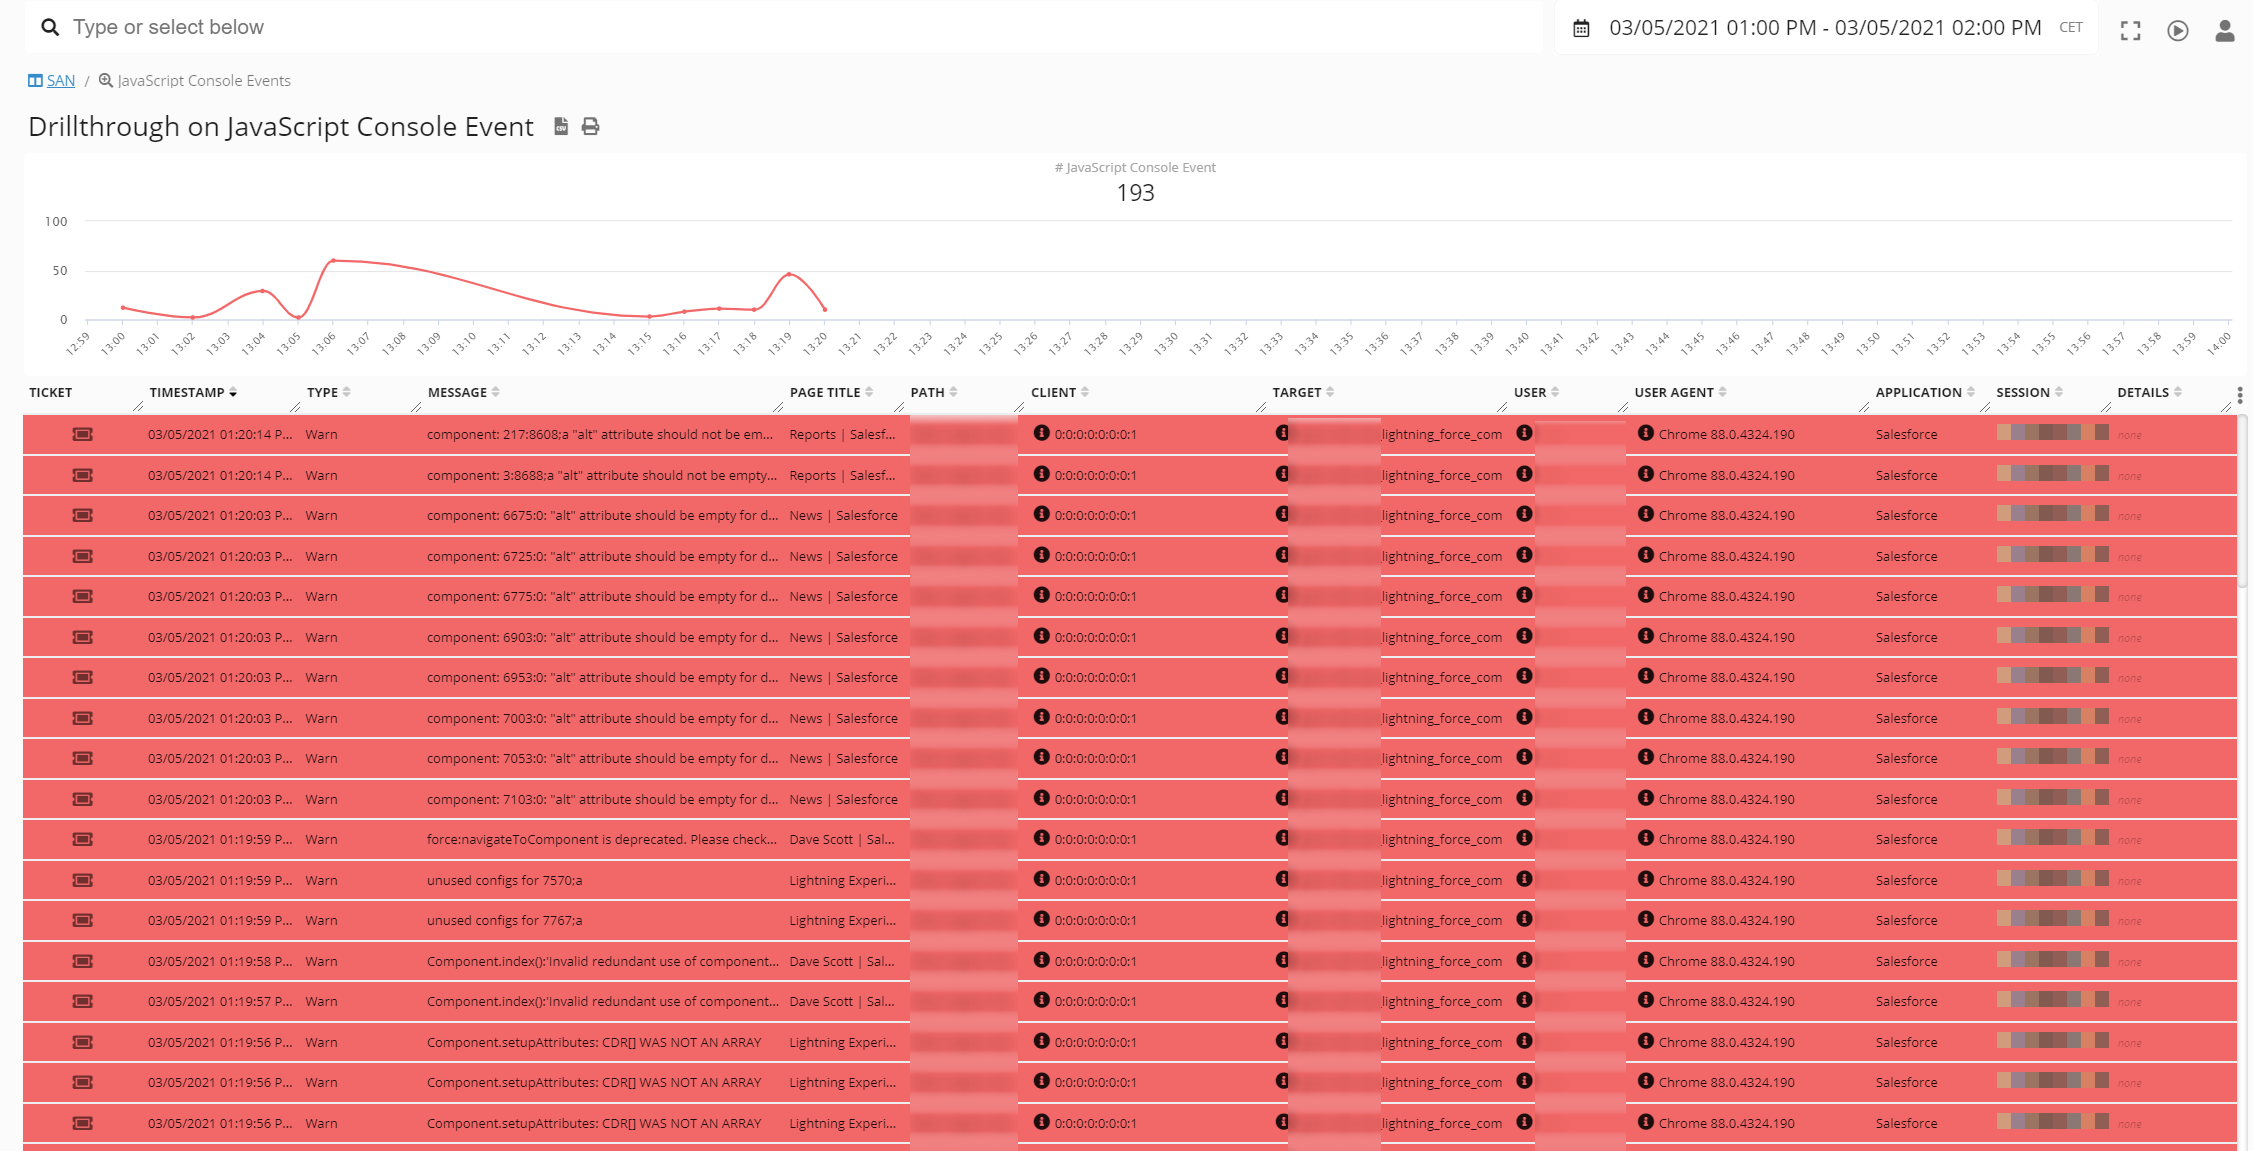
JavaScript Console Event (in SFDC)
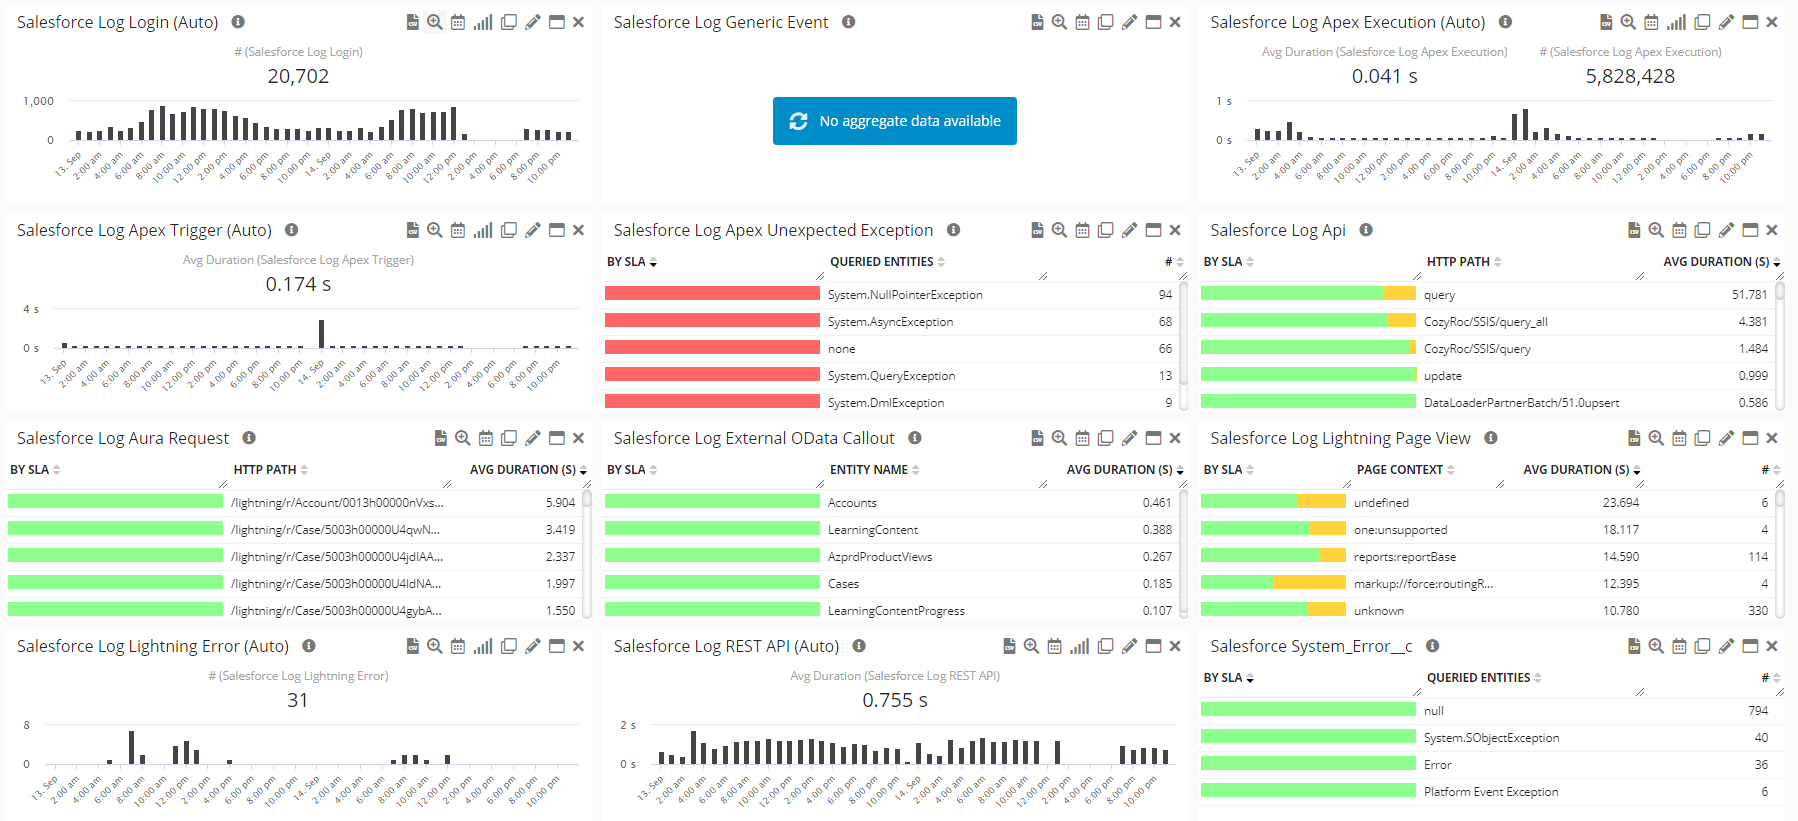
Logs Analysis (of SFDC)
Monitoring of SFDC Logs, real-time, 24x7.
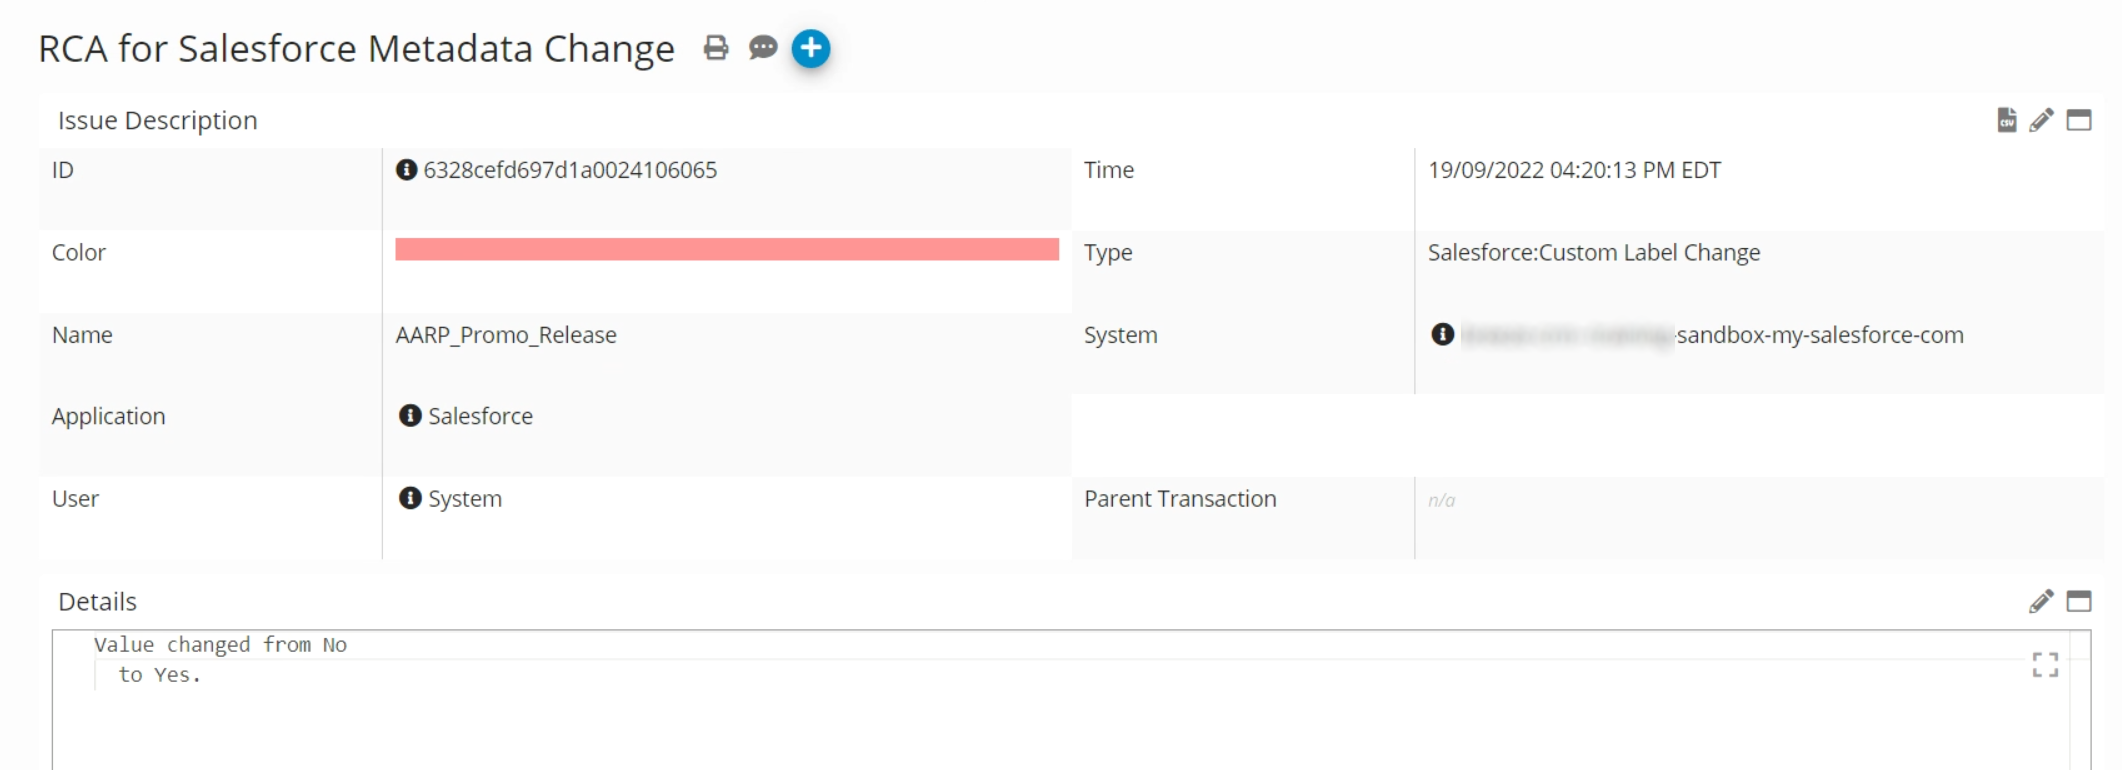
Metadata Change in SFDC
Monitoring of SFDC Metadata change, real-time, 24x7.
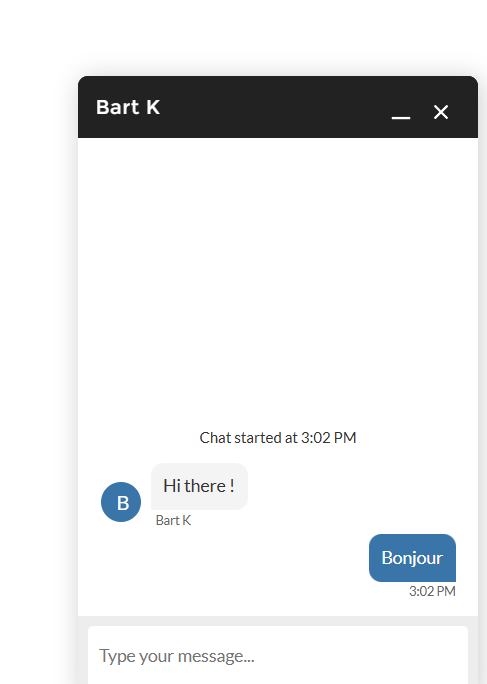
Omni-Channel Monitoring (in SFDC)
GermainUX now supports full-stack monitoring of Salesforce Omni-Channel, including Live Chat, SMS, Messaging, and Case Routing. This includes:
🔍 Chat & Conversation Monitoring Features:
-
Real-Time Chat Assignment Tracking
Monitor when and how chats are assigned to agents, and detect delays in routing or engagement. -
Conversation Timeline Replay
Replay the full sequence of a chat session — from queue placement to first response, transfers, and resolution — including metadata and agent actions. -
Friction Point Analysis
Automatically detect issues like:-
Long wait times before first response
-
Missed or dropped chats
-
Repeated transfers
-
Slow handling times
-
-
Agent Efficiency Insights
Evaluate concurrent chat handling per agent, idle time, and time to close. Identify coaching or staffing opportunities. -
Message Content Collection (Optional)
With proper configuration and compliance considerations, GermainUX can collect and analyze chat messages (sent by agents or users) to surface sentiment, intent, and communication quality using AI. -
KPI & SLA Monitoring
Create SLAs for first response time, chat duration, transfer count, and resolution time — with real-time alerts.
To access chat data, navigate to the Omni-Channel Drillthrough Dashboard, or search session replays filtered by "chat" or "conversation" tags.
-
Chat by Agent
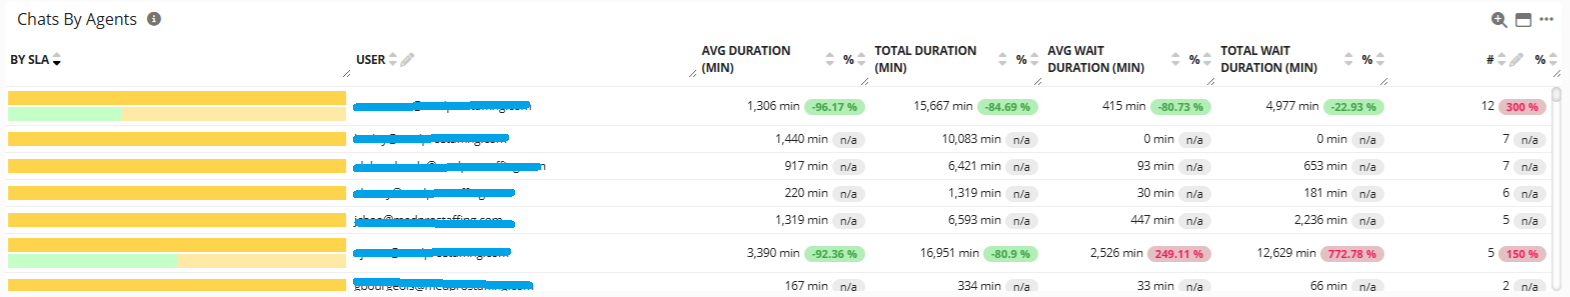
Chat Insight Broken down by Agent - Germain UX -
Chat Frictions (AI-analysis)
Ability to undersand if a conversation went well or not and why.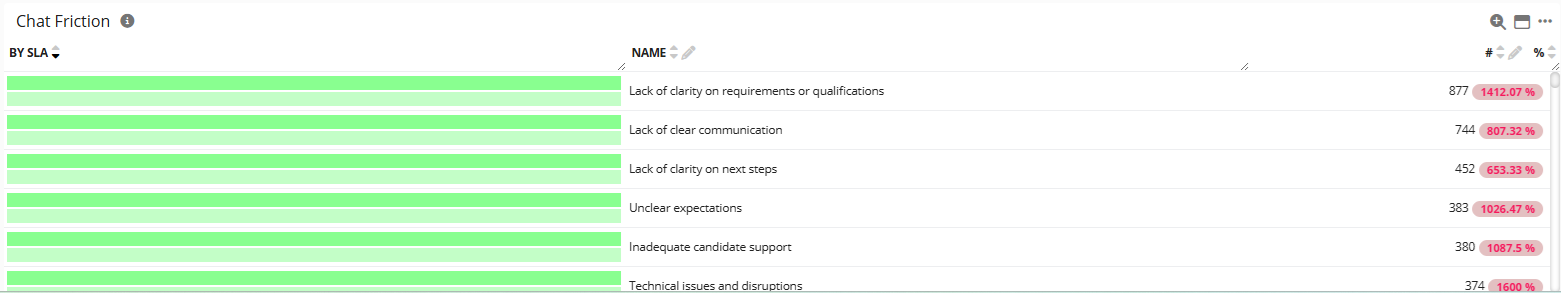
Chat Frictions Real-time Quantification at Scale - Germain UX
-
Error detection and analysis (on SFDC Omni-Channel):
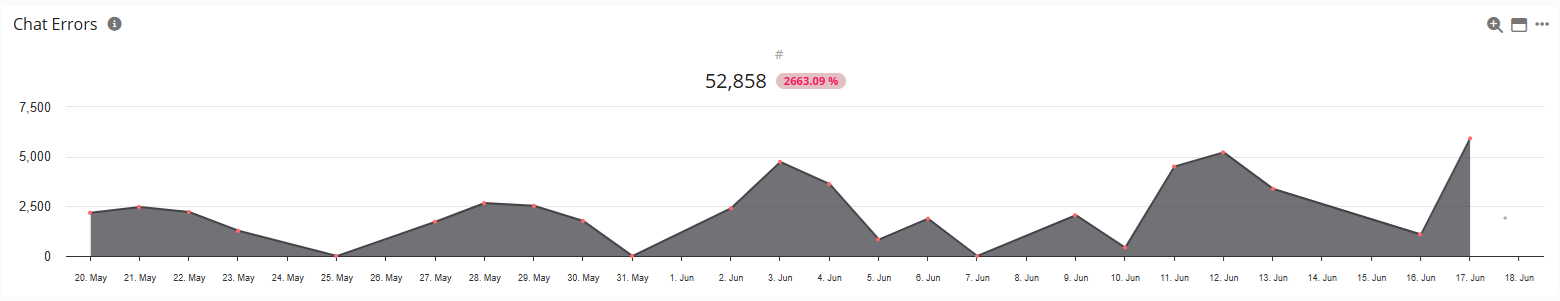
SFDC Omni-Channel Errors - GermainUX 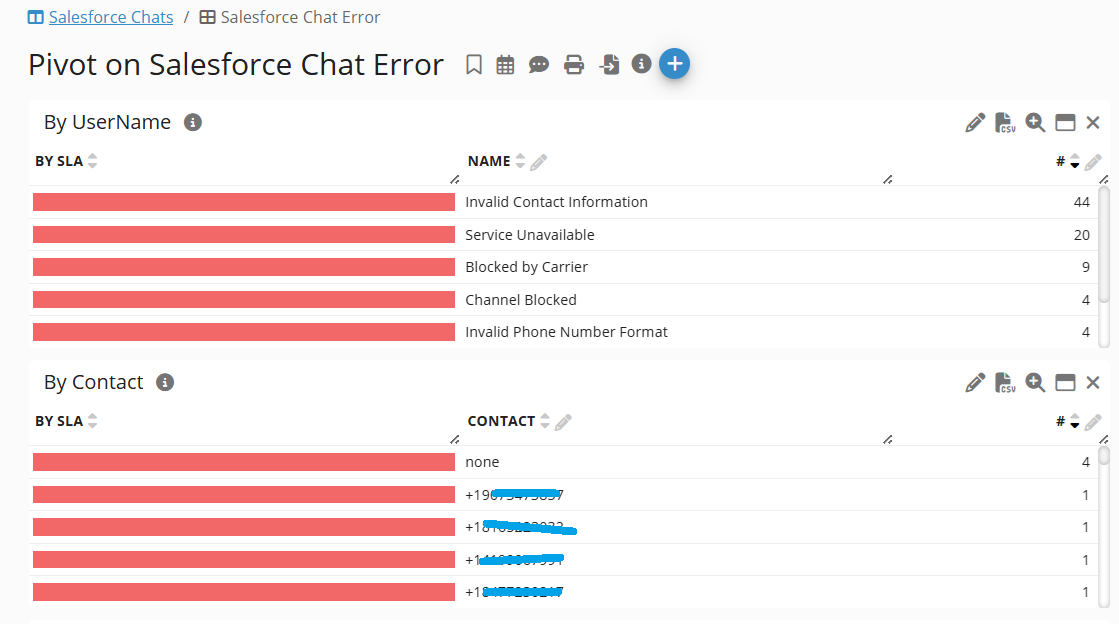
Pivot Examples on SFDC Omni-Channel Error - GermainUX 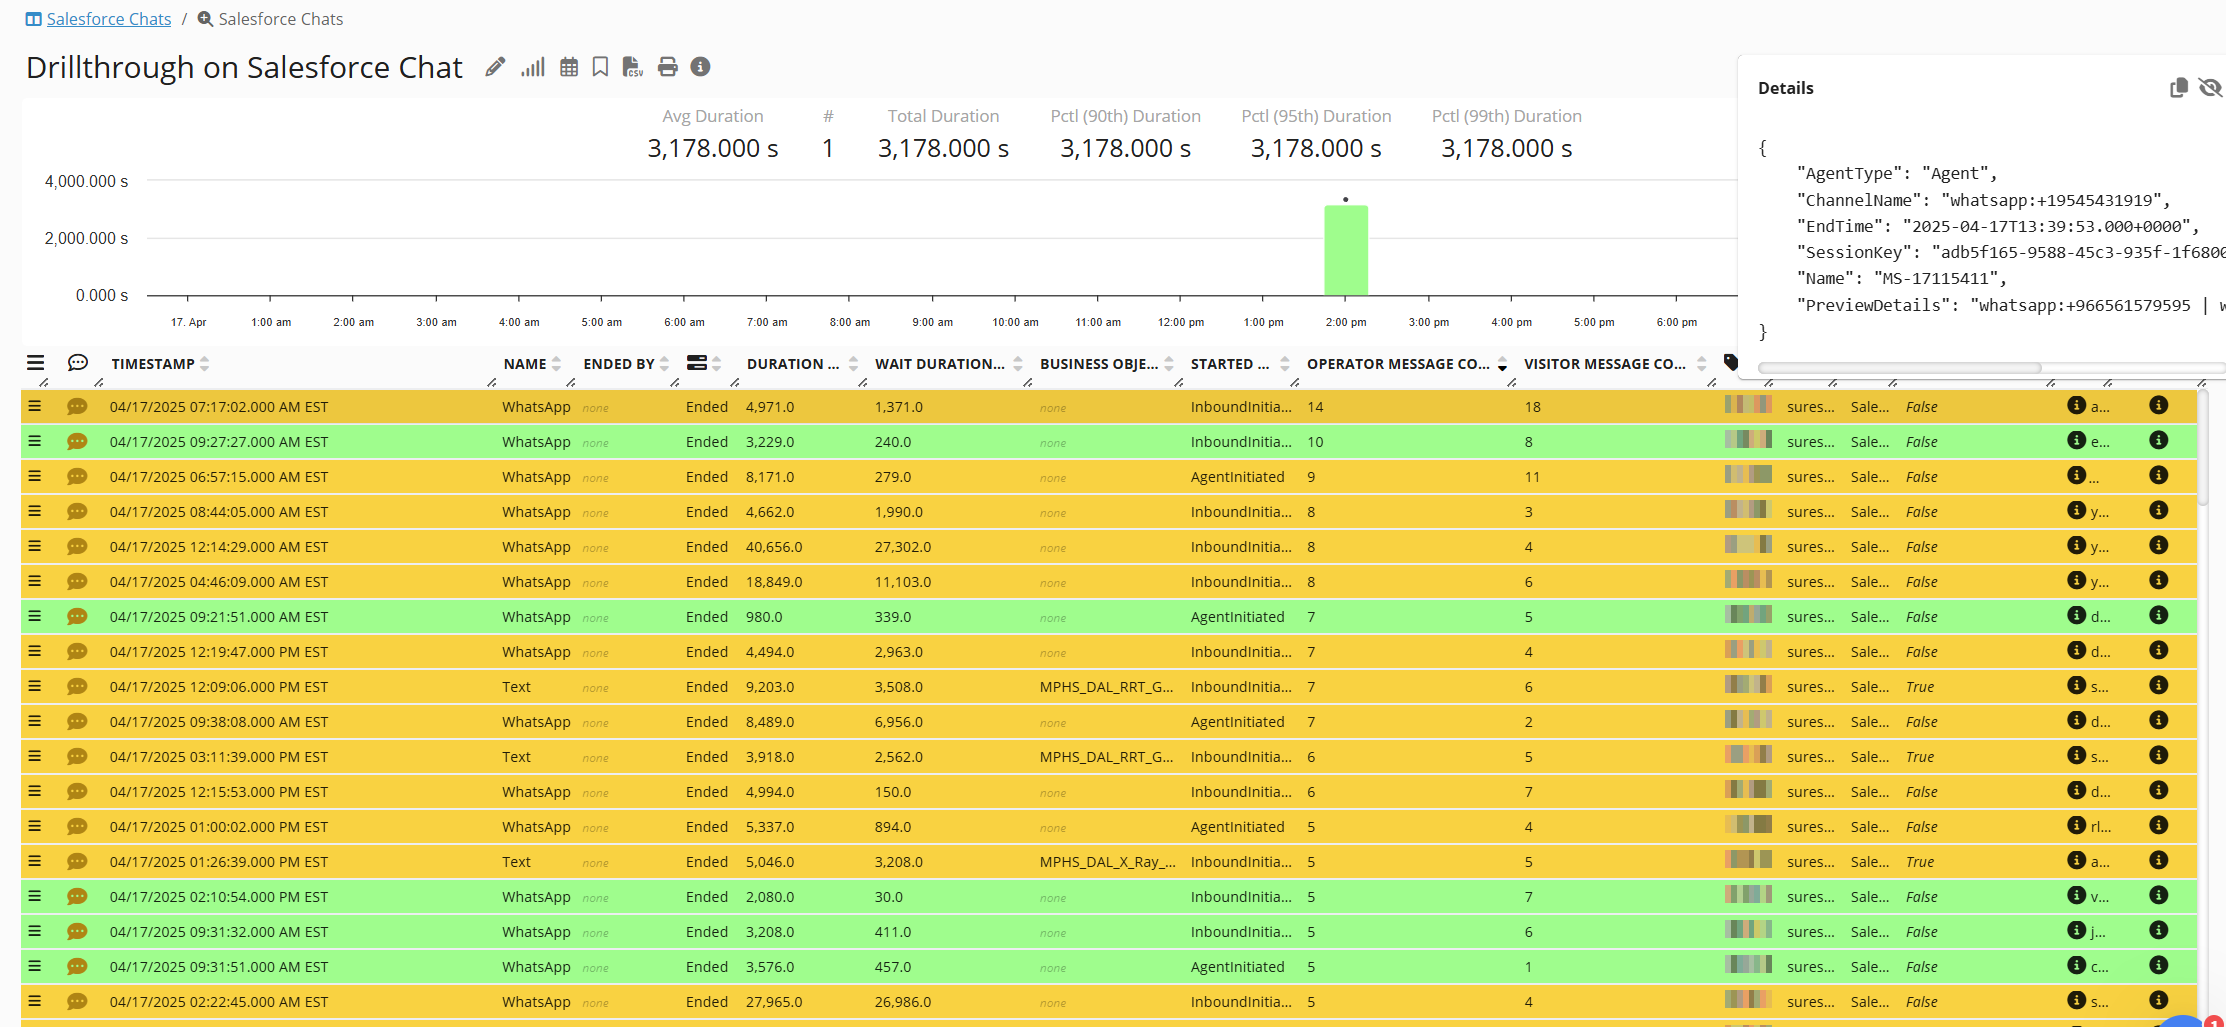
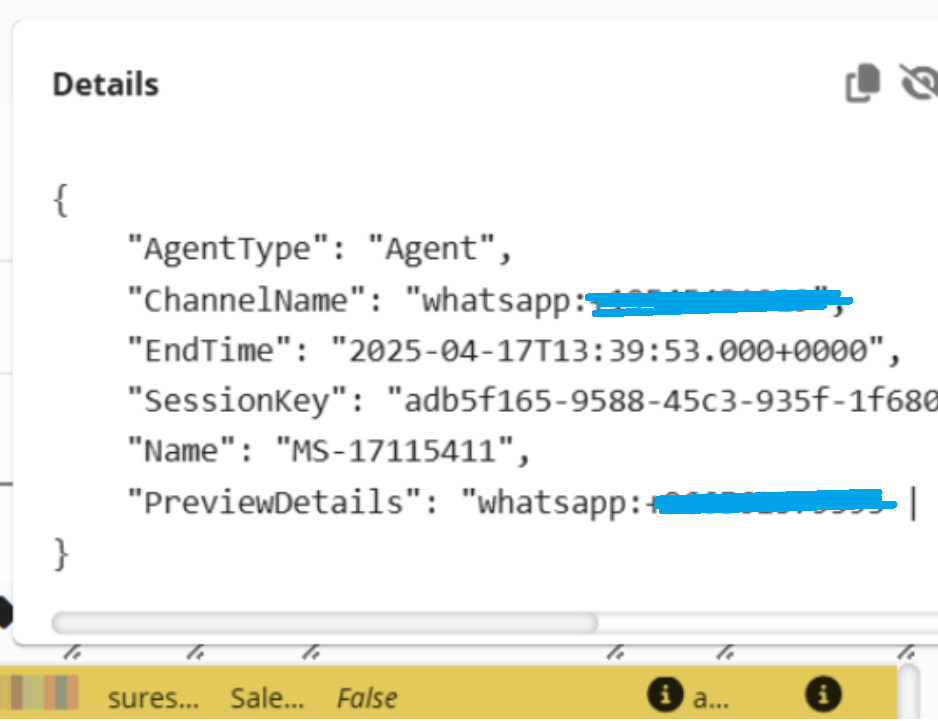
Drillthrough on SFDC Omni-Channel Errors - GermainUX
Page Insight (for SFDC)
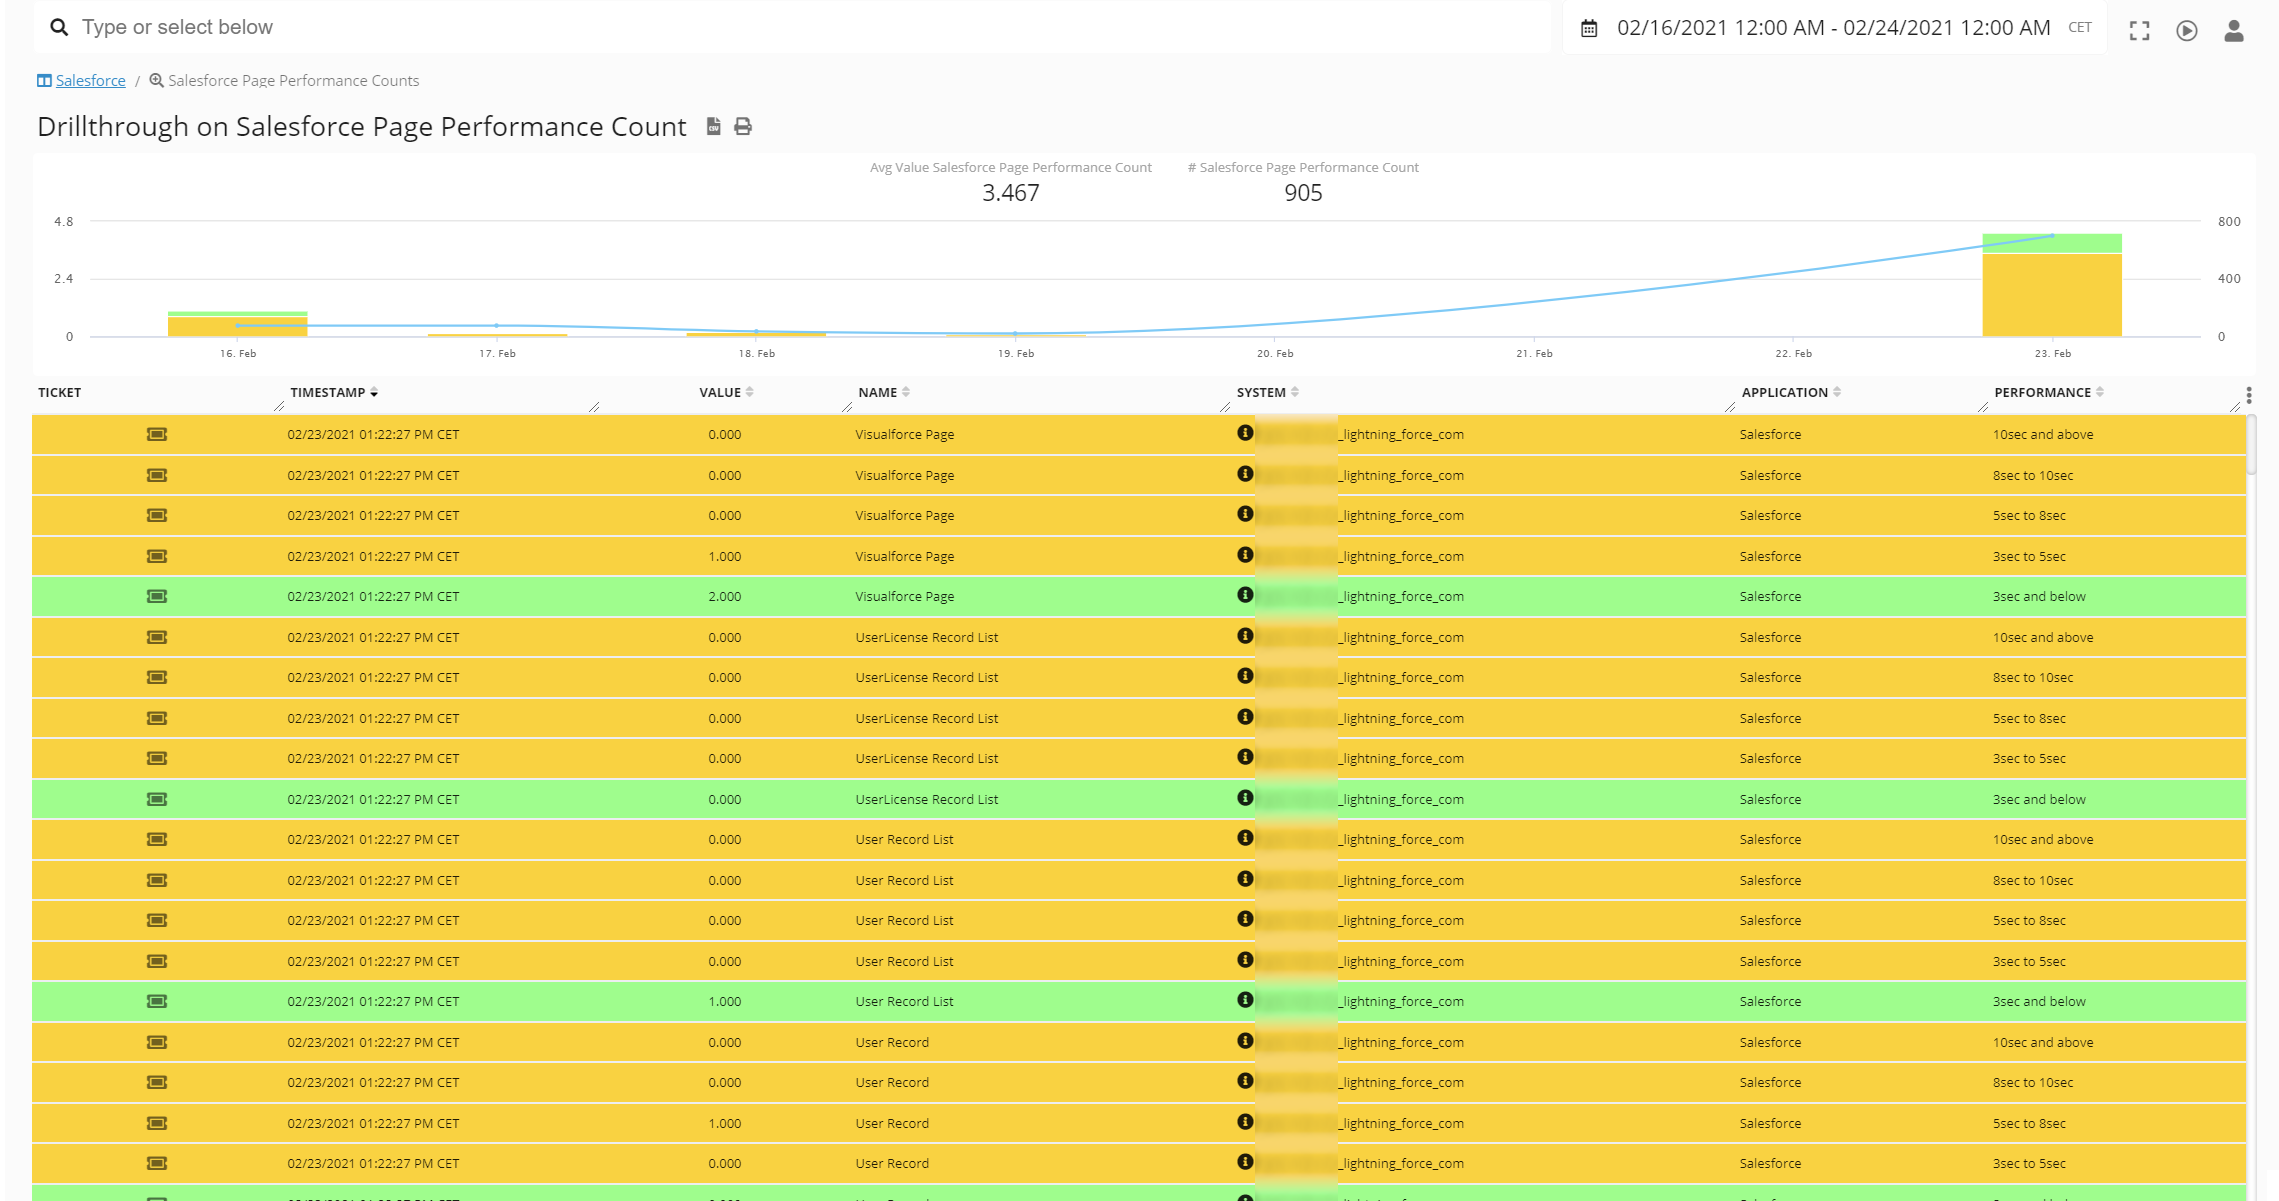
Performance view (for SFDC)
Monitoring of SFDC Performance, real-time, 24x7.
Platform Event Usage metrics (SFDC)
Enhanced Monitoring of SFDC Platform Event Publishing and Delivery Usage.
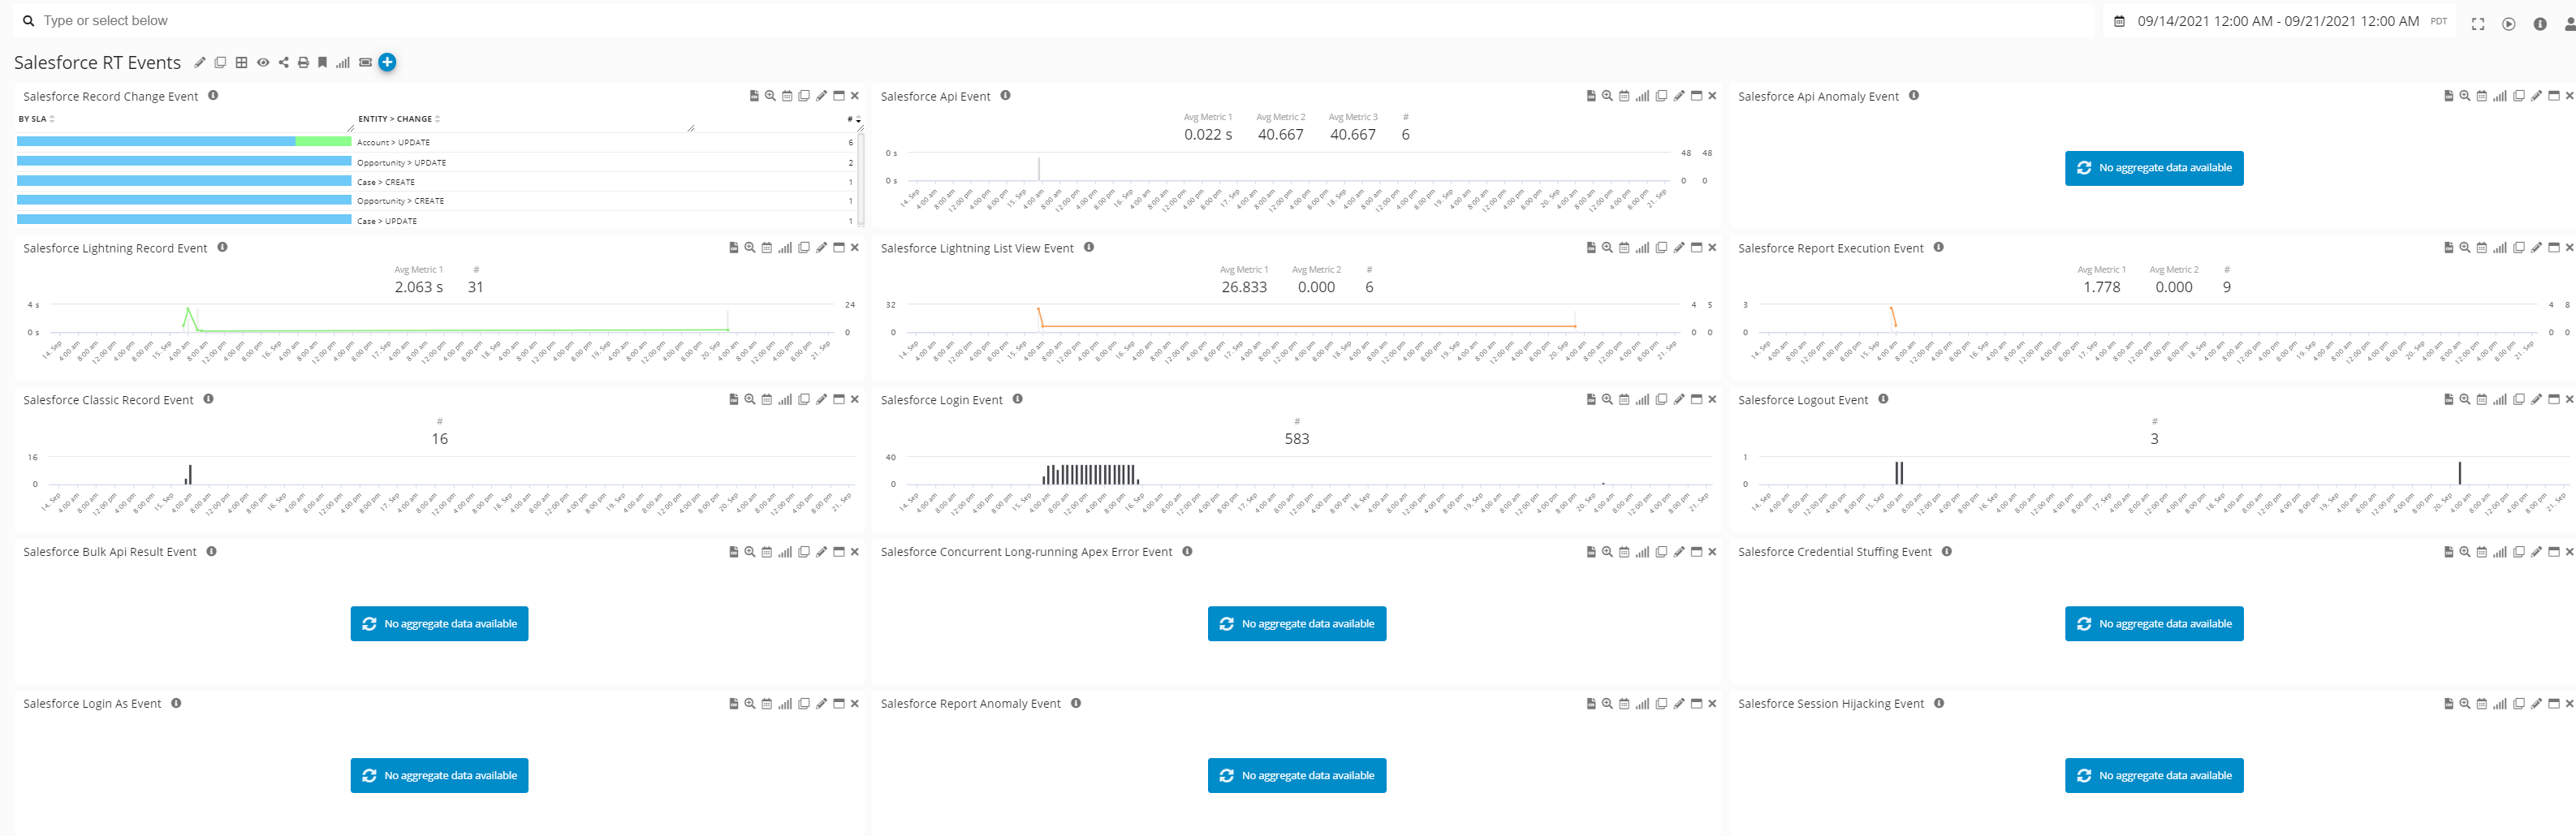
Real-time Event of SFDC
Monitoring of SFDC Real-time Event, real-time, 24x7.

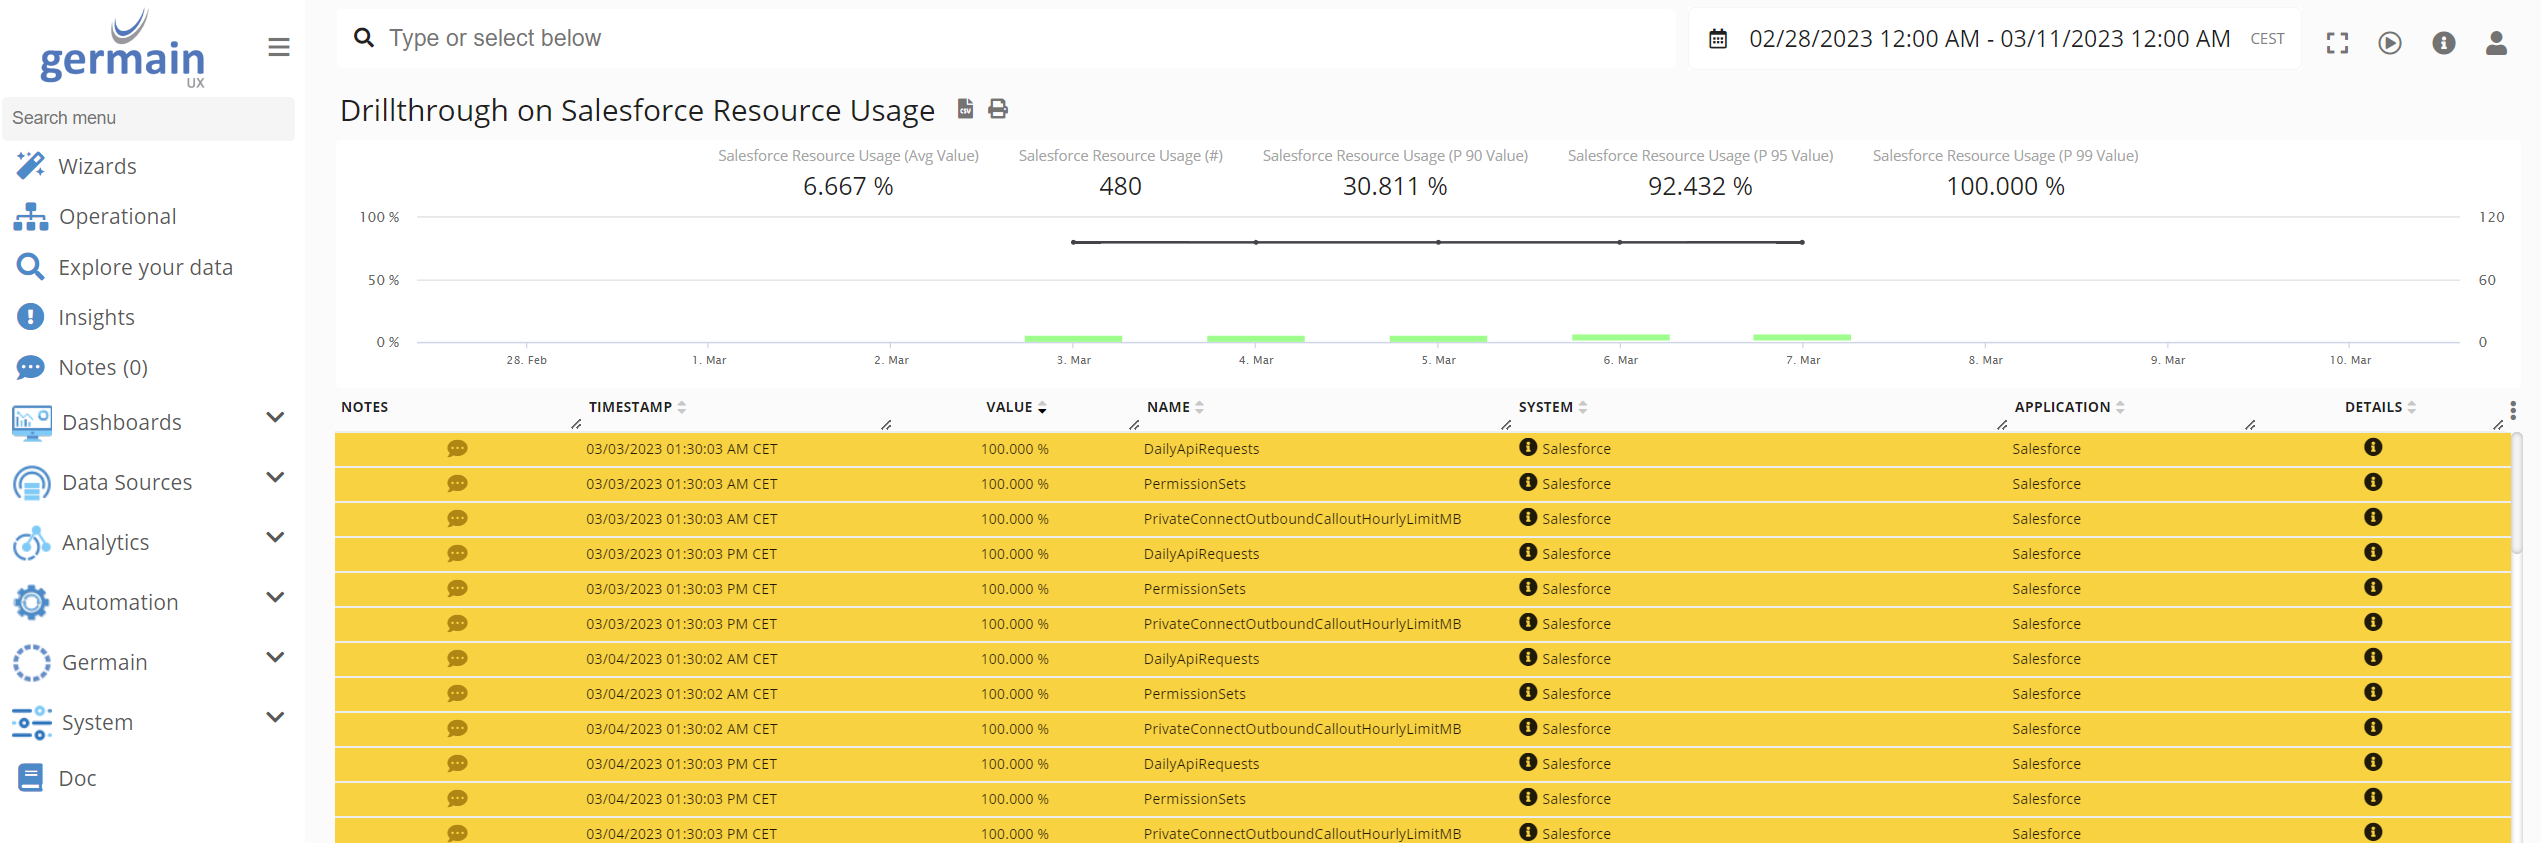
Resource Usage of SFDC
Monitoring of SFDC Resource Usage, real-time, 24x7.
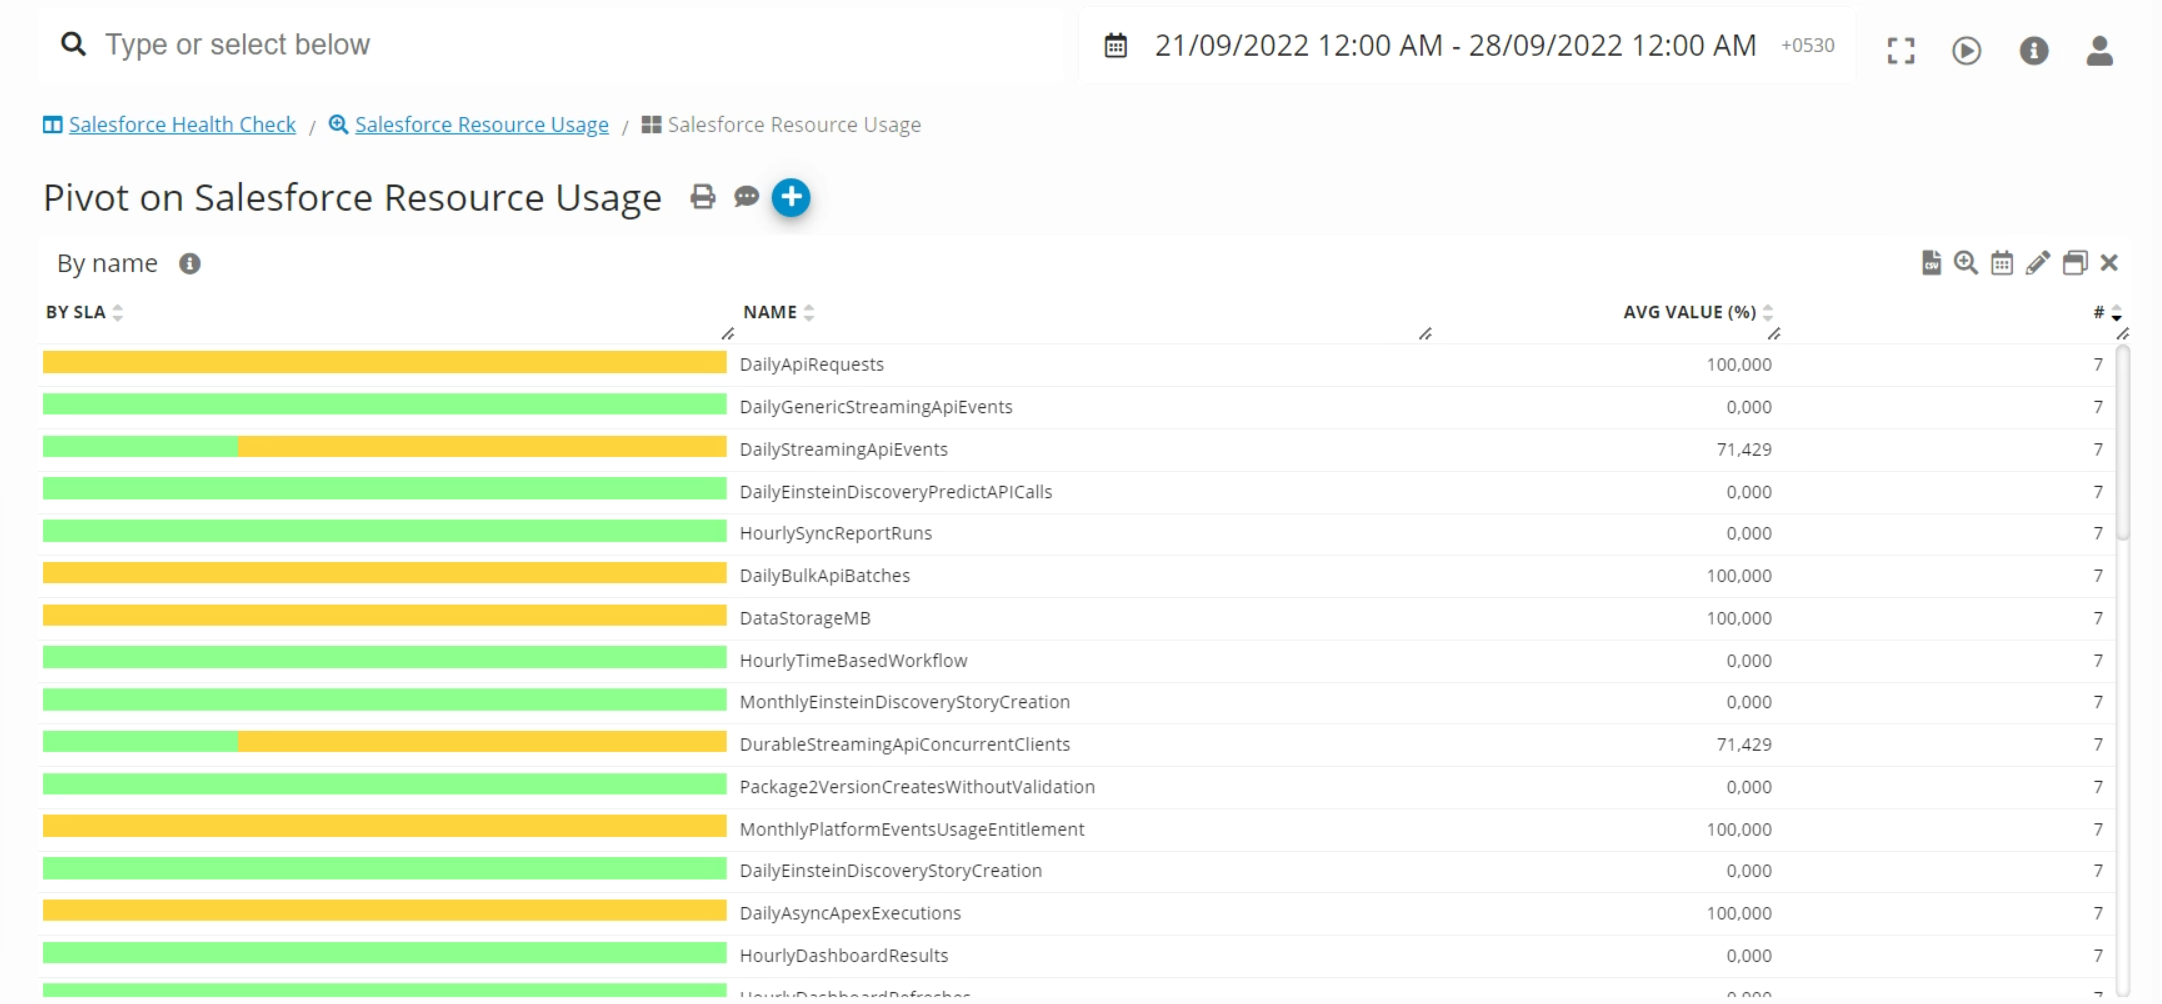
Resource Usage metrics (SFDC)
Monitoring of SFDC Resource Usage and Limit.
Setup Audit events (SFDC)
Monitoring of SFDC Setup Audit events (SetupAuditTrail)
SOQL Execution Insights (SFDC)
Monitoring of SFDC SOQL Execution , real-time, 24x7.
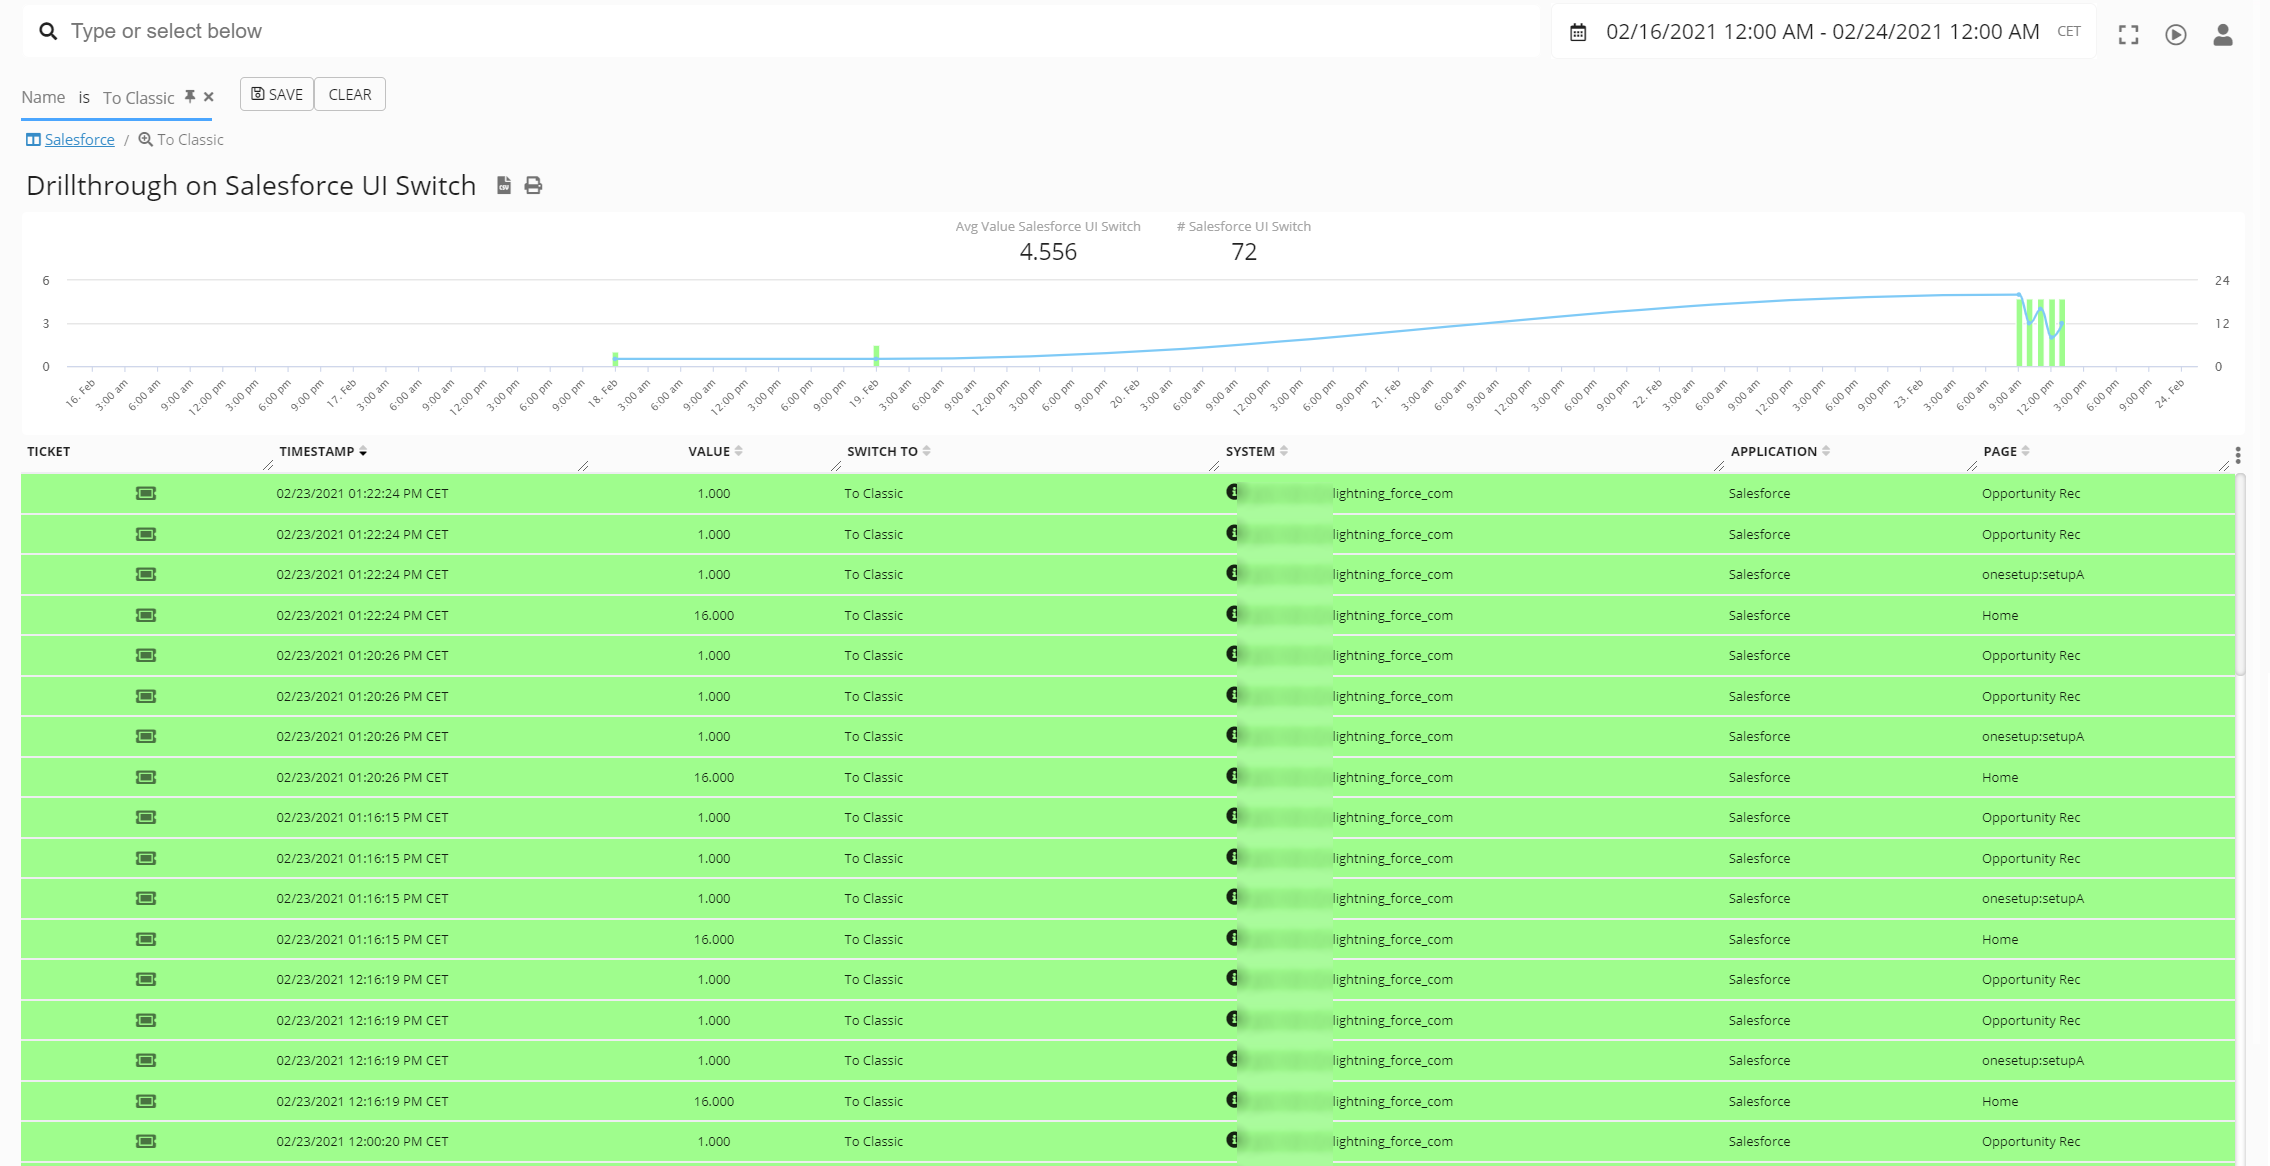
Switch-to-Classic SFDC
Monitoring of SFDC Switch to classic, real-time, 24x7.
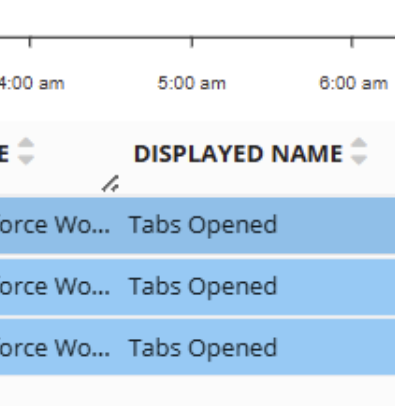
Multi-Tab Monitoring (SFDC)
GermainUX tracks the number of tabs a user opens while working in Salesforce. While the active tab has always been monitored, this enhancement adds visibility into how often users open additional tabs—providing deeper insight into user behavior and potential workflow inefficiencies.
Example: Tab Opened detected by GermainUX.
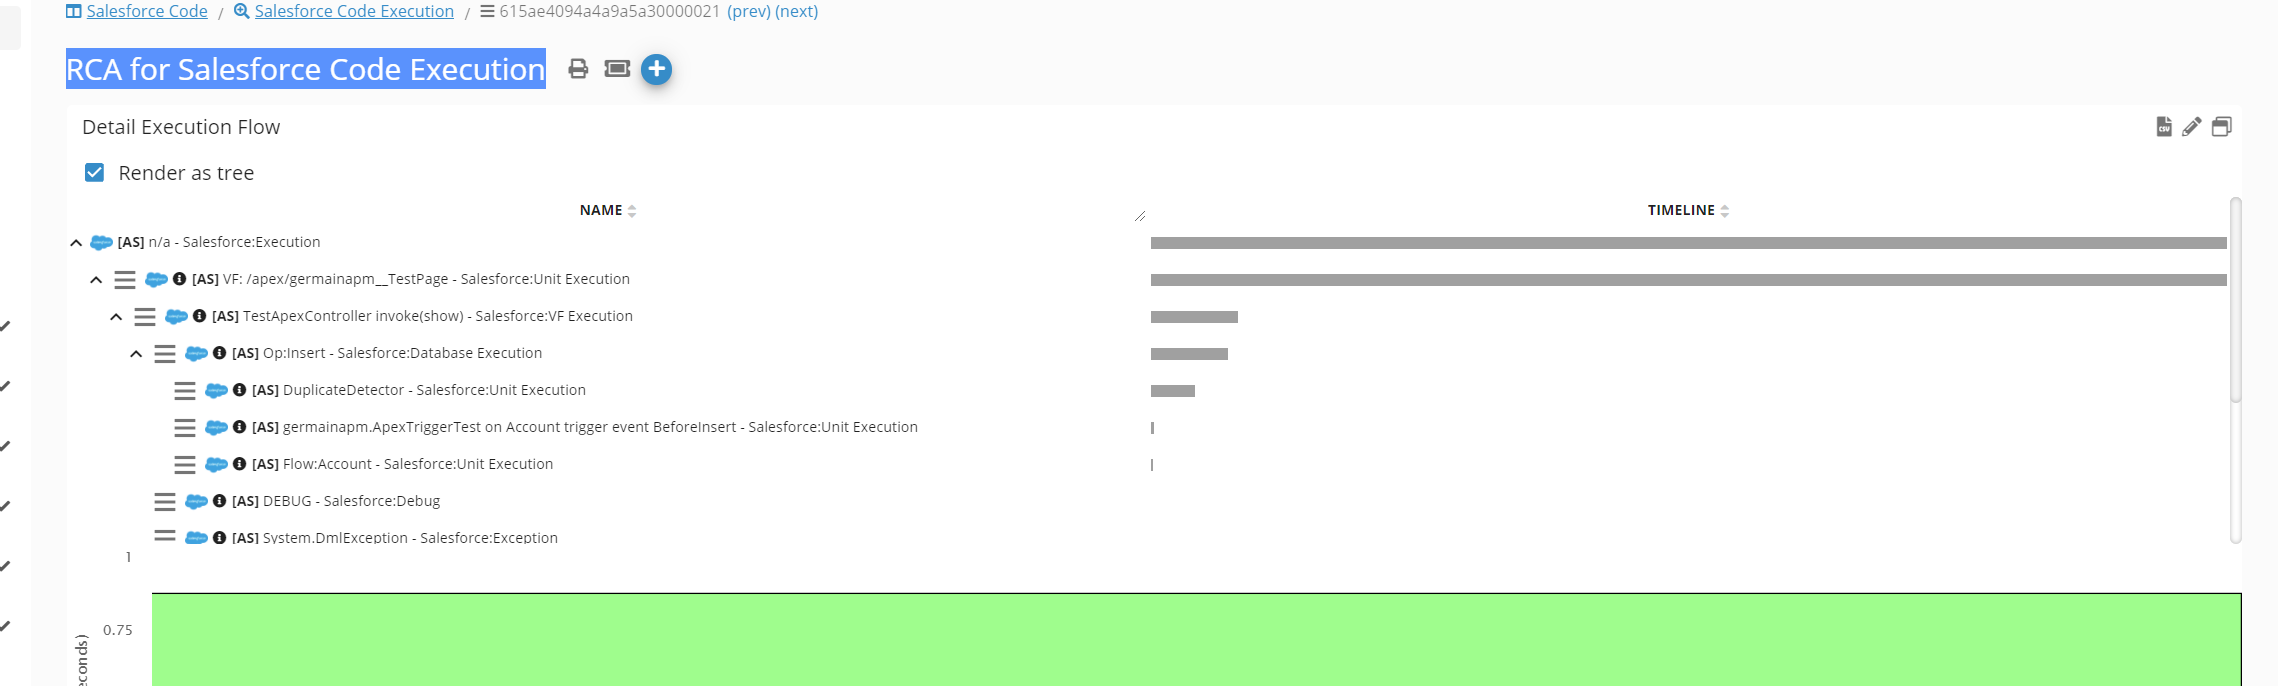
Transactions Tracing (SFDC)
Germain provides end-to-end transaction tracing, capturing data flow from JavaScript to HTTP requests, integrations, Apex code, database operations, and more in real-time, 24/7. With Germain's comprehensive monitoring, organizations using Salesforce Classic and Lightning can gain insights, automate issue detection, and optimize the performance and user experience of their Salesforce Cloud applications.
-
Here's an example of end-to-end transaction tracing, starting from JavaScript execution, followed by HTTP requests, integration calls, Apex code execution, database operations, and more.
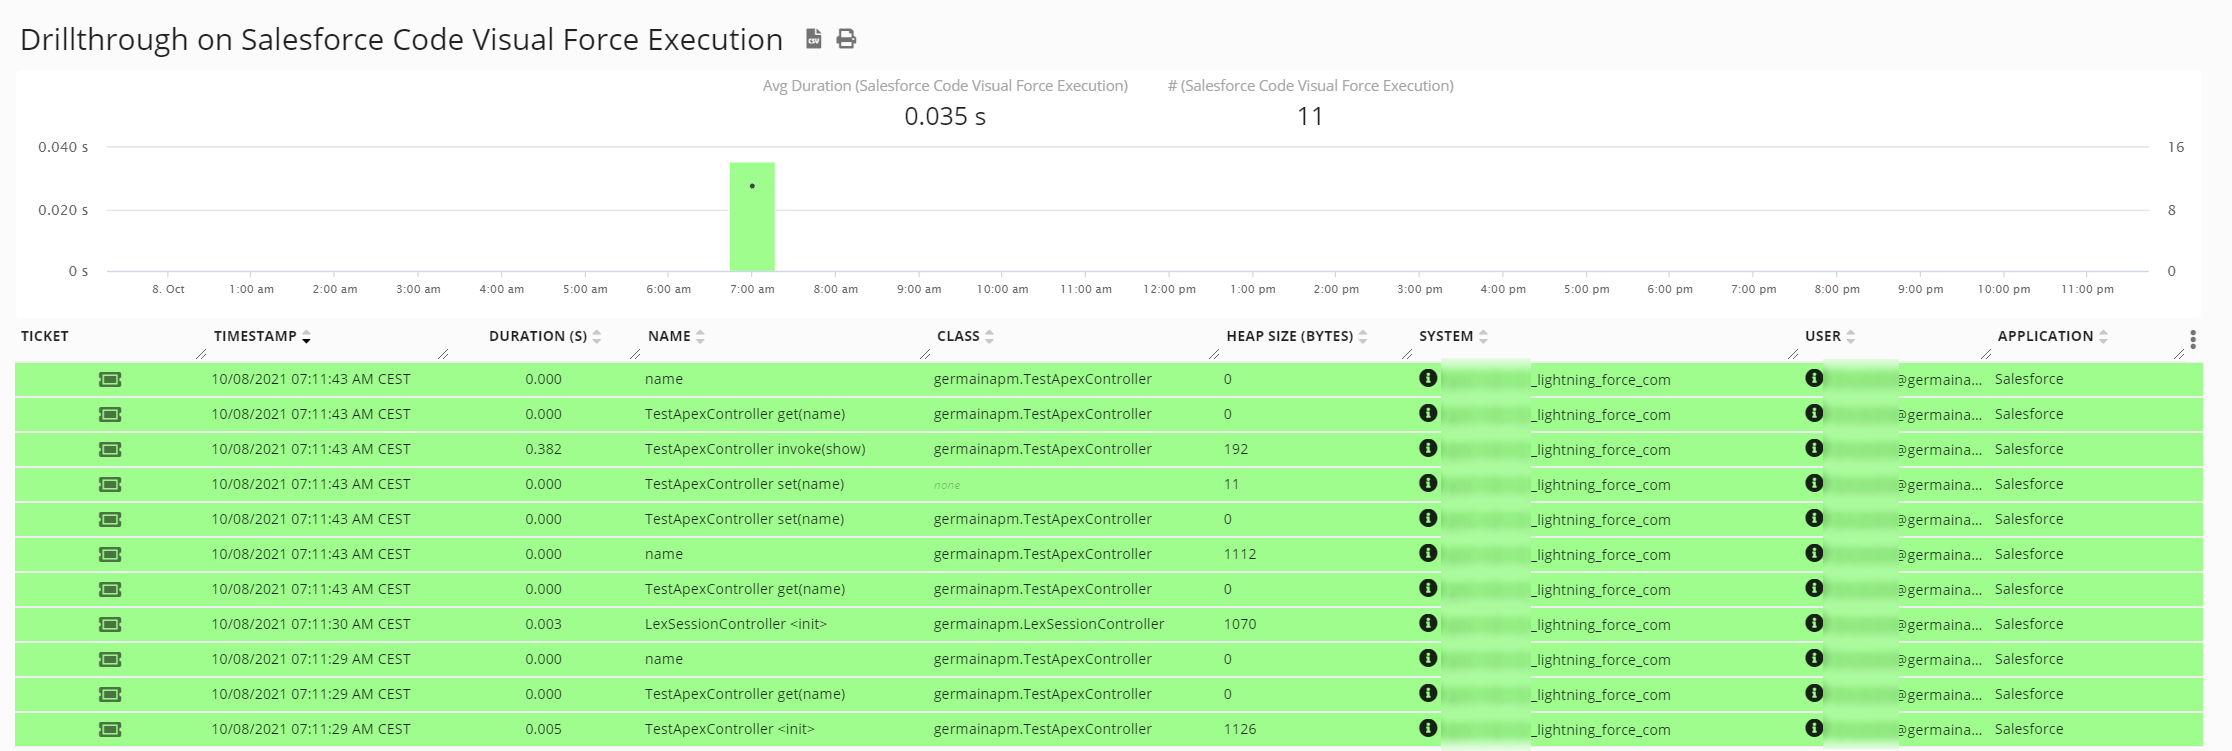
Visual Force Insights (SFDC)
Monitoring of SFDC Visual Force Metric, real-time, 24x7.
KPIs
Details about preconfigured KPIs in Germain UX for SFDC:
-
Germain KPIs for SFDC Application Performance.
-
Germain KPIs for SFDC Audit Trail.
-
Germain KPIs for SFDC Usage and Capacity.
Compliance, Data Security and Privacy
Data and Metadata updates, Usage of SFDC are continuously monitored by Germain in real-time, around the clock. This monitoring strictly adheres to your organization's compliance regulations and configured data security and privacy mechanisms.
Real-time Automation for Salesforce Cloud
Germain offers a number of automation mechanisms to help proactively detect, analyze and possible resolve issues.
Alert
Be alerted about any kind of issues and at the right frequency. Here are details on Germain UX alerts.
Proactive Issue Detection
Detect issues before they affect business using synthetic transaction or smart analysis of trends and issue occurrences.
Automatic Issue Resolution
Let Germain automate resolution of an issue (e.g. update of incorrect data, restart of a system, etc). Here are more details on Germain’s automation features.
For more detailed information, please reaching out to us: https://docs.germainux.com/main/support . We will provide you with further guidance and assistance tailored to your needs.
Component: Engine, JS Profiler, Mobile App, RPA Bot Recorder, RUM Ext
Feature Availability: 2023.1 or later