

360 degree Operational Dashboard
Monitoring & Analytics
Java (enh)
Monitoring & Analytics
Salesforce.com (01/31/21)
Monitoring & Analytics
WebLogic
Monitoring & Analytics
WebSphere
Monitoring & Analytics
Smart Insights (historical data analysis & prediction)
Monitoring & Analytics
ElasticSearch 7.8 (ready)
Maintenance
Monitoring & Analytics - 360 degree Operational Dashboard
Description
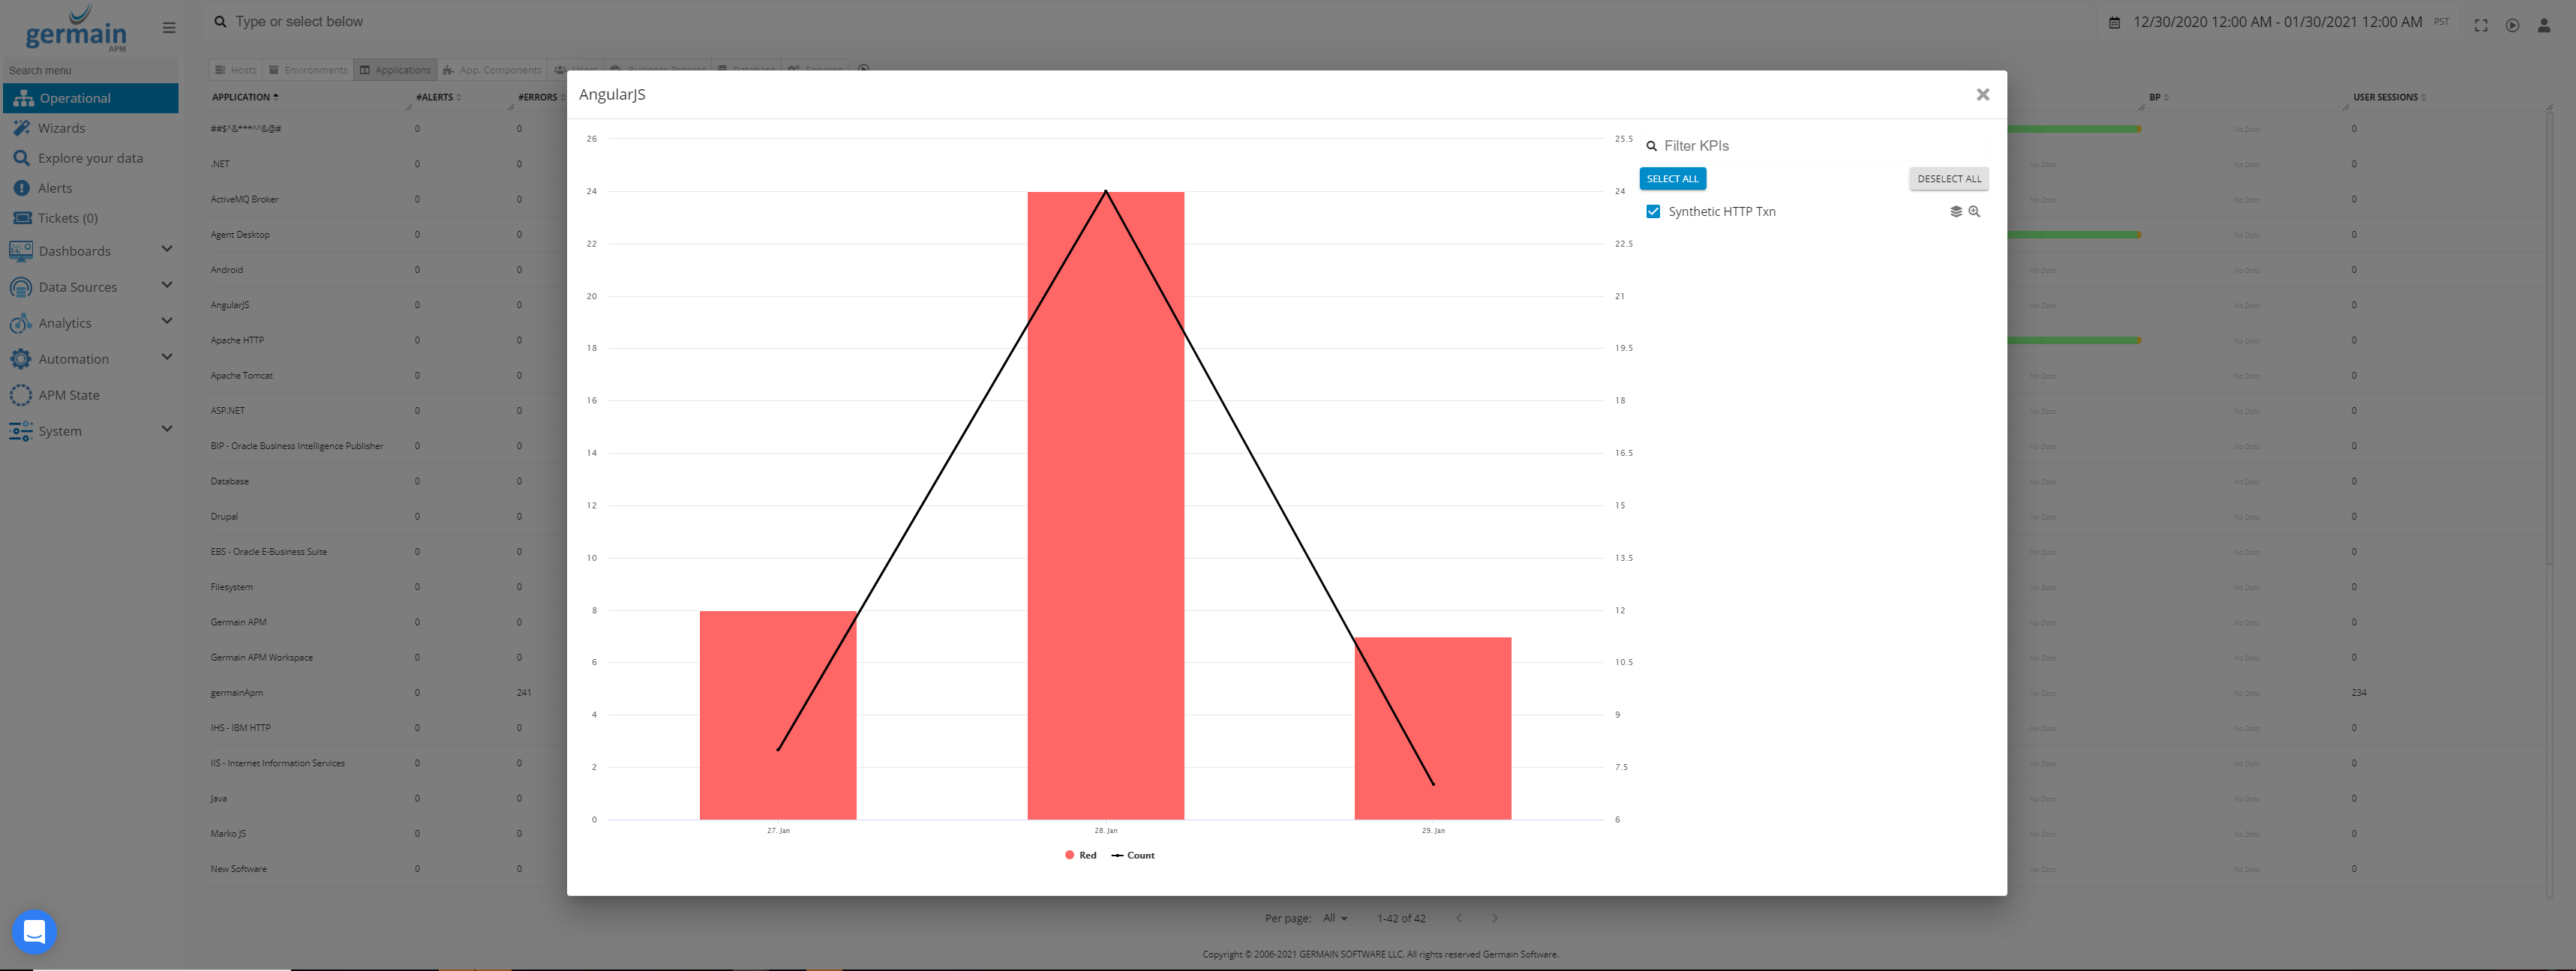
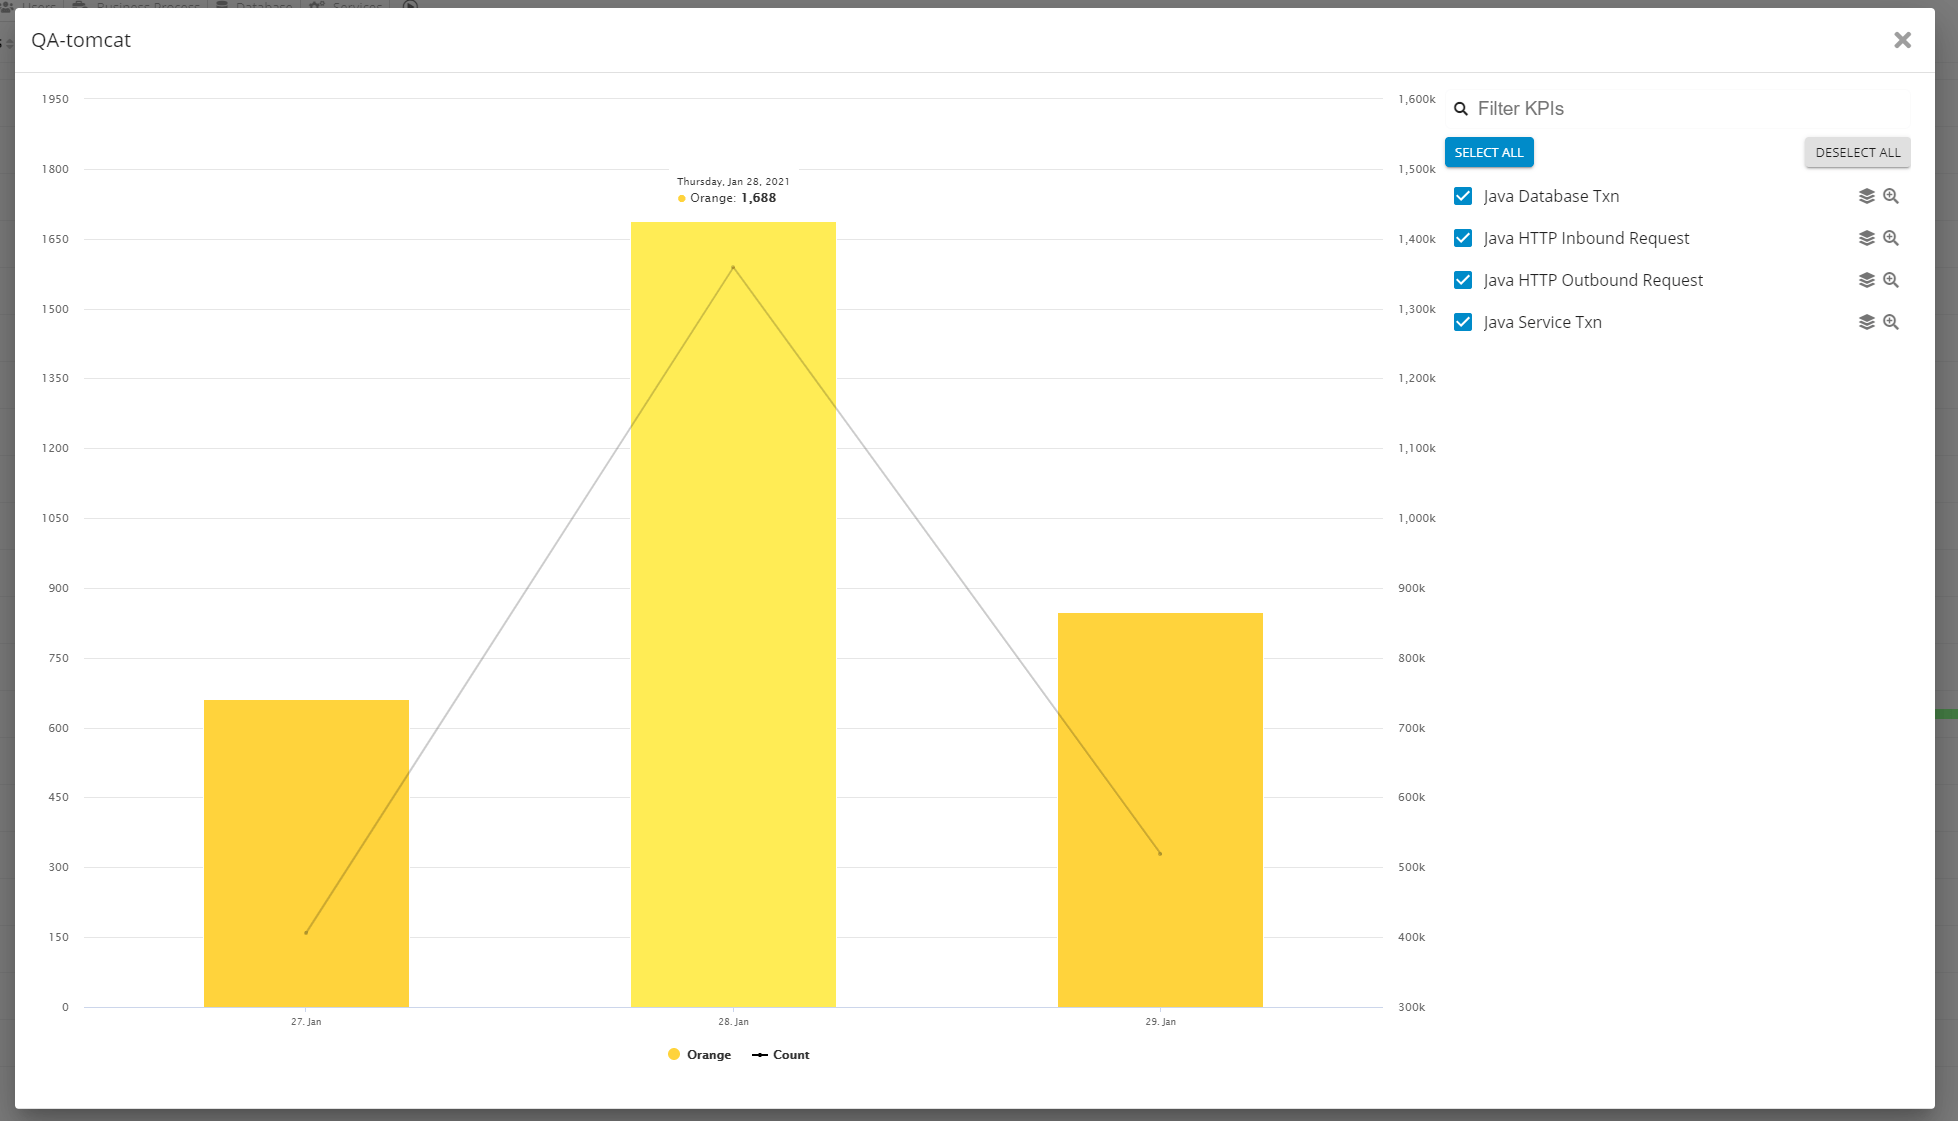
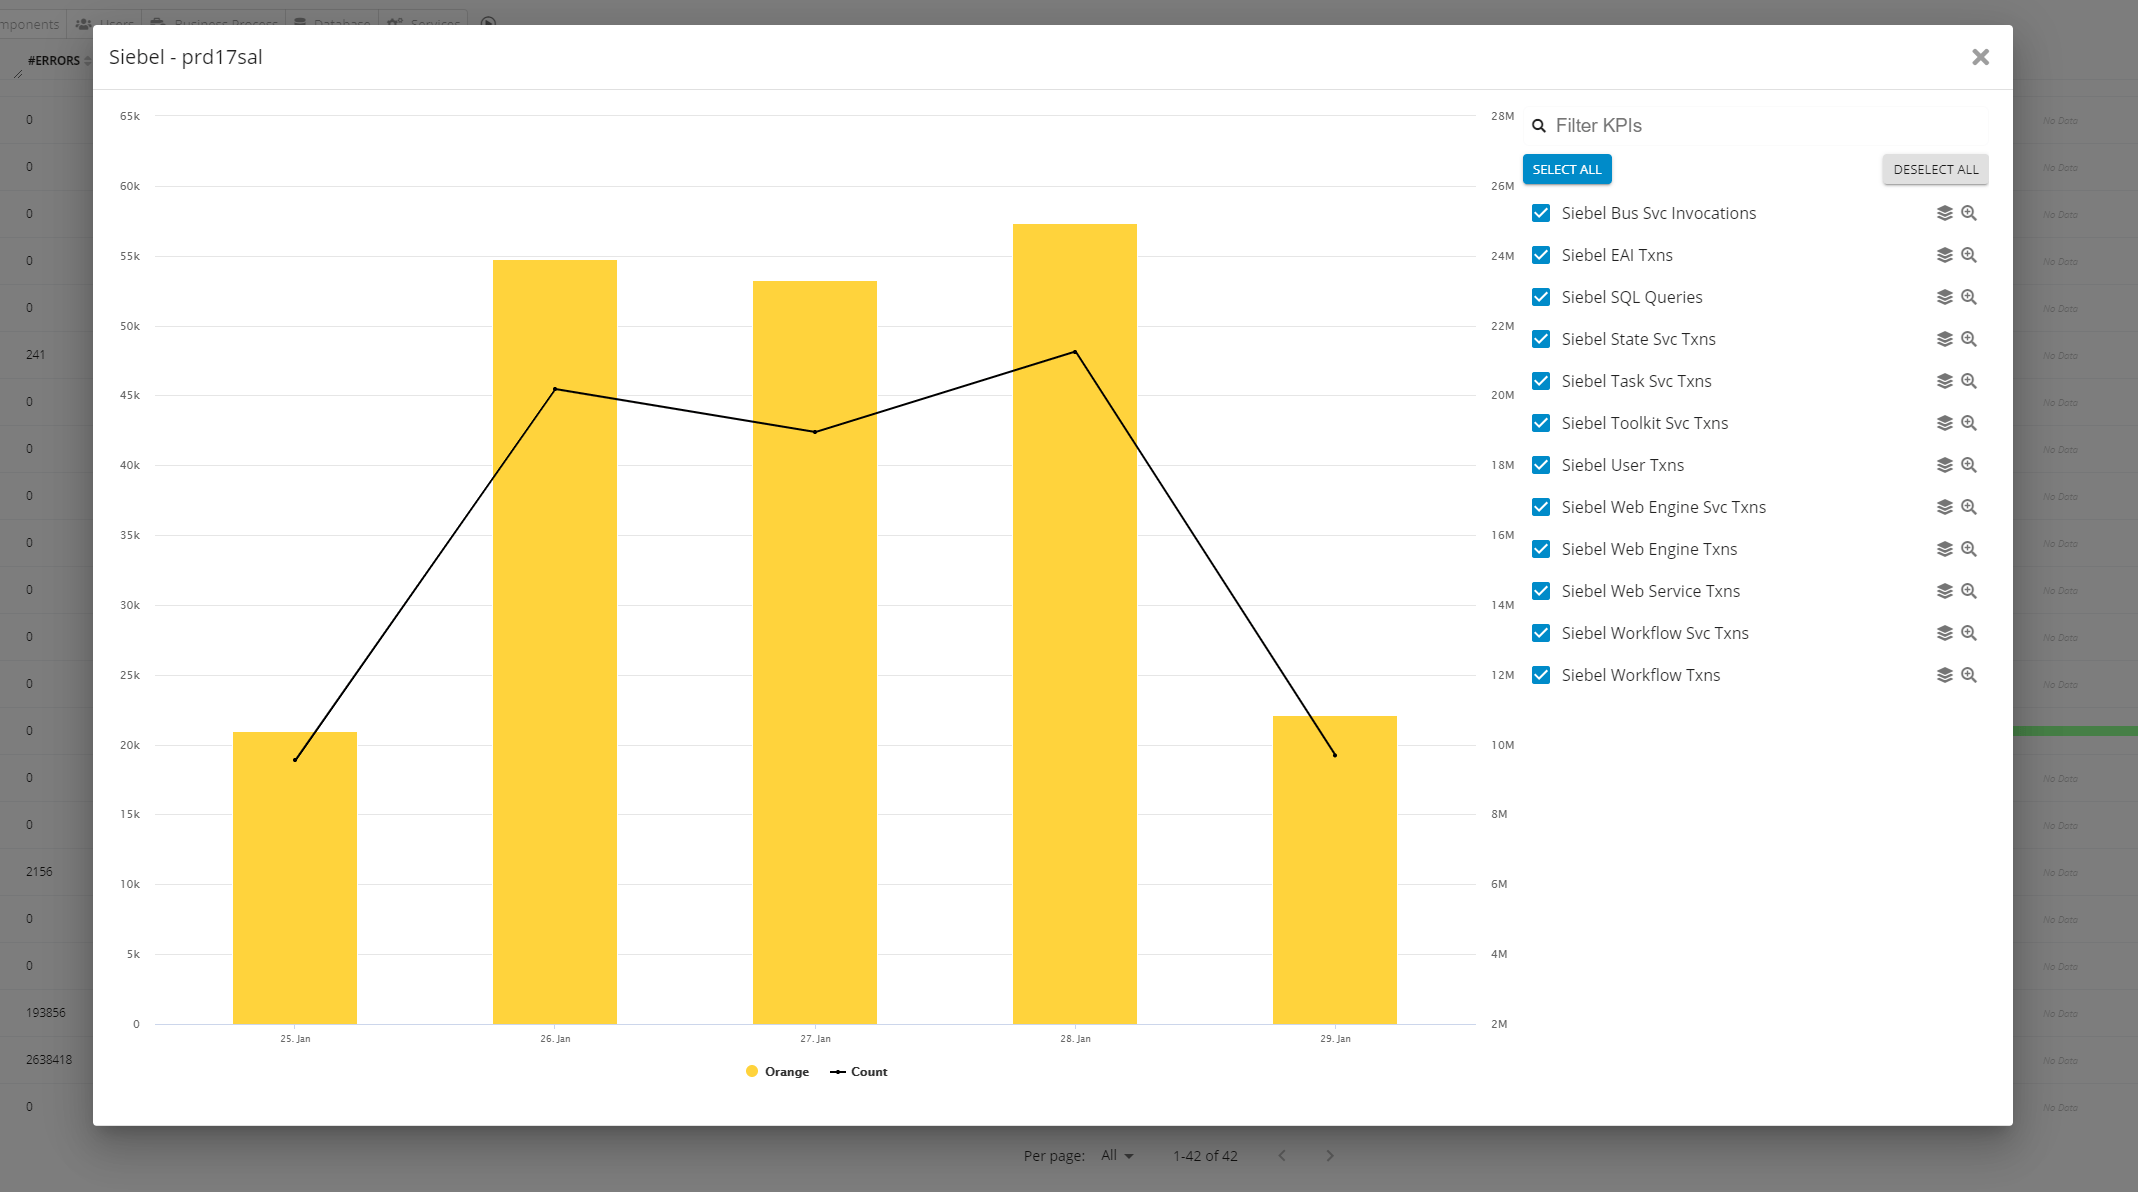
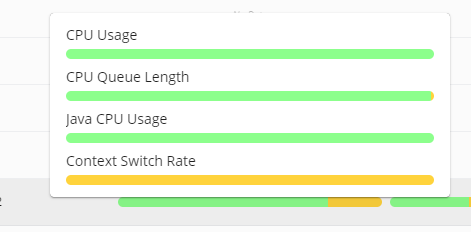
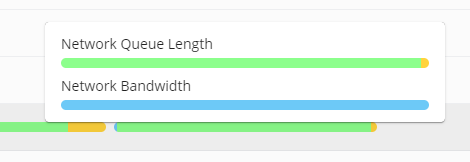
Some of you probably think “finally” ! 🙂 we now have a new type of dashboard, that provides a 360 degree view of all your Software, Hardware, User and Business Process on one single dashboardDifference with other dashboards?
One stop-shop for IT and Business Operations organizations. This operation dashboard is all you need to look at, to know whether your Data Centers and your Business (Users, Processes, etc) are doing well or bad. and you can still drilldown and do all other other things you do with other dashboards… Data is aggregated across KPIs and for as many kpis as you like. Data is coming from our our Real-Time Data engine, giving real-time insights.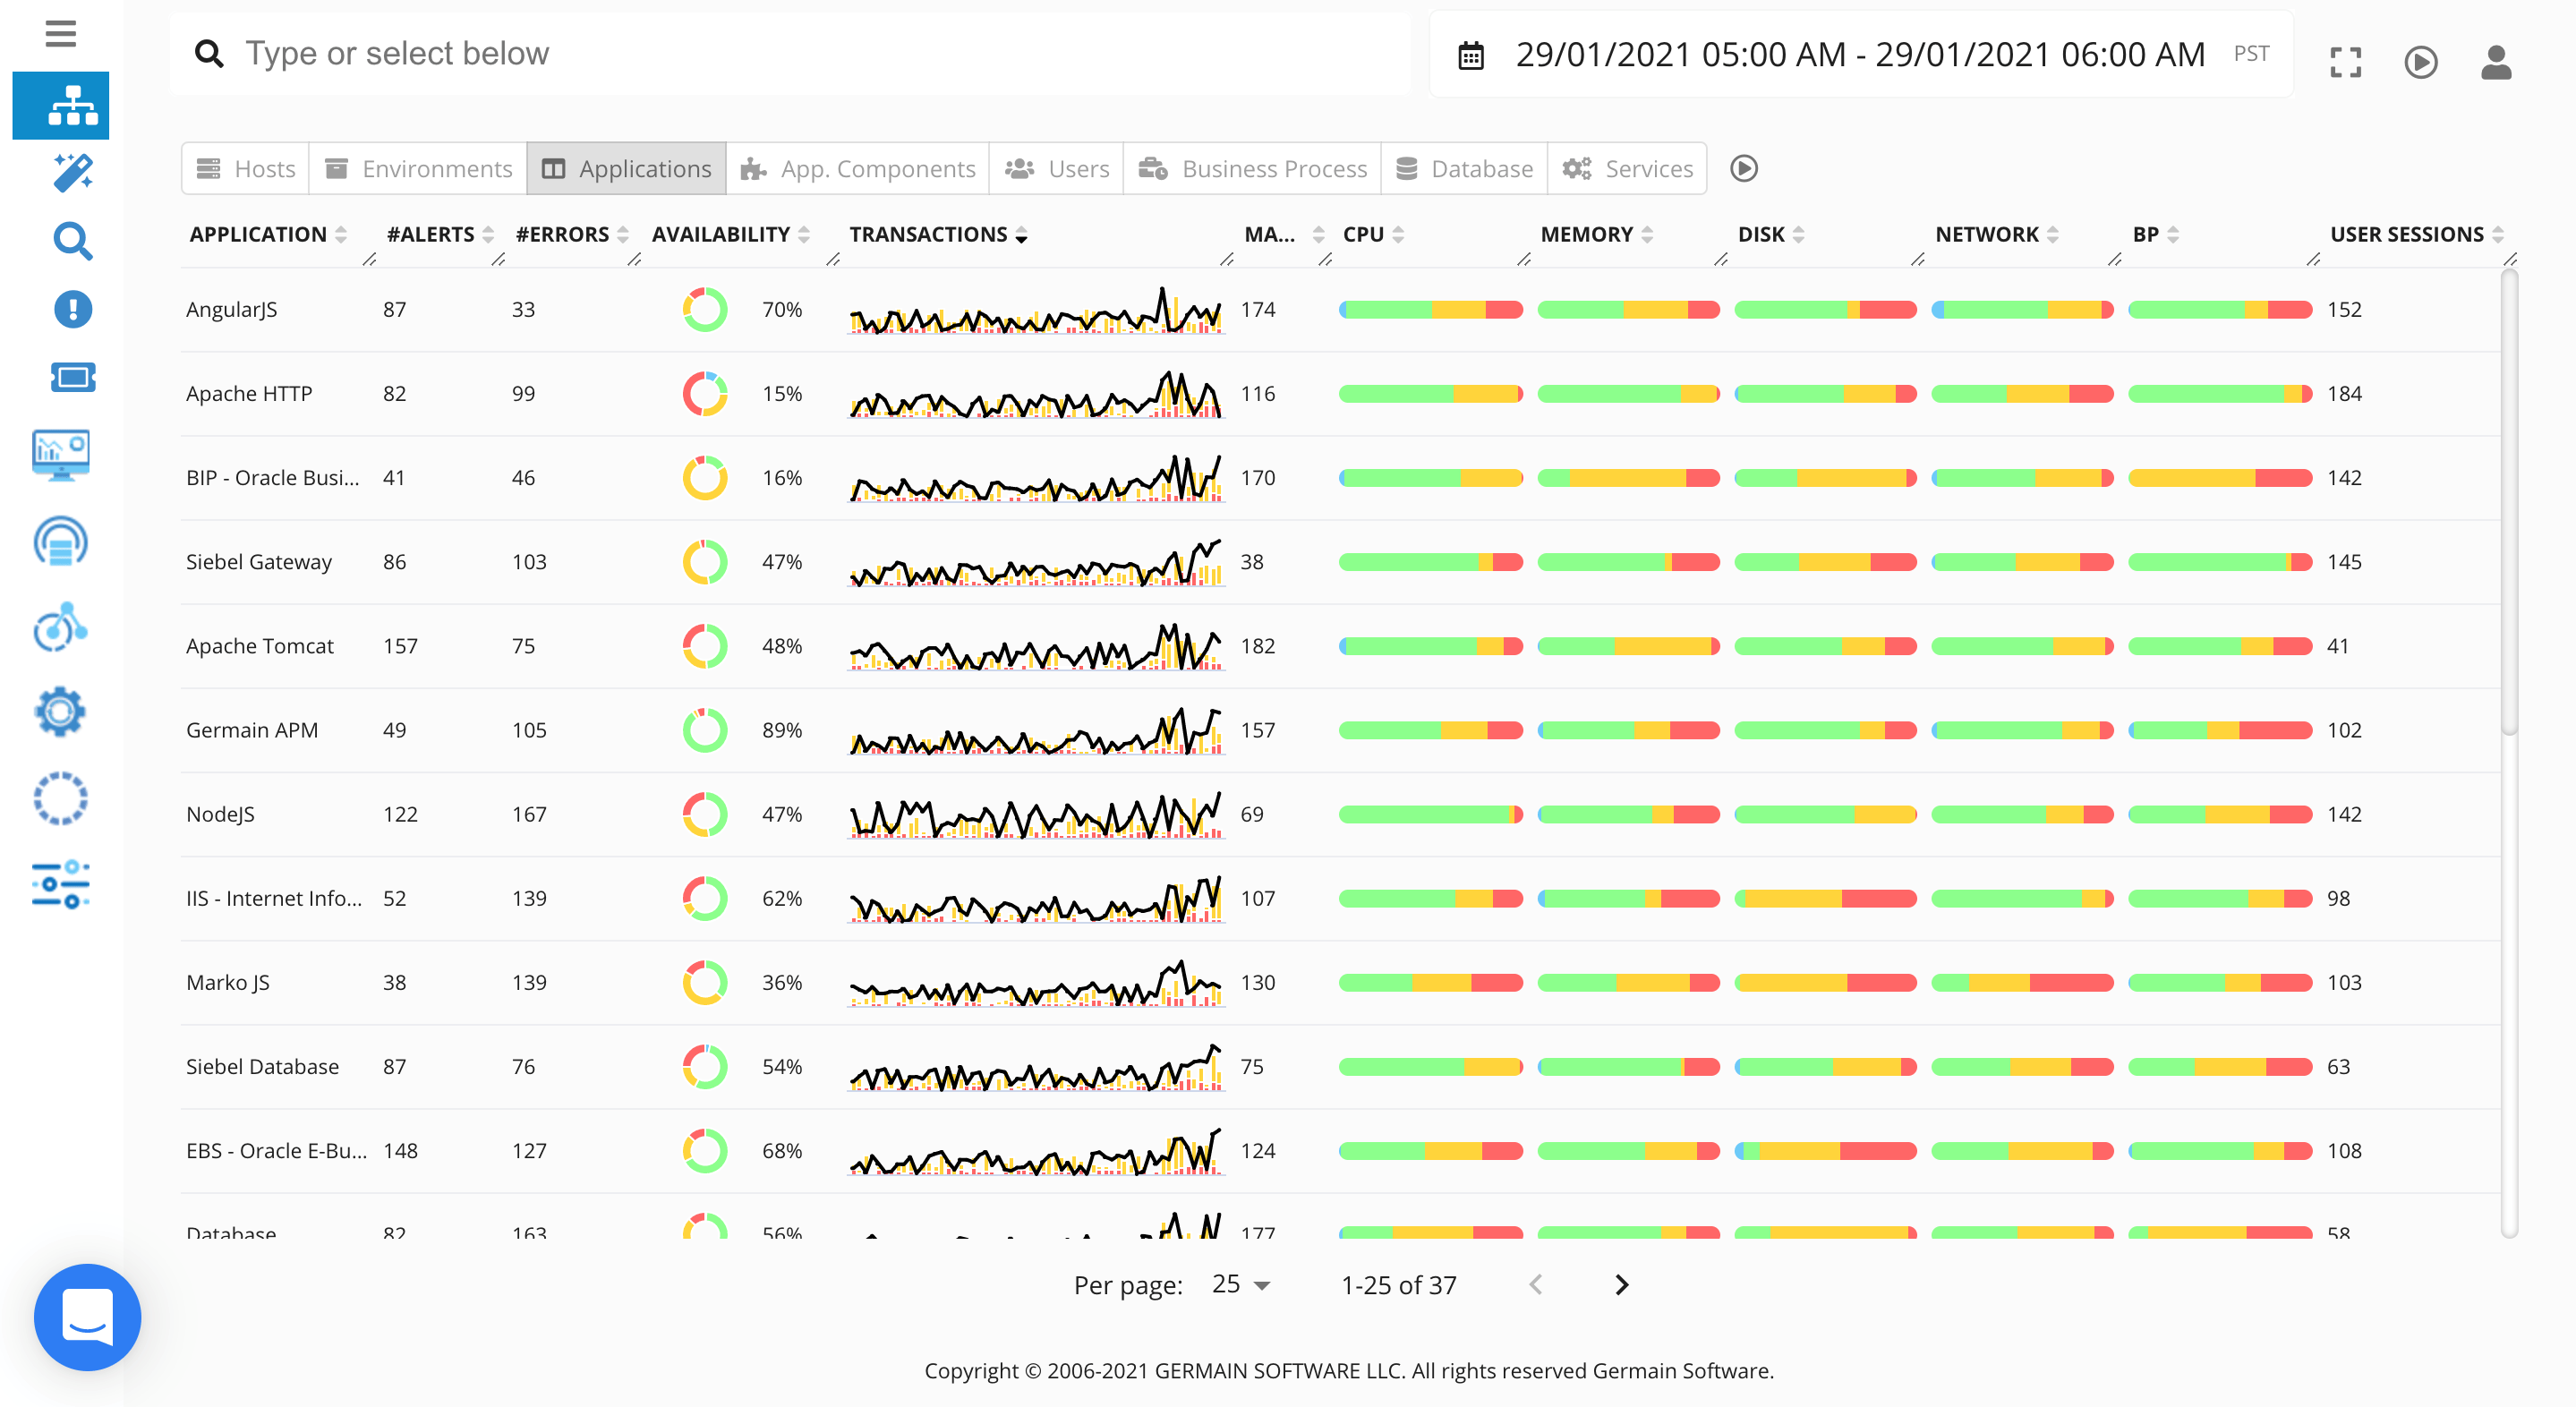
Monitoring & Analytics - Java (enh)
Description
Java monitoring enhancements (SSL, Http Request, Memory Analysis, CPU profiling, etc)Monitoring & Analytics - Salesforce.com (01/31/21)
Description
Germain ‘s chrome extension is now available on Google Chrome store. Benefits you will get: Monitoring & Analytics - Salesforce.com (12/31/20)Download & Configure
click hereBenefits
Monitoring & Analytics - Salesforce.com (12/31/20)Monitoring & Analytics - WebLogic
Description
Outbound requests monitoring enhancementsMonitoring & Analytics - WebSphere
Description
JSP monitoring enhancementsMonitoring & Analytics - Smart Insights (historical data analysis & prediction)
Description
Historical Data Analysis and Predictive Analytics engines have both been enhanced to provide better insights. And now they are preconfigured and enabled out-of-the-box (many customers never benefited from these before…!)Example
Alert1: Disk Usage is predicted to exceed 90% in a week from now Alert2: User Errors Volume has increased by 22.7% this monday compared with last monday Alert3: Sales Forecast predicted to be 70% accurate by month-end Alert4: eCommerce visitors predicted to be 40% higher by month-endMaintenance - ElasticSearch 7.8 (ready)
Description
ElasticSearch 7.8 support as datastore for Germain is now ready. We spent the last 2 months scaling it and fine tuning it, so we can provide maintenance support to clients that are interested in replacing their existing relational db with ELK.Get Help
Contact GermainUX Support
The GermainUX team helps you get up and running faster, empower your team, turn data into actionable insights, and optimize performance to deliver measurable business outcomes.
Can't find what you need?
Search all GermainUX docs with Ctrl + K, or use the feedback buttons at the bottom of this page to tell us what is missing.
The content of this document is proprietary to GERMAIN SOFTWARE.