
⚙️ Configure Analytics, Automation, Dashboards, and Reports for Go
After deploying Go code profiling and usage monitoring, verify that GermainUX is receiving profiling data from the Go application. The standard Go monitoring configuration is preconfigured and can be customized when your requirements differ.
🔎 Verify the monitored application
In GermainUX Workspace, confirm that the following entities are enabled and correctly associated:
|
Entity |
Verify |
|---|---|
|
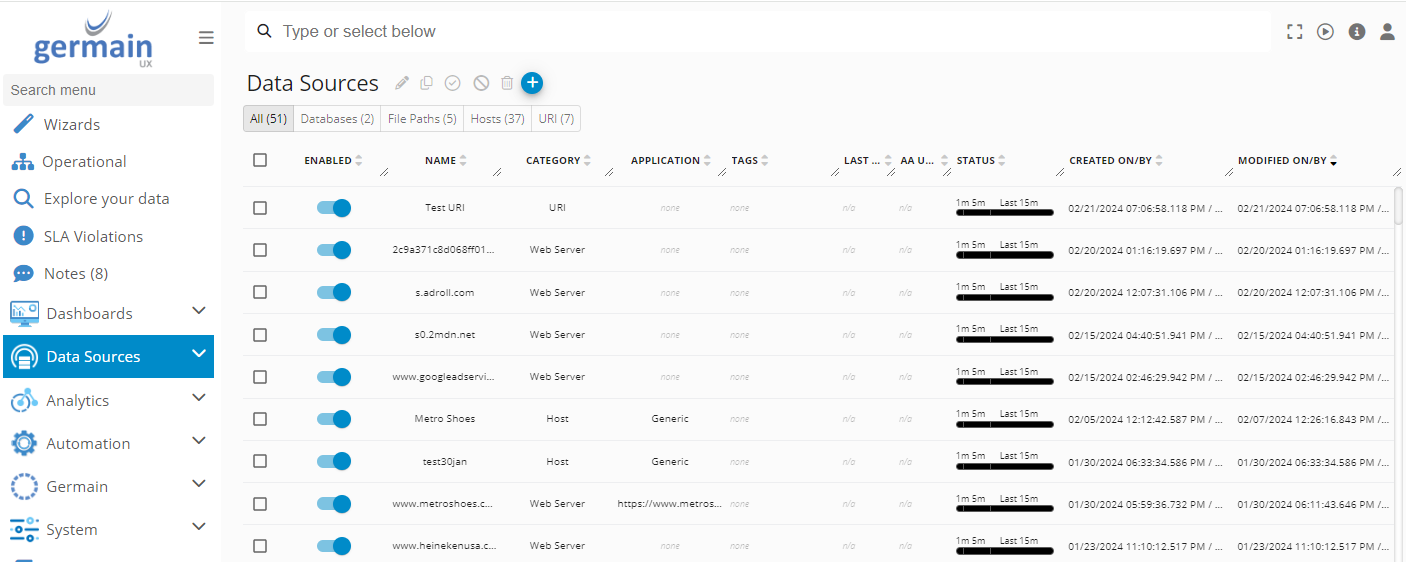
Data source |
Go profiling endpoint, host, port, URI, and collection schedule
|
|
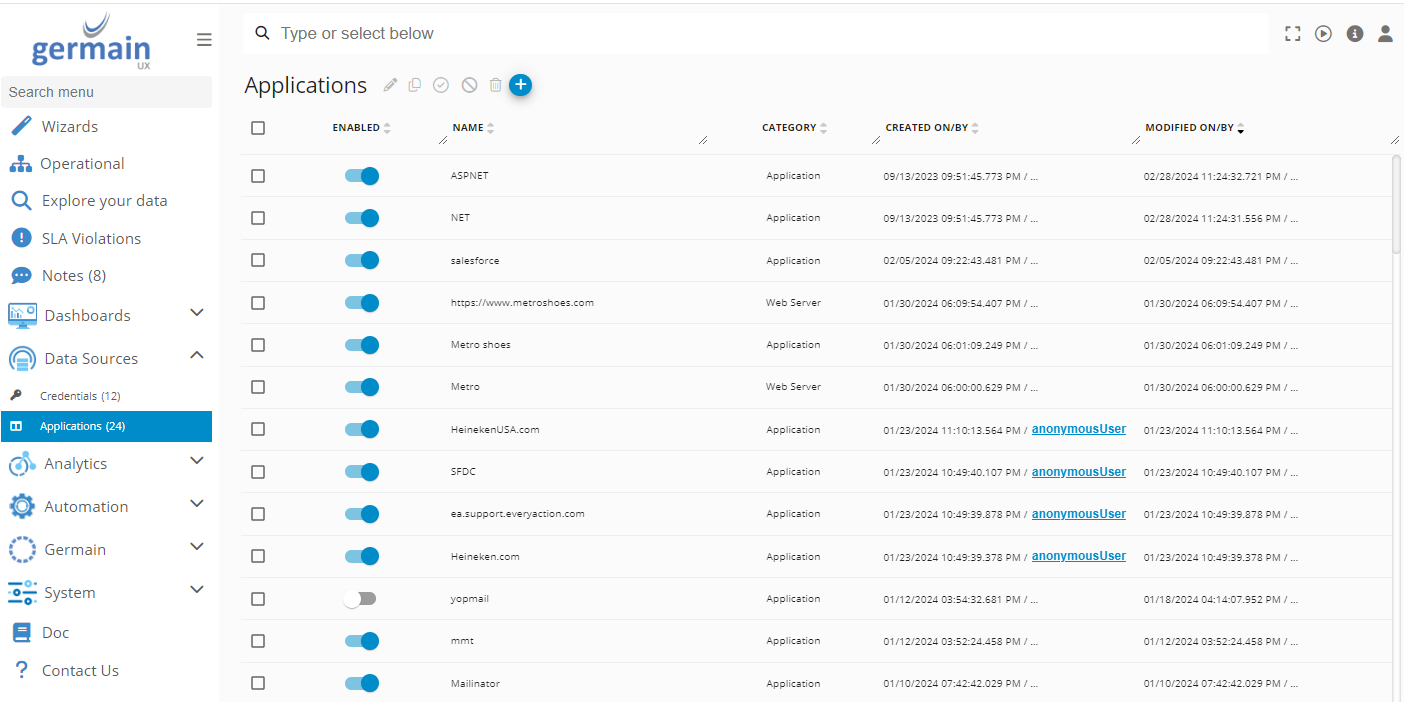
Application |
Application name, environment, monitored server, and ownership
|
|
Monitoring node |
GermainUX Engine assigned to collect the profiling data |
|
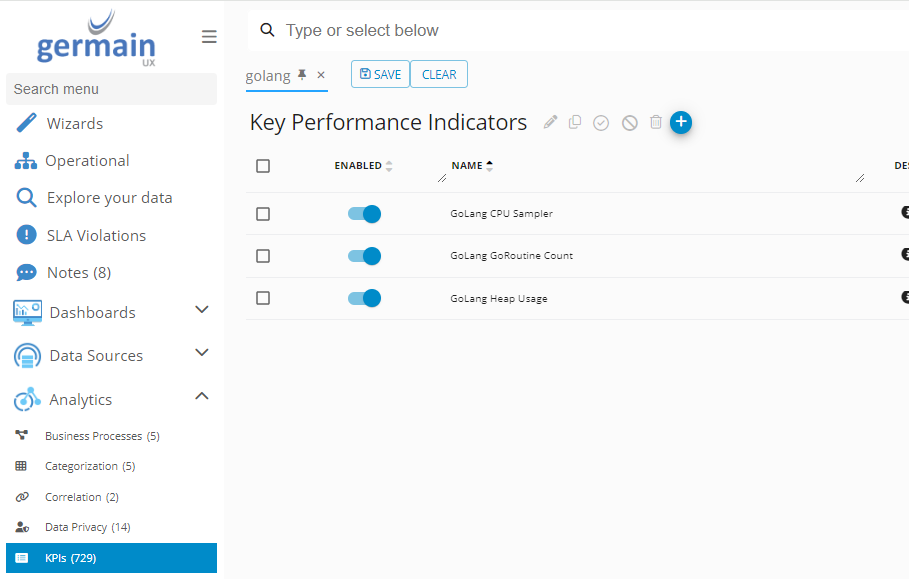
KPIs |
Required Go profiling KPIs are enabled |
|
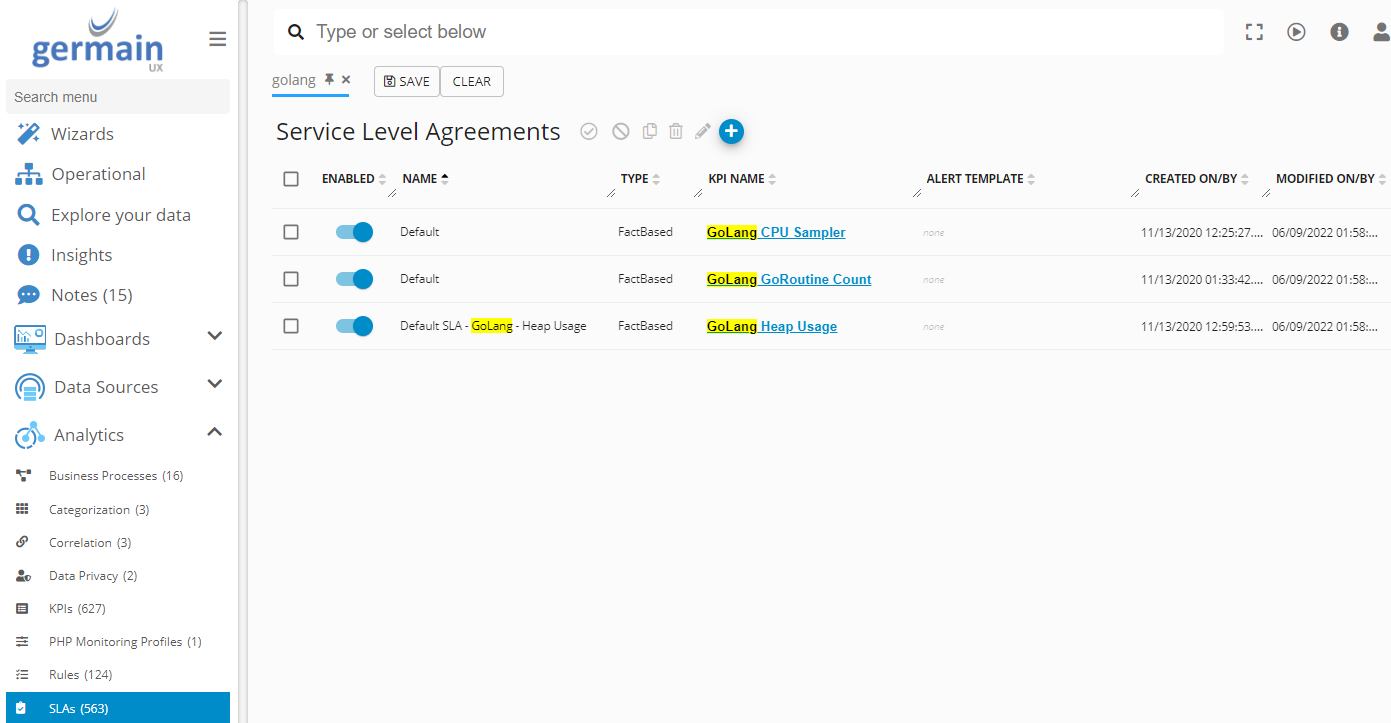
SLA |
Thresholds reflect the application’s expected operating range
|
📊 Go analytics
Depending on the profiles enabled in the Go application, GermainUX can collect and analyze:
|
Insight |
Purpose |
|---|---|
|
CPU profile |
Identify functions consuming the most CPU time |
|
Heap usage |
Find memory retained by functions and allocation paths |
|
Allocations |
Analyze the volume and source of memory allocations |
|
Goroutine count and stacks |
Detect blocked, leaked, or unusually numerous goroutines
|
|
Mutex contention |
Identify lock contention when mutex profiling is enabled |
|
Blocking operations |
Identify blocking call paths when block profiling is enabled |
|
Thread creation |
Analyze operating-system thread creation |
|
Profile trends |
Compare profiling measurements across time, releases, servers, or application instances |
The data available depends on the Go profiles exposed by the application and collected by the GermainUX Engine. Business transactions, handled errors, HTTP status codes, and request-level attributes require corresponding logs, metrics, or application instrumentation; they are not produced automatically by Go pprof.
KPIs and measures
The standard configuration can include KPIs such as:
-
Go CPU samples
-
Go heap usage
-
Go allocation activity
-
Go goroutine count
Use KPIs, pivots, and measures to customize aggregation, grouping, filtering, and analytical dimensions.
SLAs
Configure SLAs for conditions that require evaluation against an expected operating range, such as:
-
Excessive CPU activity
-
Unusual heap growth
-
Abnormally high goroutine counts
-
Increased allocation activity
-
Sustained mutex contention or blocking
Set thresholds from observed application baselines. A temporary increase during deployment, startup, batch processing, or load testing does not necessarily indicate a problem.
Categorization
Use categorization to group related profiling evidence by attributes such as:
-
Application and service
-
Environment
-
Host or container
-
Release or build
-
Function, package, or call path
-
Profile type
Correlation and tracing
Use correlation and tracing to connect Go profiling evidence with related telemetry available in GermainUX, including:
-
Application logs and errors
-
Service or API transactions
-
Infrastructure and container metrics
-
Database activity
-
Business-process events
-
User sessions and browser activity
Correlation requires compatible timestamps, identifiers, and attributes across the participating data sources.
Alerts and automated actions
Create an alert when a Go KPI or SLA reaches a condition that requires attention.
Examples include:
-
CPU consumption remains above its expected range.
-
Heap usage continues to grow across consecutive collections.
-
Goroutine count changes unexpectedly.
-
Blocking or mutex contention becomes significant.
-
A profiling anomaly coincides with application errors or degraded transactions.
GermainUX can also execute supported automated actions when configured conditions are detected. Depending on the environment and authorization, an action can:
-
Send a notification
-
Create or enrich an incident
-
Call an approved API or webhook
-
Run an authorized diagnostic procedure
-
Start an approved remediation workflow
Apply safeguards, permissions, validation, and rate limits before enabling remediation against a production Go application. Actions that restart services, change resources, or modify application state should require appropriate operational approval.
Dashboards
Use an existing dashboard or create a dashboard for the Go application.
A Go monitoring dashboard can present:
-
CPU, heap, allocation, and goroutine trends
-
Profiling data by service, host, container, or environment
-
SLA status and violations
-
Recent alerts and anomalies
-
Functions or packages contributing most to resource use
-
Related errors, logs, transactions, and infrastructure conditions
-
Comparisons between releases or application instances
Reports
Use automatic reports to distribute Go monitoring results on a schedule.
Reports can summarize:
-
Resource-usage trends
-
Profiling anomalies
-
SLA compliance
-
Frequently affected functions or packages
-
Comparisons across environments, releases, or services
-
Alert and remediation activity
Security
Go profiling endpoints can expose function names, stack traces, runtime behavior, and other implementation details. Protect them accordingly:
-
Do not expose
/debug/pprof/publicly. -
Restrict access to the GermainUX Engine and authorized administrators.
-
Use private networking, firewall rules, TLS, and an authenticated proxy where required.
-
Limit GermainUX access according to user roles.
-
Apply appropriate data-retention and privacy policies.
Deployment and configuration
|
For your Go environment |
|---|
|
Review Go Monitoring. |
|
Verify the GermainUX Engine assigned to collect Go profiling data. |
|
Configure KPIs, pivots, and measures. |
|
Configure approved automated actions. |
|
Create or customize a dashboard. |
|
Configure scheduled reports. |
ℹ️ Get Help
The Germain Team can help you set this up. Contact GermainUX Support.
Component: Engine, JS Profiler, Mobile, RPA Bot Recorder, RUM JS, RUM Extension
Feature Availability: 2017.1 or later