Feature
Germain is preconfigured to monitor the uptime and performance of WebSphere MQ, a messaging middleware provided by IBM. It provides preconfigured Key Performance Indicators (KPIs) that you can monitor to assess the health and performance of WebSphere MQ. Some of the preconfigured KPIs in Germain for WebSphere MQ include:
Websphere MQ Queue Depth
This metric monitors the depth of queues in WebSphere MQ. It provides insights into the number of messages waiting to be processed and helps you identify potential bottlenecks or congestion in message queues.
Websphere MQ Queue Time
This metric measures the time it takes for messages to be processed in the queues. It helps you track the performance of message processing and identify any delays or inefficiencies.
Websphere MQ Oldest Message
This metric indicates the age of the oldest message in the queues. It helps you identify messages that have been waiting for an extended period, which can indicate potential issues or message processing delays.
Websphere MQ Monitor (SSH)
This monitoring component in Germain enables an SSH connection to the WebSphere MQ server to retrieve relevant performance data. It allows you to monitor the server's status, performance metrics, and other relevant information.
Websphere MQ Monitor (Local)
This monitoring component allows Germain to monitor the WebSphere MQ server locally, without the need for an SSH connection. It retrieves performance data directly from the server and provides insights into the health and performance of WebSphere MQ.
By monitoring these KPIs, Germain allows you to gain real-time visibility into the uptime and performance of your WebSphere MQ infrastructure. This helps you detect any issues or anomalies, optimize message processing, and ensure the reliable and efficient functioning of your messaging system.
Configuration
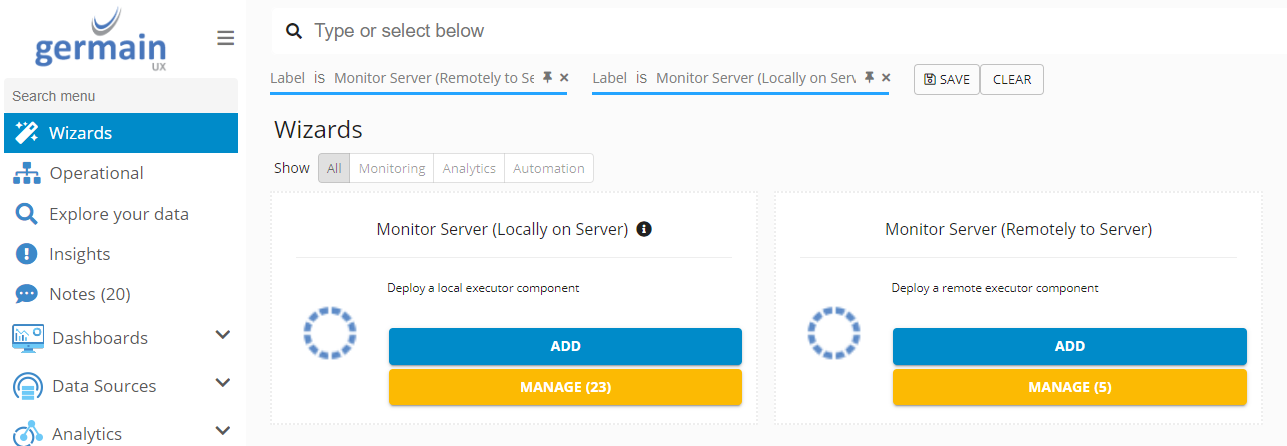
Go to Germain Workspace > Left Menu > Wizard > Monitor Server
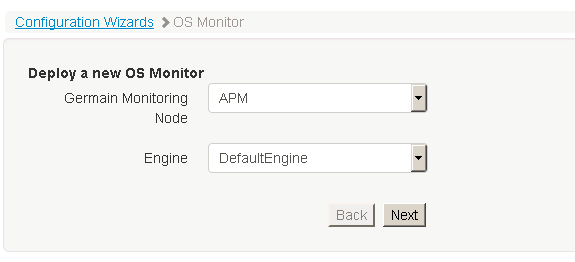
Select Node and Engine to deploy to:
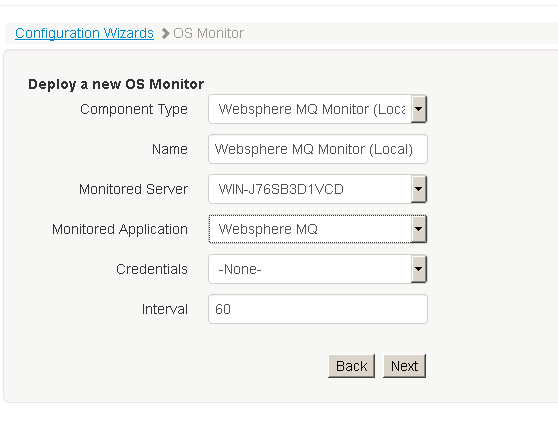
Select Websphere MQ monitor and populate remaining fields:
Confirm selection and submit: 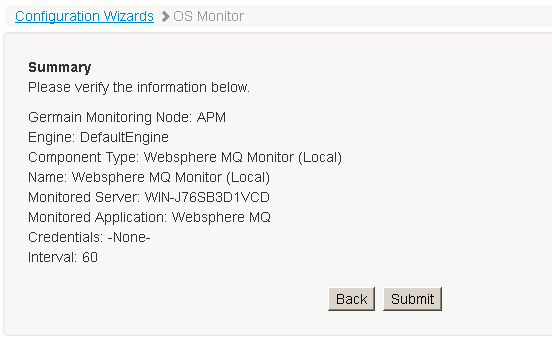
Monitoring data will be available under:Monitoring > IT > Application > IBM > Websphere MQ dashboard
Component: Engine
Feature Availability: 2022.1 or later