Feature
Germain UX provides a powerful data query API which allows users to fetch data from within the Germain Datamart. This API enables users to query and retrieve specific data based on their requirements, providing access to valuable insights and information stored within Germain UX.
The Germain data query API supports a wide range of use cases, allowing users to retrieve data for analysis, reporting, visualization, or integration with other systems. Here are a few examples of the different use cases and the corresponding URLs for querying data:
For further assistance, please reaching out to us: https://docs.germainux.com/main/support. We will provide you with further guidance and assistance tailored to your needs.
Usage
Request Format
All requests made to the Germain UX data query API follow the same format:
POST /query/query
{
   "factType": FACT_TYPE_VALUE,
   "measures": [MEASUREA, MEASUREB, ...],
   "pivots": [PIVOTA, PIVOTB, ...],
   "orders": [ORDERA, ORDERB, ...],
   "filter": FILTER_VALUE,
   "timeRange": [START_TIME, END_TIME],
   "timeOffset": TIME_OFFSET,
   "timeMode": TIME_MODE,
   "limit": LIMIT_VALUE
}
Request Parameters
factType STRING
The fact type of the KPI that you want to query. For example, for the Siebel User Txn KPI, you should use SiebelUserTransaction. Available values can be found in our Analysis Model Reference under "Facts" section.
measures ARRAY[STRING]
A list of fields to query (e.g. system.name, time.month, category, avg(duration), count(id)). For a full list of available fields, see our Analysis Model Reference. For value-fields, this list can include aggregation functions such as count, sum, avg, min, or max.
pivots ARRAY[STRING]
A list of level-fields to group the data by. For a full list of available fields, see our Analysis Model Reference. When specifying a pivot field, that field should also be included in the list of measures in most cases.
orders ARRAY[STRING]
A list of sort-orders including the field to sort on as well as the sort order (either asc or desc). Example: duration desc
filter STRING
A constraint to filter the KPI data by. See Analysis Model Reference under "Defining a Portlet Constraint" section.
timeRange ARRAY[STRING]
A time interval to constrain the result data. The start of the time range is inclusive, whereas the end is exclusive. The expected format for each time stamp follows ISO-8601. Example: ["2020-05-01T00:00:00+02:00", "2020-07-31T00:00:00+02:00"]
timeOffset STRING
The time offset in which to return the result data. If not provided, this will default to the Germain UX system time-zone.
timeMode STRING
The time filter mode to use to constrain data. This corresponds to the time filter modes used on the Germain UX workspace. Valid options are: STARTS_IN, ENDS_IN, INTERSECTS, CONTAINS_IN. If not provided, this will default to STARTS_IN.
limit STRING
An optional expression to provide the offset and maximum number of rows returned in the result set. The format is offset, limit.
Response Format
A successful response to a data query request will contain the following fields:
{
    "descriptor": {
        "cached": false,
        "error": null,
        "rawCount": 0,
        "resolution": "60",
        "resultCount": 2,
        "resultCountUnfiltered": 2,
        "factType": "UxSession"
        "id": "6f0235e7-f1ac-485b-8396-91f5a8eab9bb",
        "source": "AGG",
        "timeOffset": "+02:00"
    },
    "rowIndex": 0,
    "rowCount": 2,
    "data": [{
        "color": "ORANGE",
        "count(id)": 1042,
        "status": "200"
    }, {
        "color": "GREEN",
        "count(id)": 1741,
        "status": "200"
    }]
}
Response Fields
descriptor OBJECT
Metadata associated with the result. In case the request failed, the error field will contain more information.
rowIndex INT
Data offset when using limit in query request.
rowCount INT
Actual number of rows returned when using limit in query request.
data ARRAY
An array of results containing the measures specified in the query request.
Authentication
All requests to the Germain UX data query API require authentication.
Basic Authentication
During testing, it is possible to include a basic auth header with each request:
Authorization: Basic <base-64 encoded username:password>
POST /query/query
...
Session Token Authentication
For production environments, it is recommend to request a session token from the authentication provider configured for your Germain UX environment.
Cookie: SESSION=<session token>
POST /query/query
...
Bearer Token Authentication
Bearer Token authentication is supported for secure API access.
Enable Bearer Token Authentication
-
Open the Config Console.
-
Navigate to germain.apm -> services -> authentication
-
Set the bearerAuthenticationEnabled property to true
-
Restart the Germain REST service for the changes to take effect.
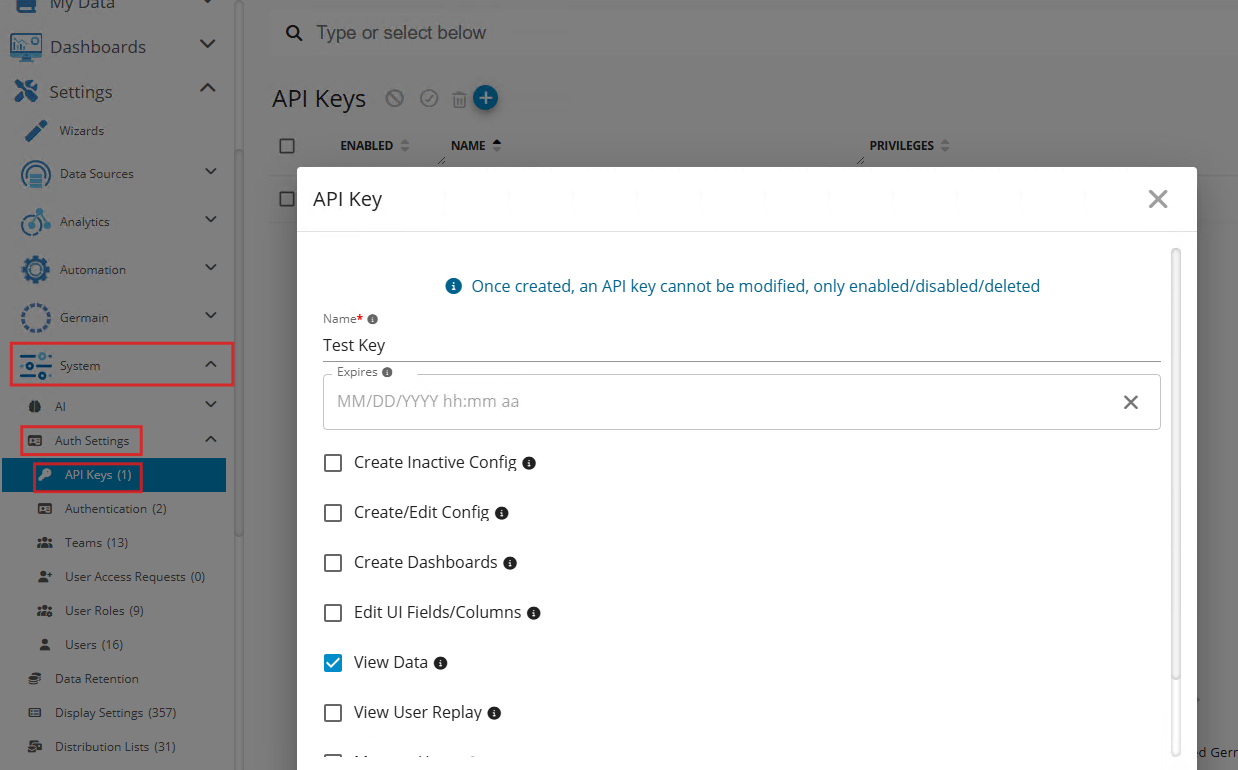
Create an API Token
-
Navigate to Settings -> Auth Settings -> API Keys
-
Create a new API key
Note: The API token/key will only be displayed once during creation. Make sure to copy and securely store it.
Use the Bearer Token in API Requests
Include the API token in the Authorization header:
curl --location 'https://test.germainux.com/query/query' \
--header 'Content-Type: application/json' \
--header 'Authorization: Bearer <TOKEN>' \
--data '{
   "factType": "GenericTransaction",
   "measures": [
        "timestamp",
        "name",
        "duration",
        "success"
    ],
   "pivots": [],
   "orders": [
        "timestamp desc"
    ],
    "filter": "type == '\''HTTP:Synthetic Click'\'' && name == '\''Login'\''",
    "timeRange": [
    "2026-05-20T07:00:00+05:30",
    "2026-05-20T12:00:00+05:30"
    ],
   "timeOffset": "+00:00",
   "firstPageLimit": 10
}'
Example Queries
Trend Query
Example - Average duration of Siebel User Transactions grouped by hour on 2020-07-28.
Query Request:
{
   "factType": "SiebelUserTransaction",
   "measures": ["time.year", "time.month", "time.day", "time.hour", "avg(duration)"],
   "pivots": ["time.year", "time.month", "time.day", "time.hour"],
   "orders": ["time.year asc", "time.month asc", "time.day asc", "time.hour asc"],
   "filter": "type == 'Siebel:User'",
   "timeRange": ["2020-07-28T00:00:00+00:00", "2020-07-29T00:00:00+00:00"],
   "timeOffset": "+00:00",
   "limit": null
}
Data results:
{
    "descriptor": {
        "resultCount": 20,
        "error": null,
        "id": "1c4ac7ec-cbbc-4106-b330-8ad1561d782f",
        "resolution": "60"
    },
    "rowIndex": 0,
    "rowCount": 20,
    "data": [{
            "avg(duration)": 1.1043123419,
            "time": {
                "month": 7,
                "hour": 0,
                "year": 2018,
                "day": 28
            }
        }, {
            "avg(duration)": 1.4718860759,
            "time": {
                "month": 7,
                "hour": 1,
                "year": 2018,
                "day": 28
            }
        }, {
            "avg(duration)": 1.1045165365,
            "time": {
                "month": 7,
                "hour": 2,
                "year": 2018,
                "day": 28
            }
        },
        ..........
    ]
}
Aggregate Query
Example - Count of all Siebel Errors on 2020-07-28.
Query Request:
{
  "factType": "SiebelErrorEvent",
  "measures": ["count(id)"],
  "pivots": [],
  "orders": [],
  "filter": "type == 'Siebel:Error'",
  "timeRange": ["2020-07-28T00:00:00+00:00", "2020-07-29T00:00:00+00:00"],
  "timeOffset": "+00:00",
  "limit": null
}
Data results:
{
    "descriptor": {
        "resultCount": 1,
        "error": null,
        "id": "e0472f25-fca9-4d9d-90f2-b7fad520f618",
        "resolution": "60"
    },
    "rowIndex": 0,
    "rowCount": 1,
    "data": [{
        "count(id)": 2347472
    }]
}
Drill-Through Query
Example - List of 500 raw results for CPU Usage KPI on 2020-07-28 (return multiple measures/dimensions)
Query Request:
{
    "factType": "GenericMetric",
    "measures": ["color", "id", "system.name", "system.hostname", "system.type", "system.environment", "system.location.continent", "system.location.continentCode", "system.location.country", "system.location.countryCode", "system.location.region", "system.location.city", "database.name", "database.flavor", "application.name", "application.component", "sessionId", "pid", "tid", "timestamp", "value", "unit", "type", "name"],
    "pivots": [],
    "orders": ["timestamp desc"],
    "filter": "type == 'System:CPU Usage'",
    "timeRange": ["2020-07-28T00:00:00+00:00", "2020-07-29T00:00:00+00:00"],
    "timeOffset": "+00:00",
    "limit": "0,500"
}
Data results:
    "descriptor": {
        "resultCount": 500,
        "error": null,
        "id": "c58acf4b-b56a-4bd6-a8ef-a6d3077ffb8f",
        "resolution": null
    },
    "rowIndex": 0,
    "rowCount": 100,
    "data": [{
        "color": "GREEN",
        "pid": null,
        "sessionId": null,
        "type": "System:CPU Usage",
        "tid": null,
        "database": {
            "flavor": null,
            "name": null
        },
        "unit": null,
        "system": {
            "hostname": "app01p",
            "environment": "appprd",
            "name": "app01p",
            "location": {
                "continent": null,
                "country": null,
                "city": null,
                "countryCode": null,
                "region": null,
                "continentCode": null
            },
            "type": "Siebel App"
        },
        "application": {
            "component": null,
            "name": "Siebel"
        },
        "name": "app01p",
        "id": "5b5cd110eaae5077f162d9d8",
        "value": 25.000000,
        "timestamp": "2020-07-28T20:24:48"
    }, ....
  ]
}
Data Point Query
Example - Get one particular JS error of id == '5b5cd1ec222b85440c5277bc' (return multiple measures/dimensions)
Query Request:
{
    "factType": "GenericUxEvent",
    "measures": ["time.year", "time.minute", "system.location.continent", "application.component", "color", "system.environment", "userAgent.browser", "domId", "user.name", "user.department", "type", "userAgent.family", "user.location.continent", "time.hour", "user.location.countryCode", "userAgent.os", "domName", "system.type", "user.group", "details", "id", "time.month", "user.location.region", "timestamp", "system.name", "user.location.country", "time.day", "system.location.region", "user.location.city", "ip", "displayedName", "system.location.country", "sessionId", "userAgent.device", "url", "system.location.countryCode", "user.role", "sequence", "domLabel", "businessObject", "user.location.continentCode", "user.type", "name", "system.location.continentCode", "system.location.city", "system.hostname", "application.name"],
    "pivots": [],
    "orders": [],
    "filter": "id == '5b5cd1ec222b85440c5277bc'",
    "timeRange": [],
    "limit": null
}
Data results:
{
    "descriptor": {
        "resultCount": 1,
        "error": null,
        "id": "3f62e2e3-7f02-4c9c-99b4-8e8f17e6f5ff",
        "resolution": null
    },
    "rowIndex": 0,
    "rowCount": 1,
    "data": [{
        "color": "RED",
        "ip": null,
        "displayedName": null,
        "domId": null,
        "userAgent": {
            "os": "Windows 7",
            "browser": "Chrome 67.0.3396.99",
            "family": "Chrome",
            "device": "Desktop"
        },
        "sessionId": "MO9OlD-SmoBEdM8sZEBnBd1aqa49RHaDHaADejcxQqZKUdLyJZfdRObD5wZKol-eq8IUEHrXfhVNhoBo",
        "type": "HTTP:JS",
        "url": "/oui_enu/start.swe",
        "sequence": null,
        "system": {
            "environment": "appprd",
            "hostname": "localhost",
            "name": "localhost",
            "location": {
                "continent": null,
                "country": null,
                "city": null,
                "countryCode": null,
                "region": null,
                "continentCode": null
            },
            "type": "Siebel Web"
        },
        "domName": "TypeError: Cannot read property",
        "application": {
            "component": null,
            "name": "Siebel"
        },
        "domLabel": null,
        "businessObject": null,
        "name": "Console Error",
        "details": "TypeError: Cannot read property 'InvokeMethod' of null\n    at RemoteRefresh (eval at <anonymous> (https://localhost/oui_enu/23030/scripts/3rdParty/jquery.js?_scb=:603:22), <anonymous>:30:26)\n    at <anonymous>:1:1",
        "time": {
            "hour": 20,
            "month": 7,
            "year": 2018,
            "day": 28,
            "minute": 28
        },
        "id": "5b5cd1ec222b85440c5277bc",
        "user": {
            "role": null,
            "name": "testuser",
            "location": {
                "continent": "North America",
                "country": "United States",
                "city": "San Rafael",
                "countryCode": "US",
                "region": "California",
                "continentCode": "NA"
            },
            "department": null,
            "type": null,
            "group": null
        },
        "timestamp": "2020-07-28T20:28:26"
    }]
}
Feature Availability: 2022.1 or later