
🎥 Session Replay Player
🧭 Overview
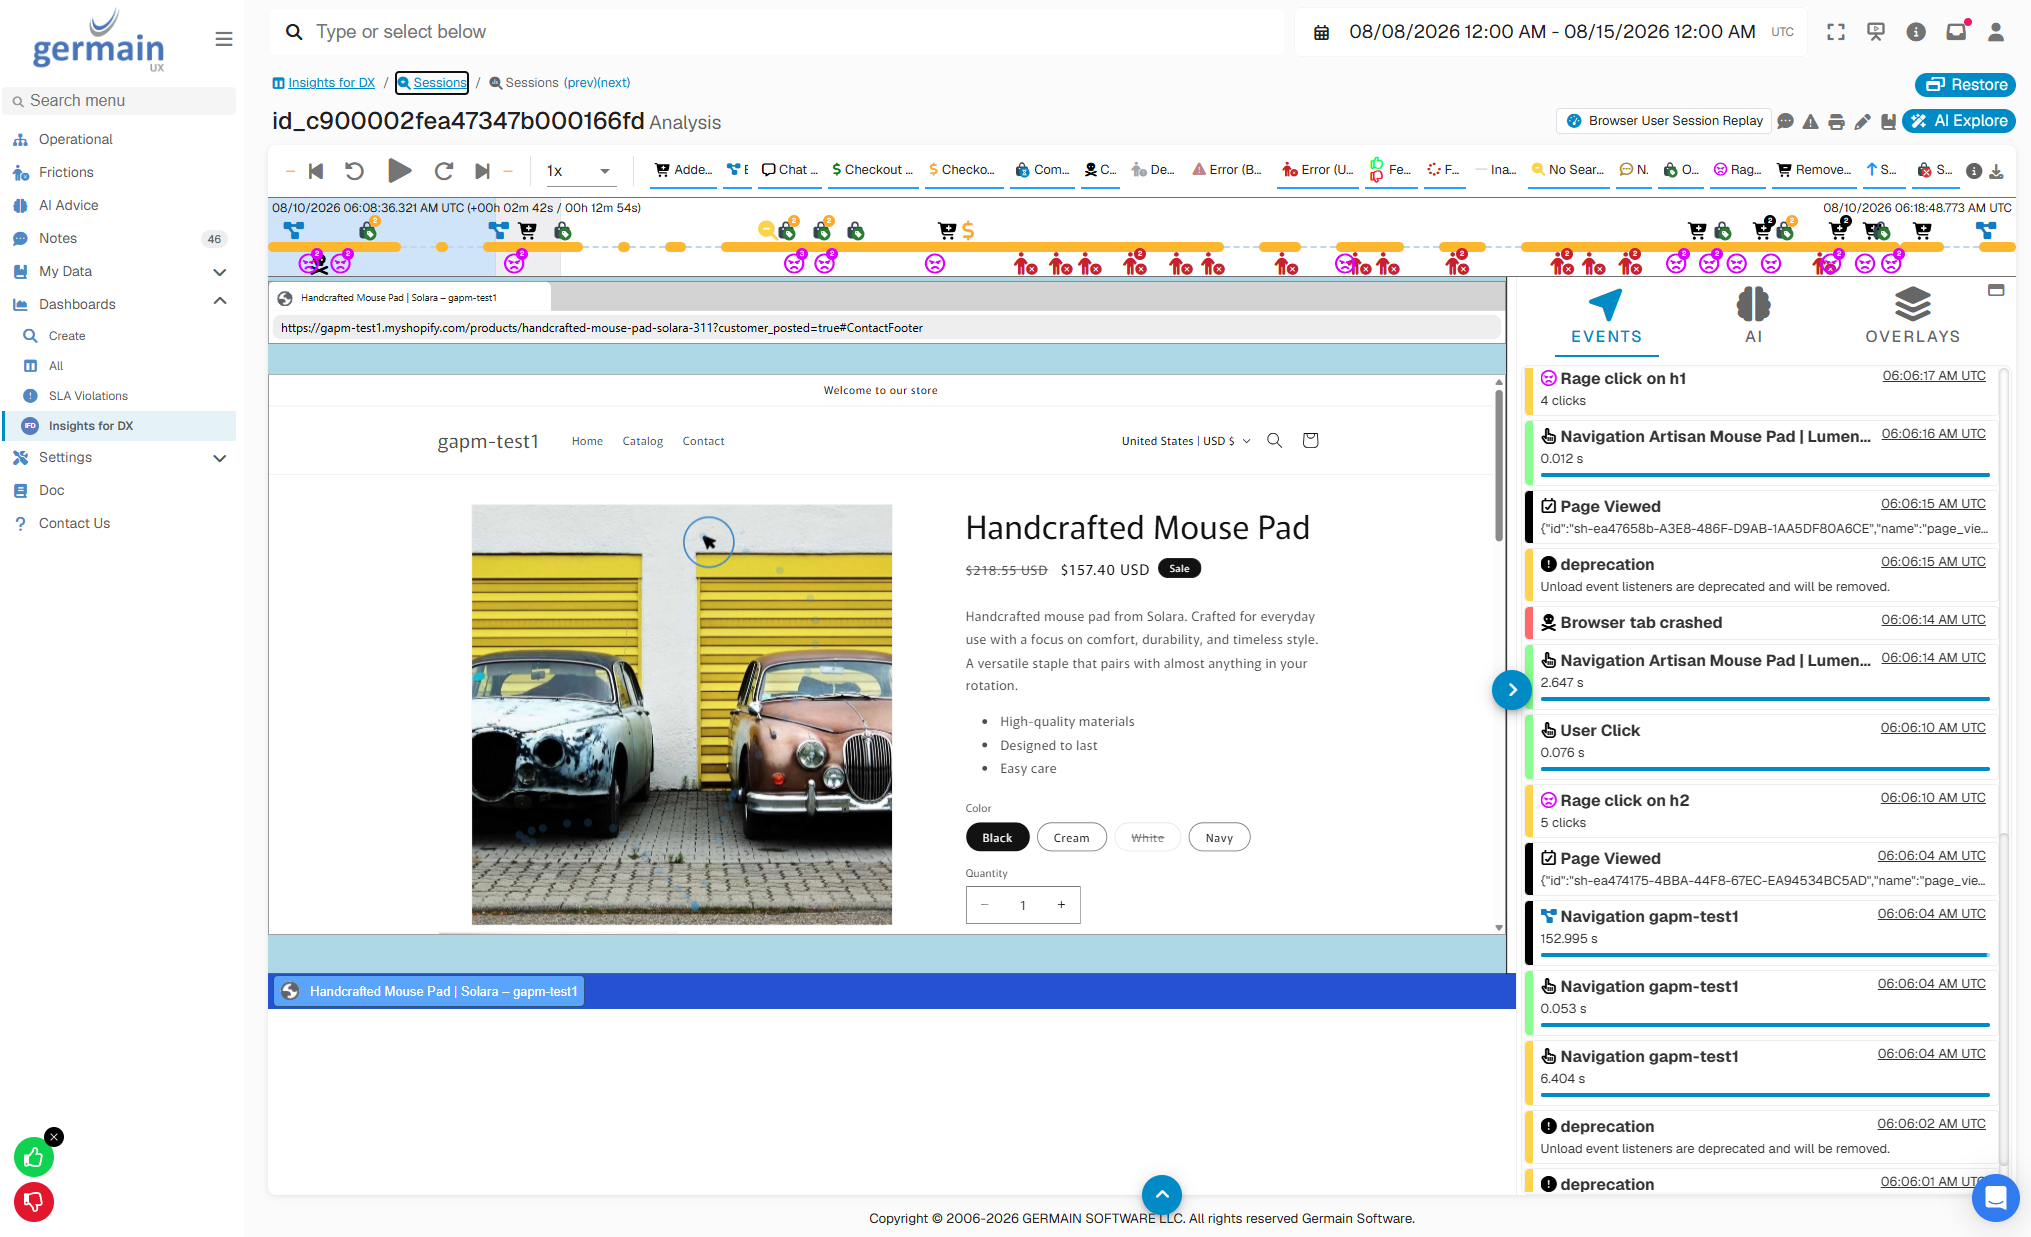
The GermainUX Session Replay Player lets you replay a recorded user session and investigate what the user experienced.
It combines the visual replay with the user's activity, errors, network requests, business-process events, performance data, and other monitored insights, helping teams understand what happened during a session and investigate potential friction or issues.
The Session Replay Player includes five main areas:
|
Area |
|---|
|
Dev Tools |
|
Events & Overlays |
|
Playback Controls |
|
Playback Timeline |
|
Replay Content |
Together, these provide both a visual representation of the user's experience and the technical and business context surrounding it.
🔧 Dev Tools
Dev Tools provides detailed information about the events, transactions, business processes, and other insights collected during the session.
It includes:
|
Feature |
|---|
|
Console |
|
Network |
|
Business Process |
|
Timeline |
|
Info |
⌨️ Console
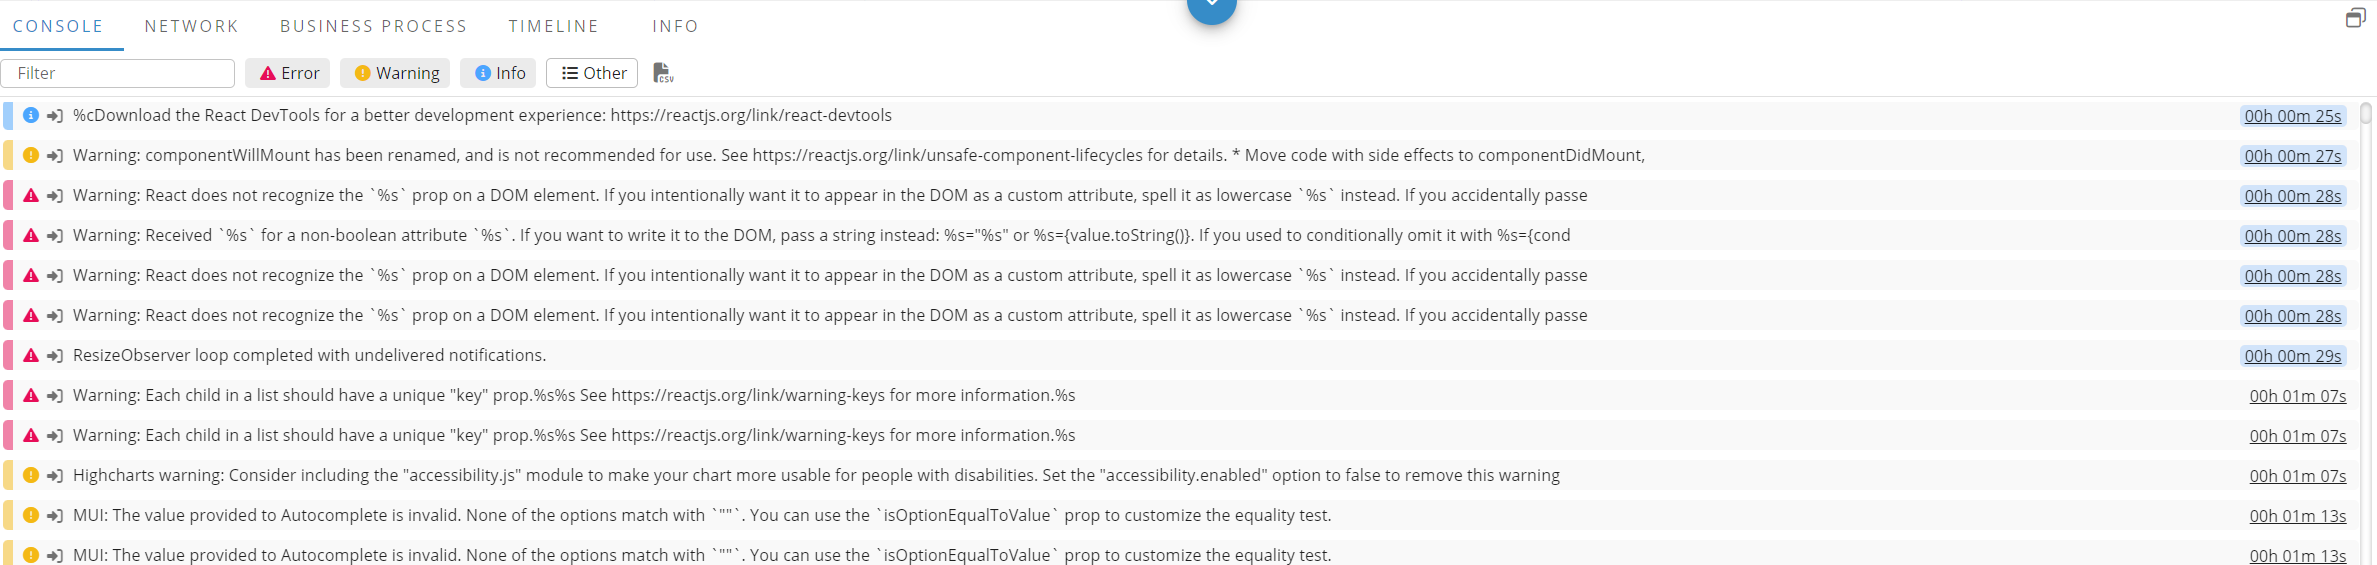
The Console displays console events captured during the session in the context of the replay.
You can:
|
Action |
|---|
|
Search console events using free text. |
|
Filter by console-event type. |
|
Export visible results to CSV. |
|
Select an event to open its RCA. |
|
Select a timestamp to move the replay to that point in the session. |
This helps correlate application errors and console activity with what the user was experiencing at that exact moment.
📡 Network
The Network view displays HTTP network requests captured during the session.
You can:
|
Action |
|---|
|
Search requests by name. |
|
Filter requests by type. |
|
Export visible requests to CSV. |
|
Export visible requests to a HAR file. |
|
Select a request to open its RCA. |
|
Select a timestamp to move the replay to that point. |
This makes it possible to investigate slow, failed, or unexpected network activity directly in the context of the user's experience.
💼 Business Process
The Business Process view displays business-process steps captured during the session.
You can:
|
Action |
|---|
|
Search business-process steps by label. |
|
Export visible results to CSV. |
|
Select a step to open its RCA. |
|
Select a timestamp to move the replay to that point. |
This helps correlate the visual user experience with the business workflow being performed.

⏱ Timeline
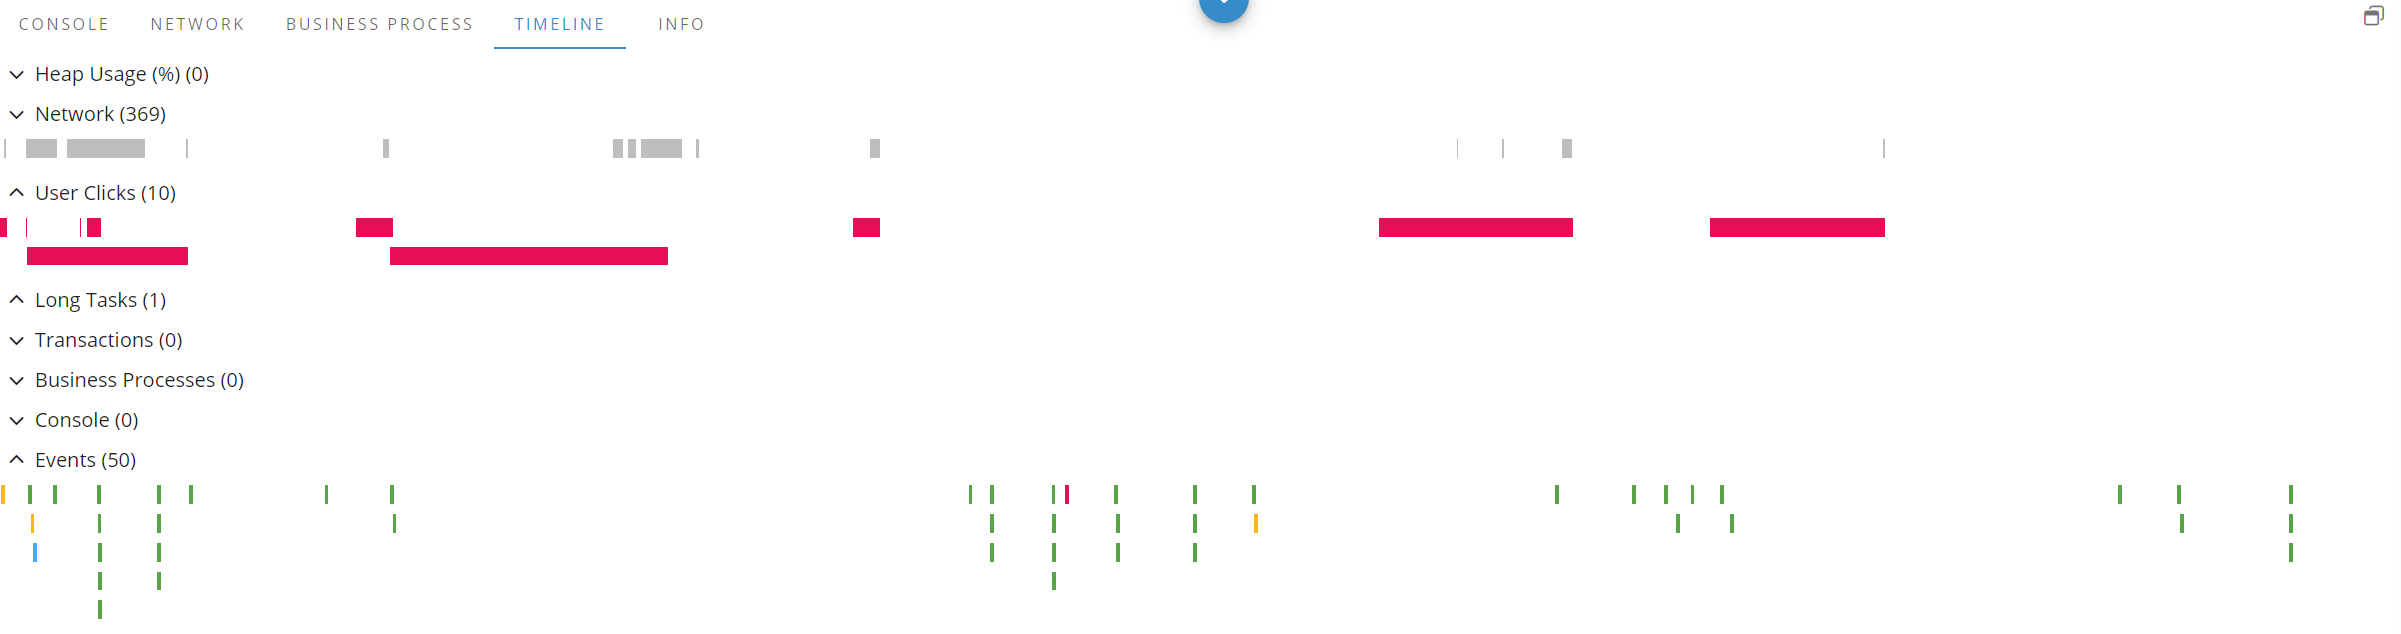
The Timeline view in Dev Tools groups facts collected during the session into categories.
Expand a category to review the facts associated with it.
Select an individual fact to open its RCA and investigate the event in more detail.
This provides a structured view of the monitored events that occurred throughout the session.
ℹ️ Info
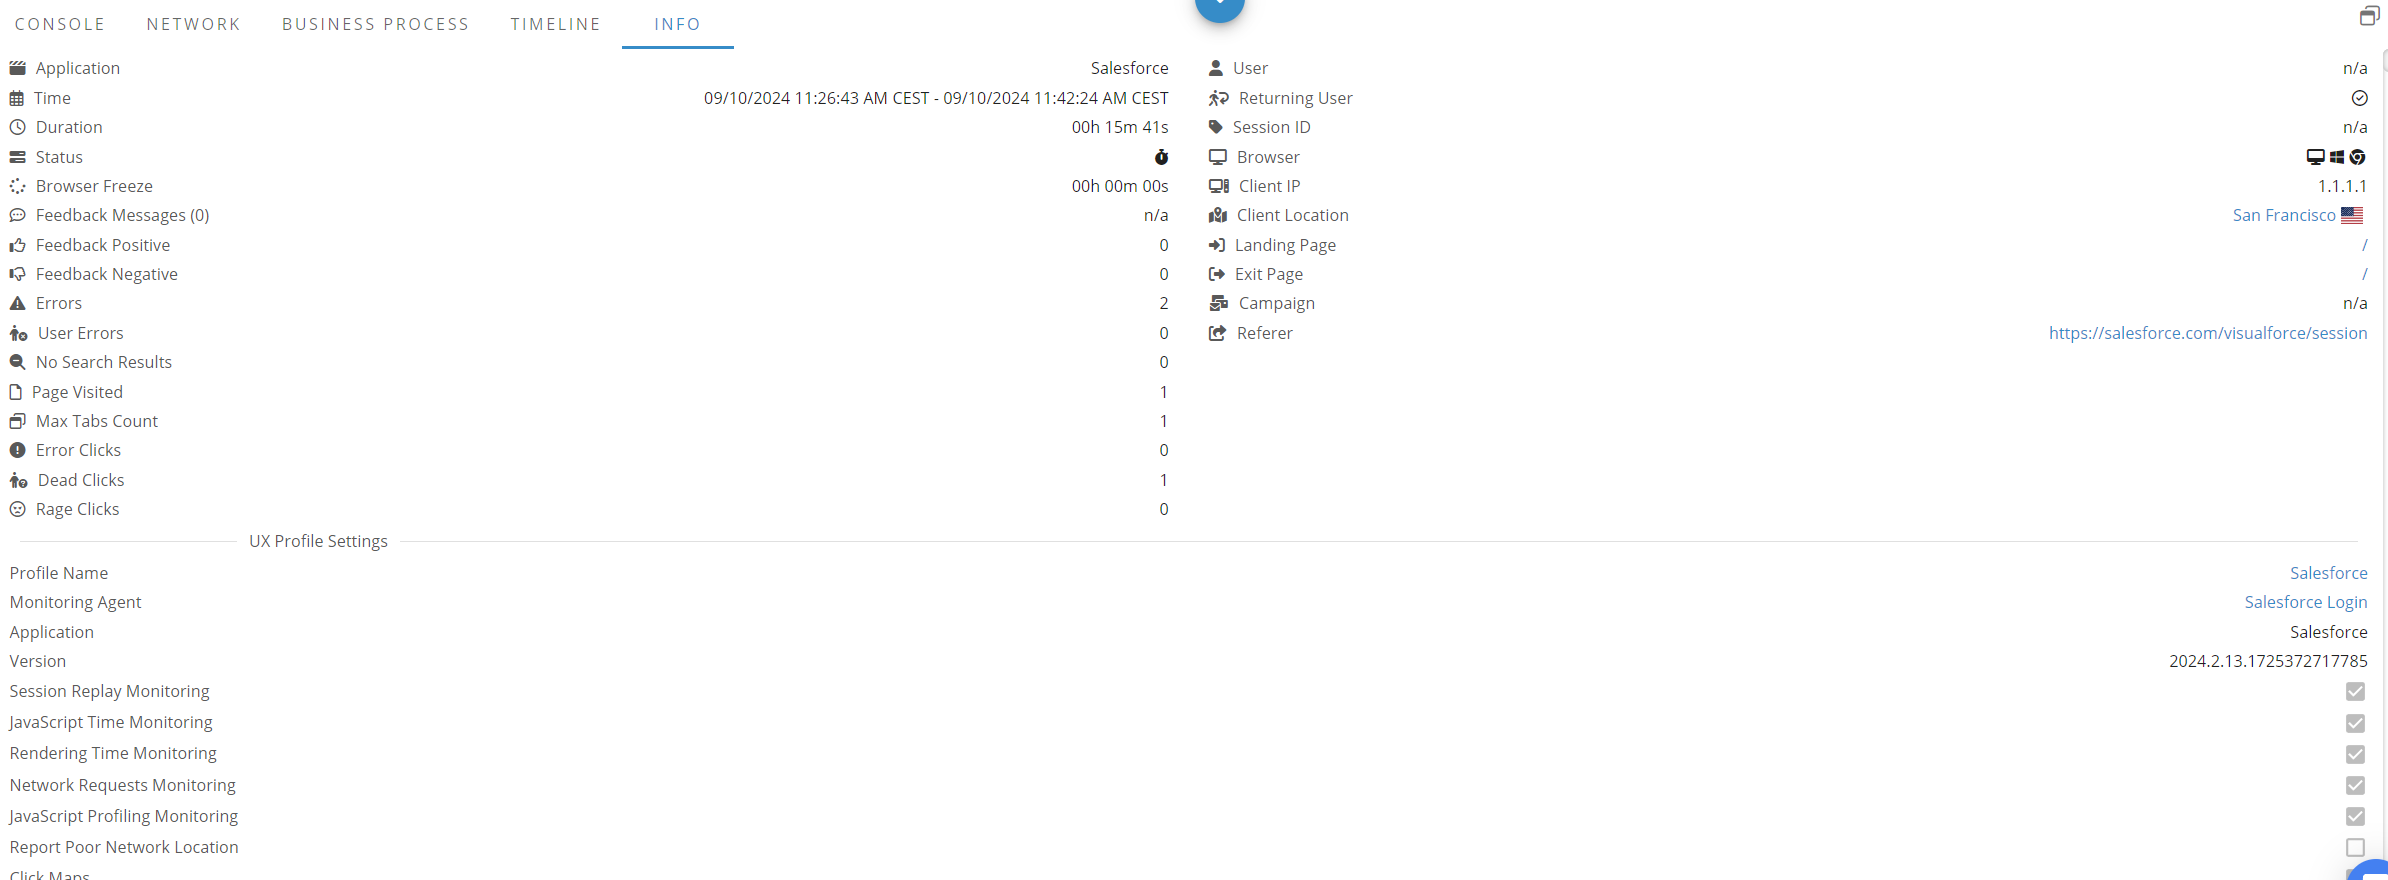
The Info view contains session details and metadata.
It also provides information about the RUM UX Monitoring configuration used when the session was captured.
Use this information to understand the context in which the recording was generated.
🗺️ Events & Overlays (Heatmaps)
Events & Overlays provides two complementary ways to investigate the user experience:
|
View |
Purpose |
|---|---|
|
Events |
Show what happened during the session. |
|
Overlays |
Show where users interacted with the application. |
🔔 Events
The Events panel displays collected events as they occur during replay.
Depending on the event, information can include:
|
Field |
|---|
|
Type |
|
Label |
|
Timestamp |
|
Details |
|
Duration |
|
Value |
|
Duration progress |
Select an event's label, type, or details to open its RCA.
Select its timestamp to move the replay to that point in the session.
The events displayed in the player can be customized through the Session Replay Player settings.
🖼️ Overlays
Overlays place interaction maps directly over the replayed application.
Available overlays include:
|
Overlay |
|---|
|
Error Clicks |
|
Rage Clicks |
|
Dead Clicks |
|
Clicks |
|
Mouse Movement |
|
Scroll |
These overlays help identify areas where users interact frequently or experience friction.
⚙️ Configure Overlay Data
By default, overlay data is based on:
|
Attribute |
|---|
|
The same application |
|
The same page location |
|
The last 7 days |
|
All users and sessions |
Use the Overlay Settings to change the population used for analysis.
📅 Time Range
Select the period from which overlay data should be analyzed.
👥 Sessions
Choose:
|
Option |
Description |
|---|---|
|
All Sessions |
Activity from all applicable sessions. |
|
User Sessions |
Activity from sessions belonging to the same user. |
|
This Session |
Activity from the session currently being replayed. |
🔝 Top Clicks
Use Top Clicks to limit the overlay to the most frequently occurring clicks.
A null or 0 value applies no limit.
This allows you to compare an individual user's behavior with the behavior of a broader population.
🎛️ Playback Controls
Playback Controls let you navigate through the recorded session.
Available controls include:
|
Control |
|---|
|
Play |
|
Pause |
|
Skip backward |
|
Skip forward |
|
Jump to the previous event |
|
Jump to the next event |
|
Change playback speed |
|
Filter displayed events |
The default skip interval is 10 seconds.
The default playback speed is 1x.
Event filters also control which events appear in the Playback Timeline and Events & Overlays.
⌨️ Keyboard Shortcuts
|
Key |
Action |
|---|---|
|
Space |
Play or pause the replay. |
|
Left Arrow |
Skip backward by the configured interval. |
|
Right Arrow |
Skip forward by the configured interval. |
🎚️ Player Settings
The right-side panel provides access to:
|
Item |
|---|
|
Session details and metadata |
|
Export of user-session events |
|
Session Replay Player settings |
Use Player Settings to customize how the session and associated events are presented.

📊 Playback Timeline
The Playback Timeline provides a visual representation of the entire recorded session.
It shows:
|
Item |
|---|
|
Total session duration |
|
Current replay position |
|
Replay progress |
|
Events |
|
User activity and inactivity |
|
Replay buffer progress |
You can select a timestamp or event to immediately move to that point in the recording.
🏃 User Activity
Activity periods help identify when the user was actively interacting with the application and when the session was inactive.
This can help you move quickly through long sessions and focus on the periods where meaningful user activity occurred.
🔍 Zoom Into a Time Range
Use Zoom In to focus the investigation on a specific portion of the session.
Select the time range you want to investigate.
GermainUX then limits:
|
Area |
|---|
|
Replay Content |
|
Dev Tools |
|
Events & Overlays |
to the selected time range.
Use Reset Zoom to return to the complete session.
This is particularly useful when investigating a specific error, business transaction, feedback event, or period of user friction within a long session.
🎞️ Replay Content
Replay Content displays the recorded user experience.
It allows you to see the application as the user experienced it and correlate the visual experience with the monitored events and data surrounding it.
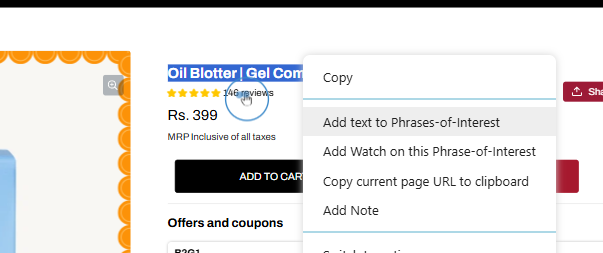
🖱️ Context Menu
Right-click within Replay Content to access additional actions.
Available actions include:
|
Action |
|---|
|
Copy — copy highlighted replay content. |
|
Add text to Phrases-of-Interest — monitor selected text in future sessions. |
|
Add Watch on this Phrase-of-Interest — create a Watch for the selected text. |
|
Add Note — attach a note to the replay at the selected location. |
|
Switch to native menu — use the browser's standard context menu.
|
📑 Phrases of Interest
If you identify important text while investigating a session, select the text and use:
Add text to Phrases-of-Interest
GermainUX can then detect that text in subsequent monitored sessions.
Examples include:
|
Example |
|---|
|
Error messages |
|
Warning messages |
|
Confirmation messages |
|
Out-of-stock messages |
|
Discounts |
|
Business-process messages |
You can also create a Watch to be notified when the Phrase of Interest appears again.
📝 Notes
Use Add Note to attach a note to a particular point in the replay.
This can help document findings or preserve investigation context associated with a specific user interaction.
🔀 Multiple Tabs & Windows
Session Replay supports monitored activity across multiple browser tabs and windows.
The replay represents the user's movement between available tabs and windows during the session.
Select a replayed tab header when you need to focus on a particular tab or application view.
🔎 Investigate an Issue
A typical Session Replay investigation can follow this workflow:
-
Open the session associated with the user, issue, feedback, transaction, or alert.
-
Review the Timeline to identify important activity periods and events.
-
Replay the relevant experience to understand what the user saw and did.
-
Review Events for errors, feedback, transactions, or other relevant activity.
-
Review Console and Network information when technical investigation is required.
-
Review Business Process activity when the issue involves a business workflow.
-
Use Overlays to understand interaction patterns and potential friction.
-
Open RCA for relevant events or transactions.
-
Zoom into the affected period for focused investigation.
-
Create a Phrase of Interest, Watch, or Note when follow-up is required.
This allows teams to move from:
What happened? → What did the user experience? → What else happened at that moment? → What should we investigate or improve?
🔒 Security & Privacy
Session Replay can contain detailed information about user interactions with monitored applications.
Access should therefore be limited to authorized users.
Organizations should also configure appropriate:
|
Control |
|---|
|
Data masking |
|
Data exclusions |
|
User and application exclusions |
|
Access permissions |
|
Data-retention policies |
|
Privacy and consent controls |
Privacy controls should be configured and validated before Session Replay is broadly enabled in production.
⚙️ Configure the Session Replay Player
The events, activity periods, monitoring behavior, privacy controls, Phrases of Interest, and custom timeline events displayed in Session Replay can be customized.
See Configure User Monitoring & Session Replay for detailed configuration instructions.
📦 Additional Resources
-
KPIs related to User Monitoring and Session Replay
-
API of User Monitoring and Session Replay
-
Session Replay Player
-
Troubleshoot User Monitoring and Session Replay
-
AI Insights & Recommendations
-
More Analytics Features
-
More Automation Features
-
Management Features.
ℹ️ Get Help
The Germain Team can help you set this up. Contact GermainUX Support.
Component: RUM JS, RUM Ext, RUM Windows
Feature Availability: 2017.1 or later